Malware frequently contains obfuscated text, and in this article, I'll utilize a debugger to swiftly deobfuscate strings without spending hours building a long script.
Sample
| Property / Field | Value |
|---|---|
| MD5 | 59f29651edbda4e3fc6ce4a5aaa22c0d |
| SHA-1 | 507409ea35fc4da1ddda1e062edeab3ef23f314d |
| SHA-256 | 6af71ce9dee0149f3e7237736dbe29125793052b1fdb2381ffd09f8cf85e6135 |
| Vhash | 115046655d155.z1 |
| Authentihash | 2892f48703ea708c1407f72de5438591982f4184b9628d3c6a29332e7b6a3905 |
| Rich PE Header Hash | 2773ed4e62f0e2a6e8e0dd4029fa28fa |
| SSDEEP | 3072:oWq0FAEmWR7lapxNQcH8VzvYykSRYPCSknzuTz2154MkkOYi4:txWvdp40o9ICZzK61O51c |
| TLSH | T176F35B14E5D305F7E8E70572500A7A9FE8743845A614CE7B9A54CFDABF20B22A21D32F |
| File Type | Win32 DLL executable windows win32 pe pedll |
| Magic | PE32+ executable (DLL) (GUI) x86-64, for MS Windows |
| TrID | Windows Icons Library (25.4%) · OS/2 Executable (25%) · Generic Win/DOS Executable (24.7%) · DOS Executable Generic (24.7%) |
| DetectItEasy | PE64, Compiler: Microsoft Visual C/C++ (18.00.31101) [LTCG/C++], Linker: Microsoft Linker (12.00.31101), Tool: Visual Studio (2013) |
| Magika | PEBIN |
| File Size | 164.00 KB (167,936 bytes) |
Malicious software may contain strings, configuration details, and code that are decrypted or decoded during execution; after you have identified the code responsible for executing that dication, you should extract all of the decoded content. Common techniques to automating this process include building a Python script to programmatically extract and decode bytes, as well as using a dynamic binary instrumentation framework such as Frida. Emulation is another possibility worth considering.
But now I'd like to show you how to quickly debug your skating strings in a debugger, specifically x64 debug utilizing conditional breakpoints.
When I triage a sample, one step I frequently take is to run mandiant CAPA tools on a file. It's an incredible tool you can use to find capabilities in malware and design your own rules.
Command:
C:\Users\user\Desktop\samp>capa.exe -r capa-rules-9.4.0 print.dll -v > capa.txt I want to focus on the first category here titled encode data using xor this could be evidence of functions responsible for encoding or decoding data if I want to investigate these observations.
md5                     59f29651edbda4e3fc6ce4a5aaa22c0d
sha1                    507409ea35fc4da1ddda1e062edeab3ef23f314d
sha256                  6af71ce9dee0149f3e7237736dbe29125793052b1fdb2381ffd09f8cf85e6135
path                    C:/Users/REM/Desktop/samp/print.dll
timestamp               2026-07-27 08:59:33.518544
capa version            9.4.0
os                      windows
format                  pe
arch                    amd64
analysis                static
extractor               VivisectFeatureExtractor
base address            0x180000000
rules                   C:/Users/REM/Desktop/samp/capa-rules-9.4.0
function count          250
library function count  1
total feature count     44121

encode data using XOR (6 matches)
namespace  data-manipulation/encoding/xor
scope      basic block
matches    0x180007572
           0x18000DA25
           0x1800159FE
           **0x18001BAA4** <====
           0x180021C32
           0x1800242AD

encrypt data using chaskey (4 matches)
namespace  data-manipulation/encryption/chaskey
scope      function
matches    0x18000B0E8
           0x18000F46C
           0x180017C6C
           0x18001F888

hash data using murmur3
namespace  data-manipulation/hashing/murmur
scope      function
matches    0x18000D390

resolve function by parsing PE exports
namespace  load-code/pe
scope      function
matches 0x180019980 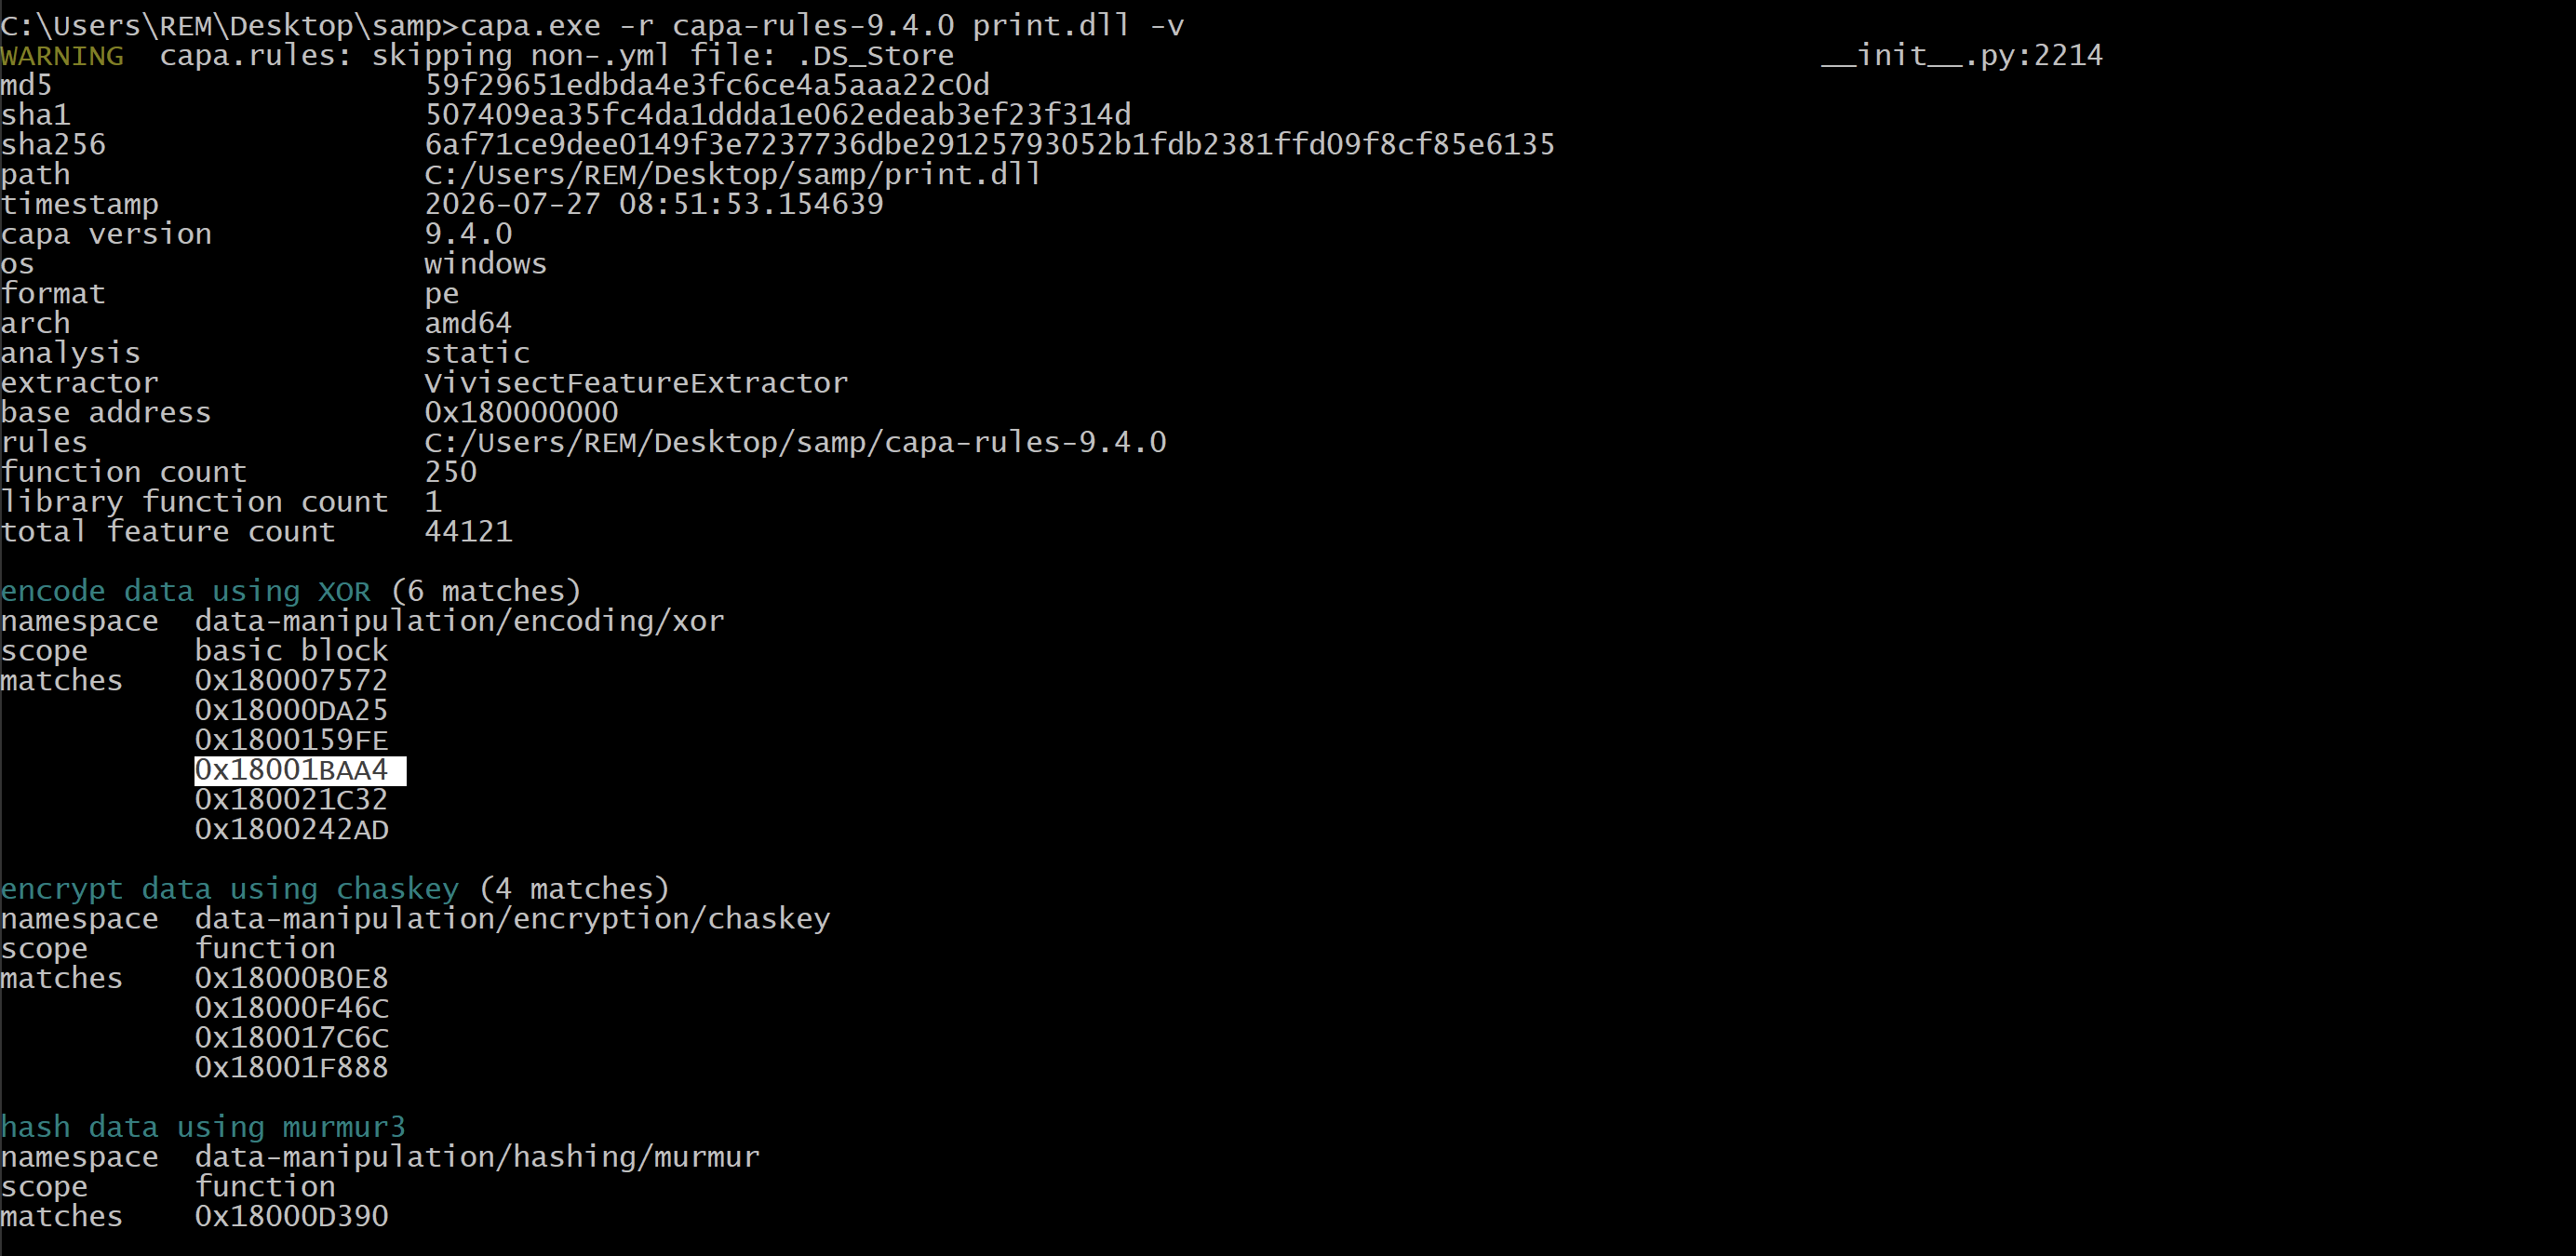
capa analysis output
Ghidra Analysis
I could jump to one of these addresses to review the code but for our discussion here today I'm going to focus on the fourth match (0x18001BAA4) which specifies the virtual address of a basic block where capa identified the xor instruction being used so next I'm going to open this dll in ghidra.
I'll go ahead and analyze this file, stick with the default settings, and then hit analyze. Grab this 0x18001BAA4 value, which is the one that we'll study here today, and let me hop to that virtual address by pushing the G button within ghidra, so this has led me to an area within the code.
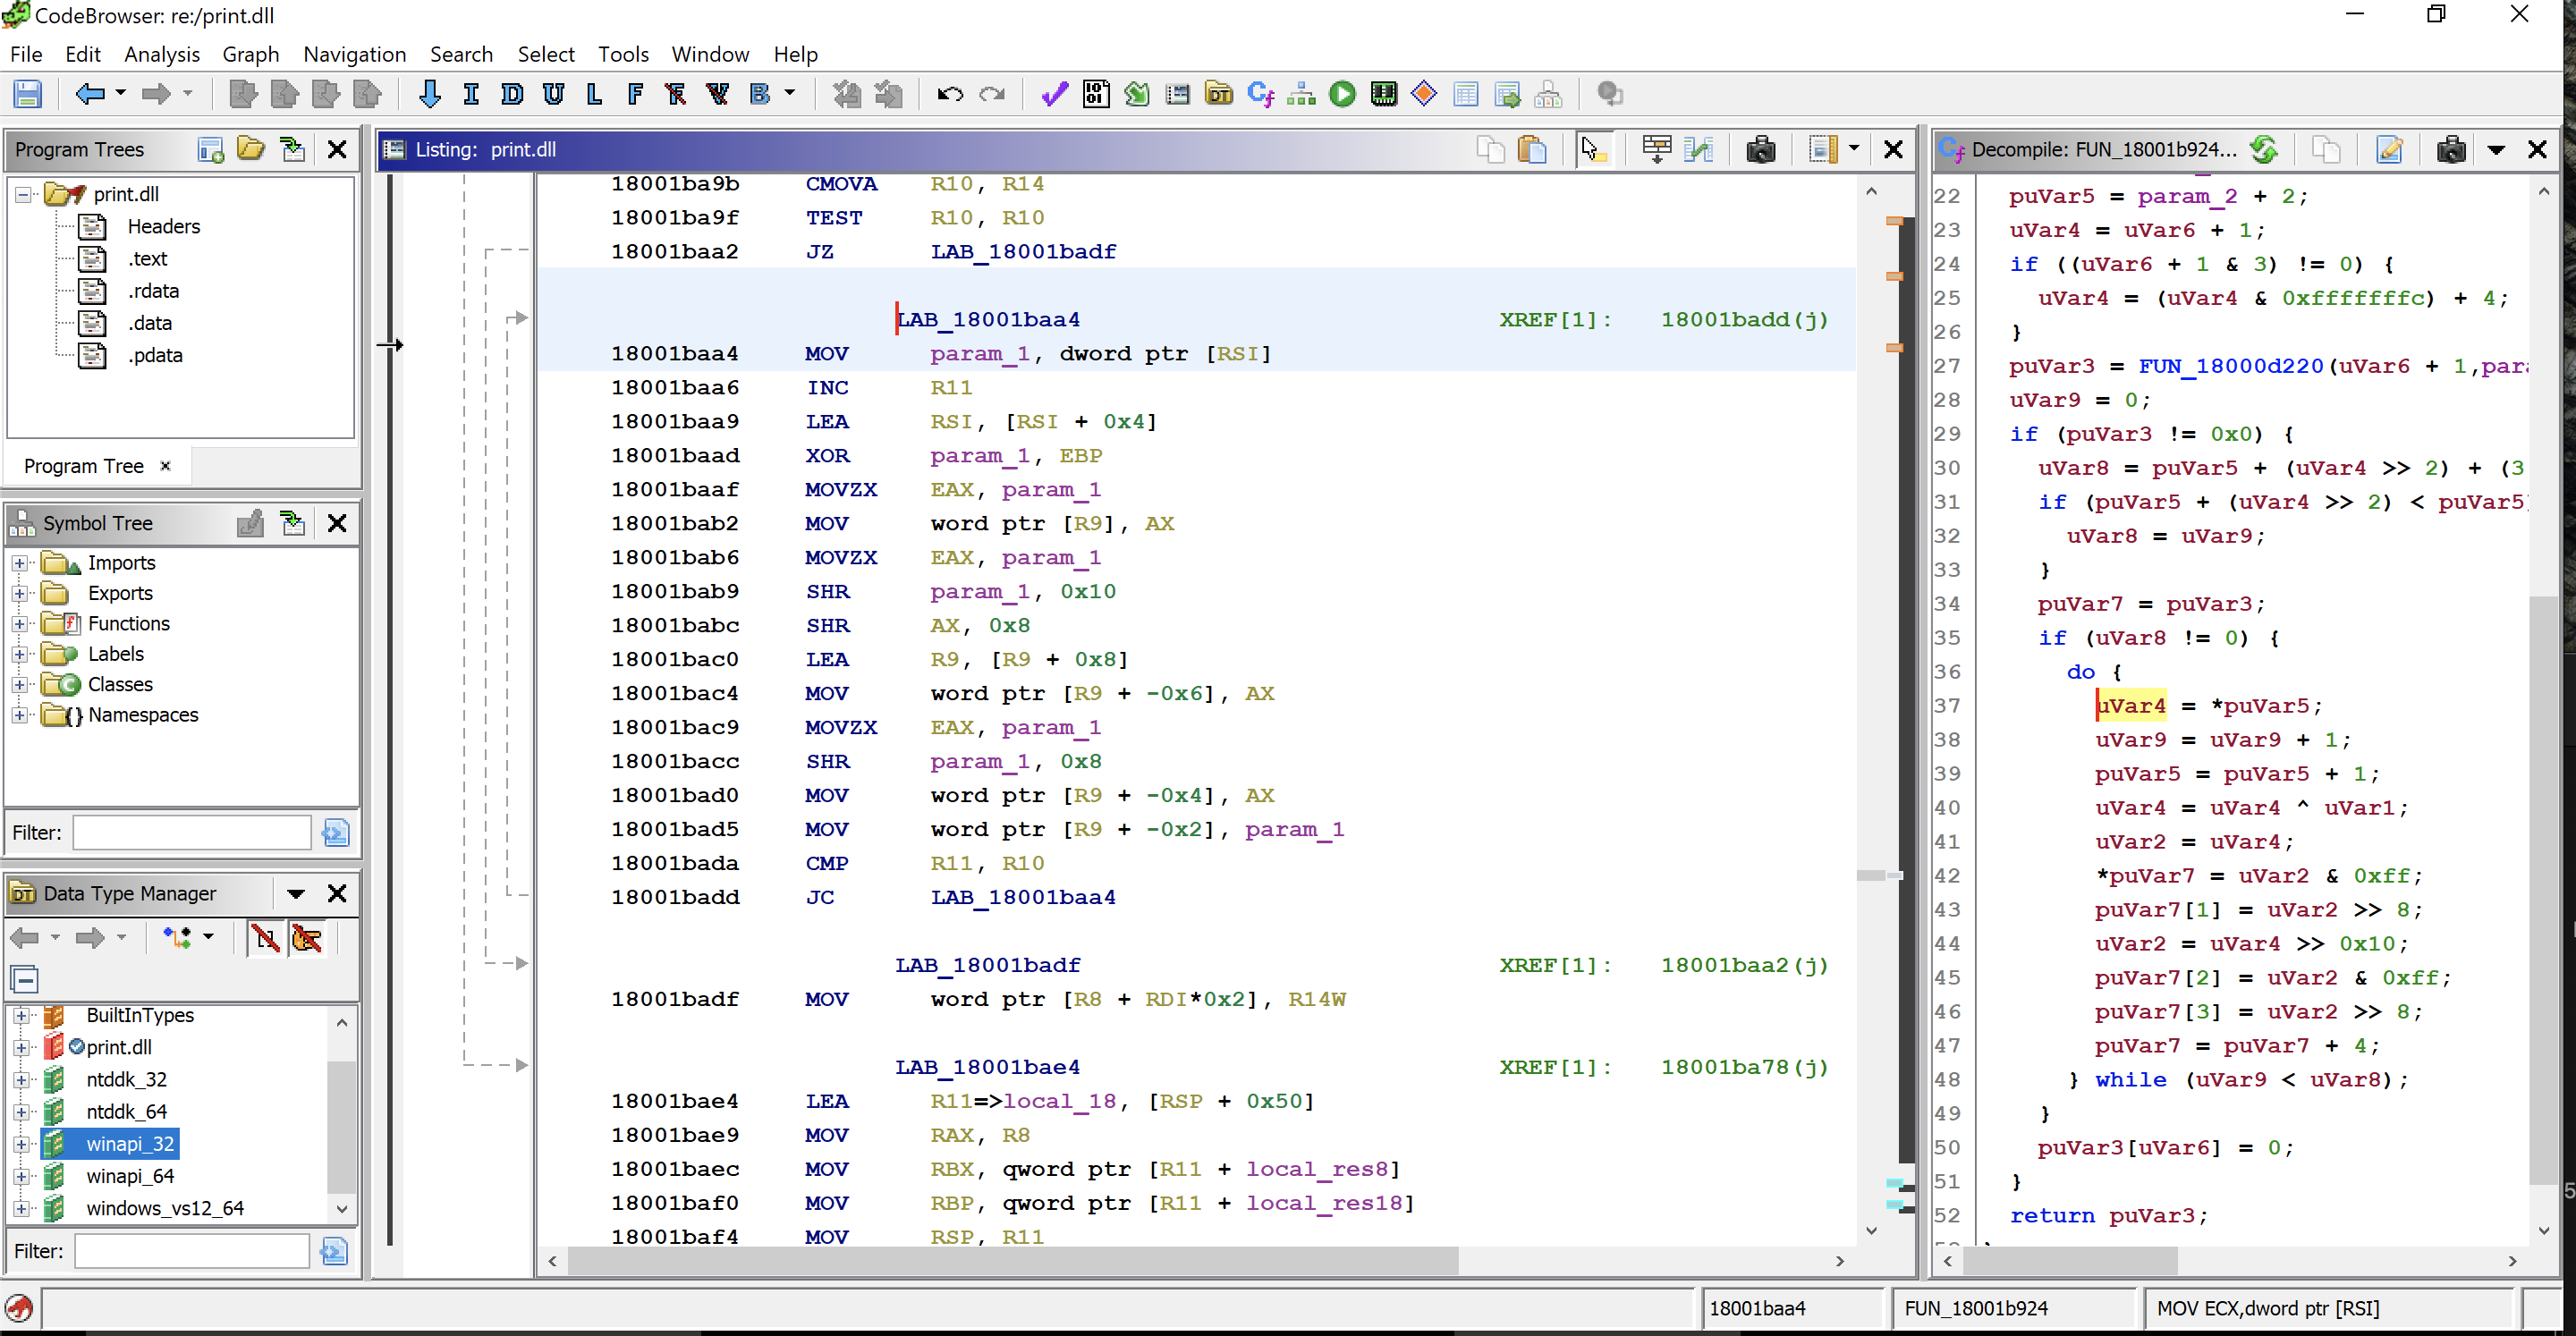
At the address 0x18001BAA4
We have a loop here
One quick way to identify a loop is JC instruction which means Jump if carry. another quick way is by observing the control flow redirection on the left.
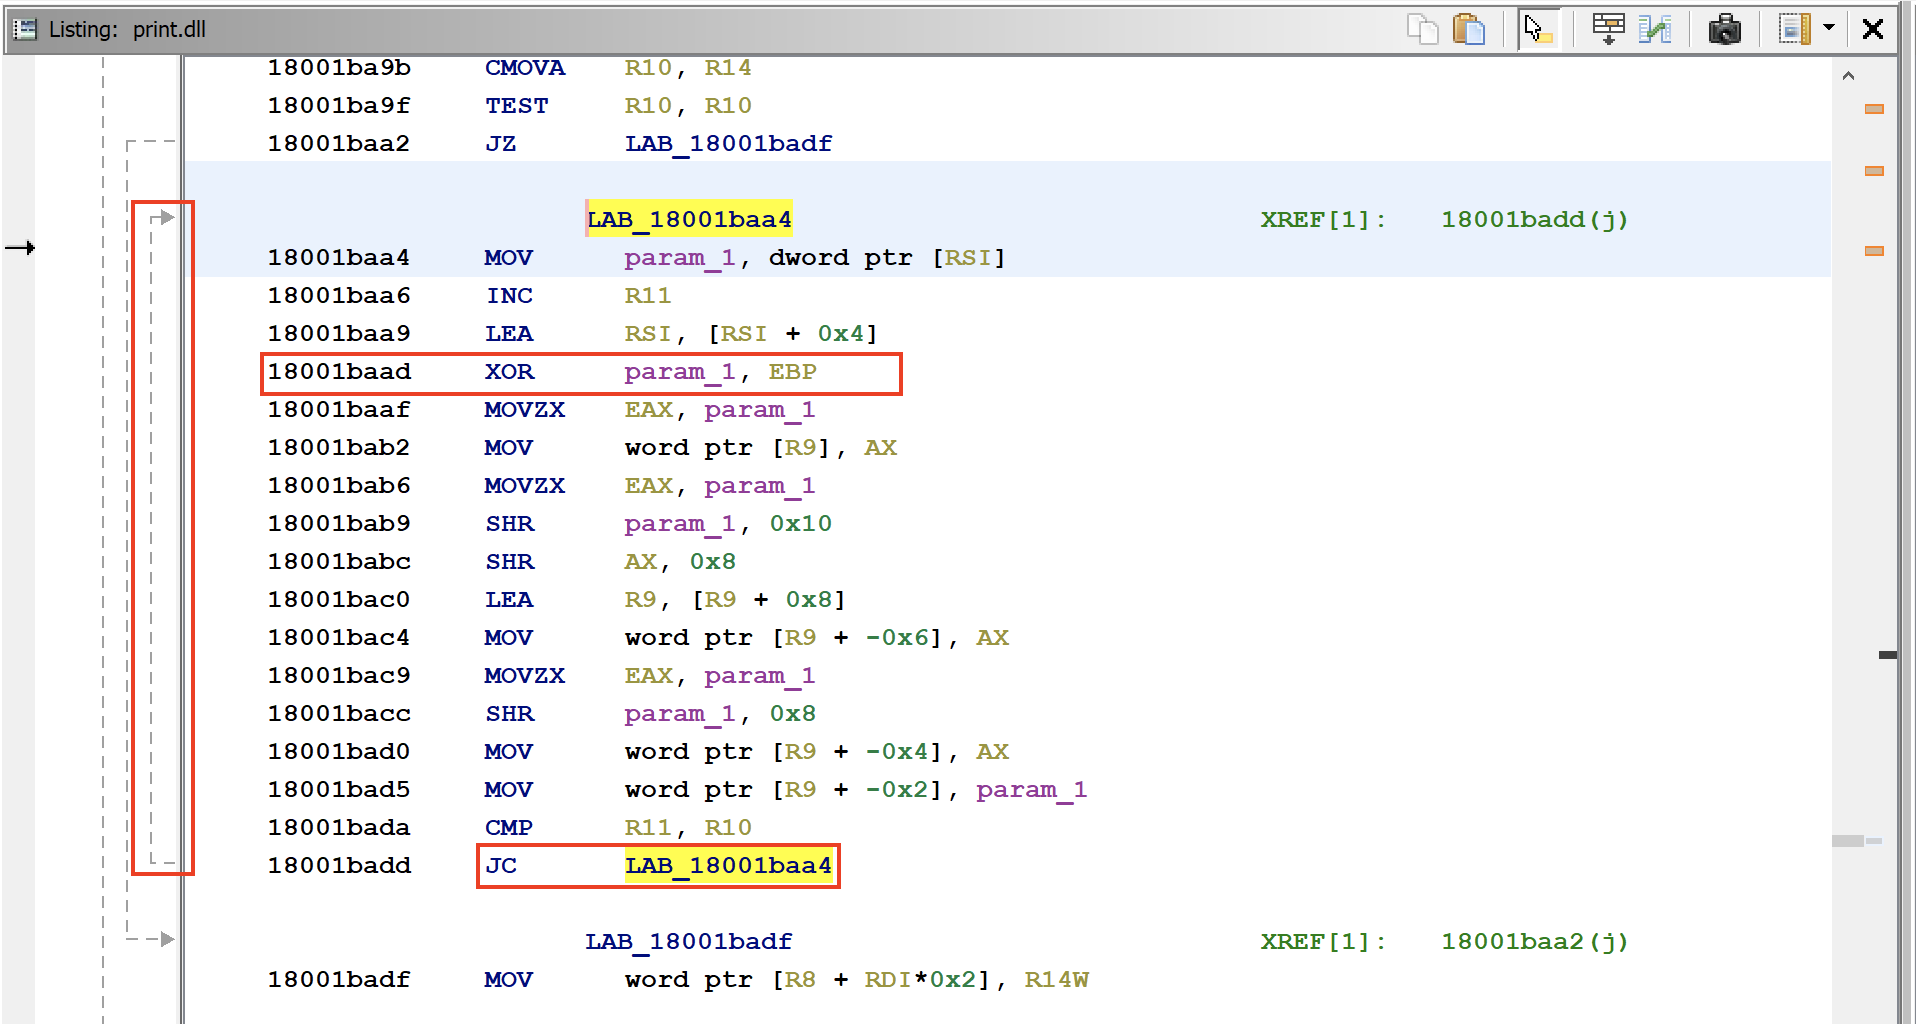
And you can see within the loop, there is a xor instruction, which is one of the reasons why the capa tool detected this part of the code.
To determine if this Loop is responsible for decoding, load it in a debugger and set a breakpoint on the return instruction at the end of the function (18001bafb RET). If this function decodes something of interest, the Rax register will likely be populated with the address of the deobfuscated content.
The evaluation of a dll differs from that of an executable. We can use run dl32, but there is a feature about this DLL that signals we could use a slightly different technique to debugging it. I go ahead and open this file in cff Explorer.
If I look at the export directory here in order to identify any exported functions, I'll see that there is one single exported function, and it is called DLLregisterServer. This export indicates that the DLL is intended to be run with the built-in windows program named regsvr32.exe
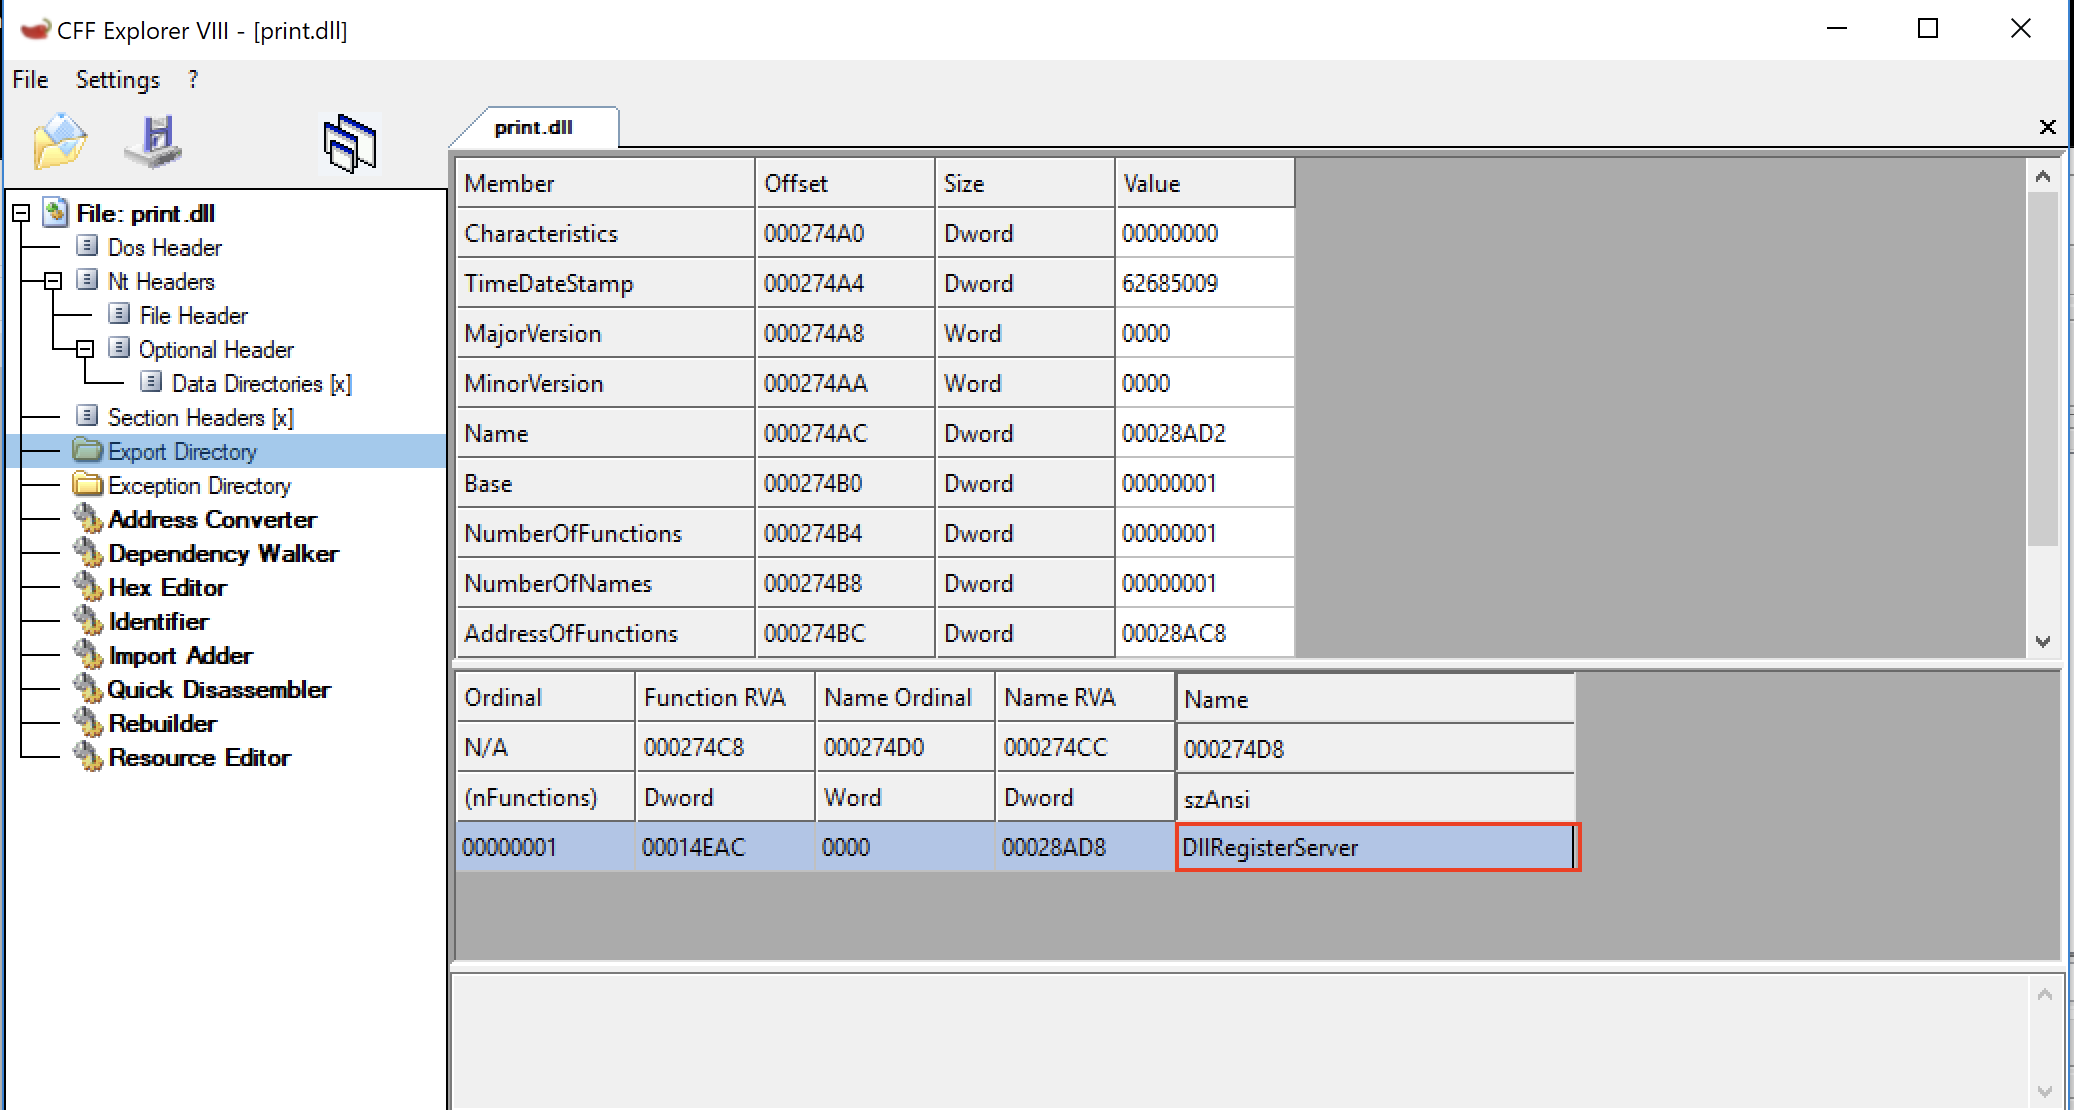
Export Dir in CFF Explorer
X64 DBG Analysis
So in order to debug this, I will first start x64 debug from my desktop, go to the file menu, click open, and locate the regsvr32.exe which is in C:\Windows\System32 the legitimate built-in Windows executable.
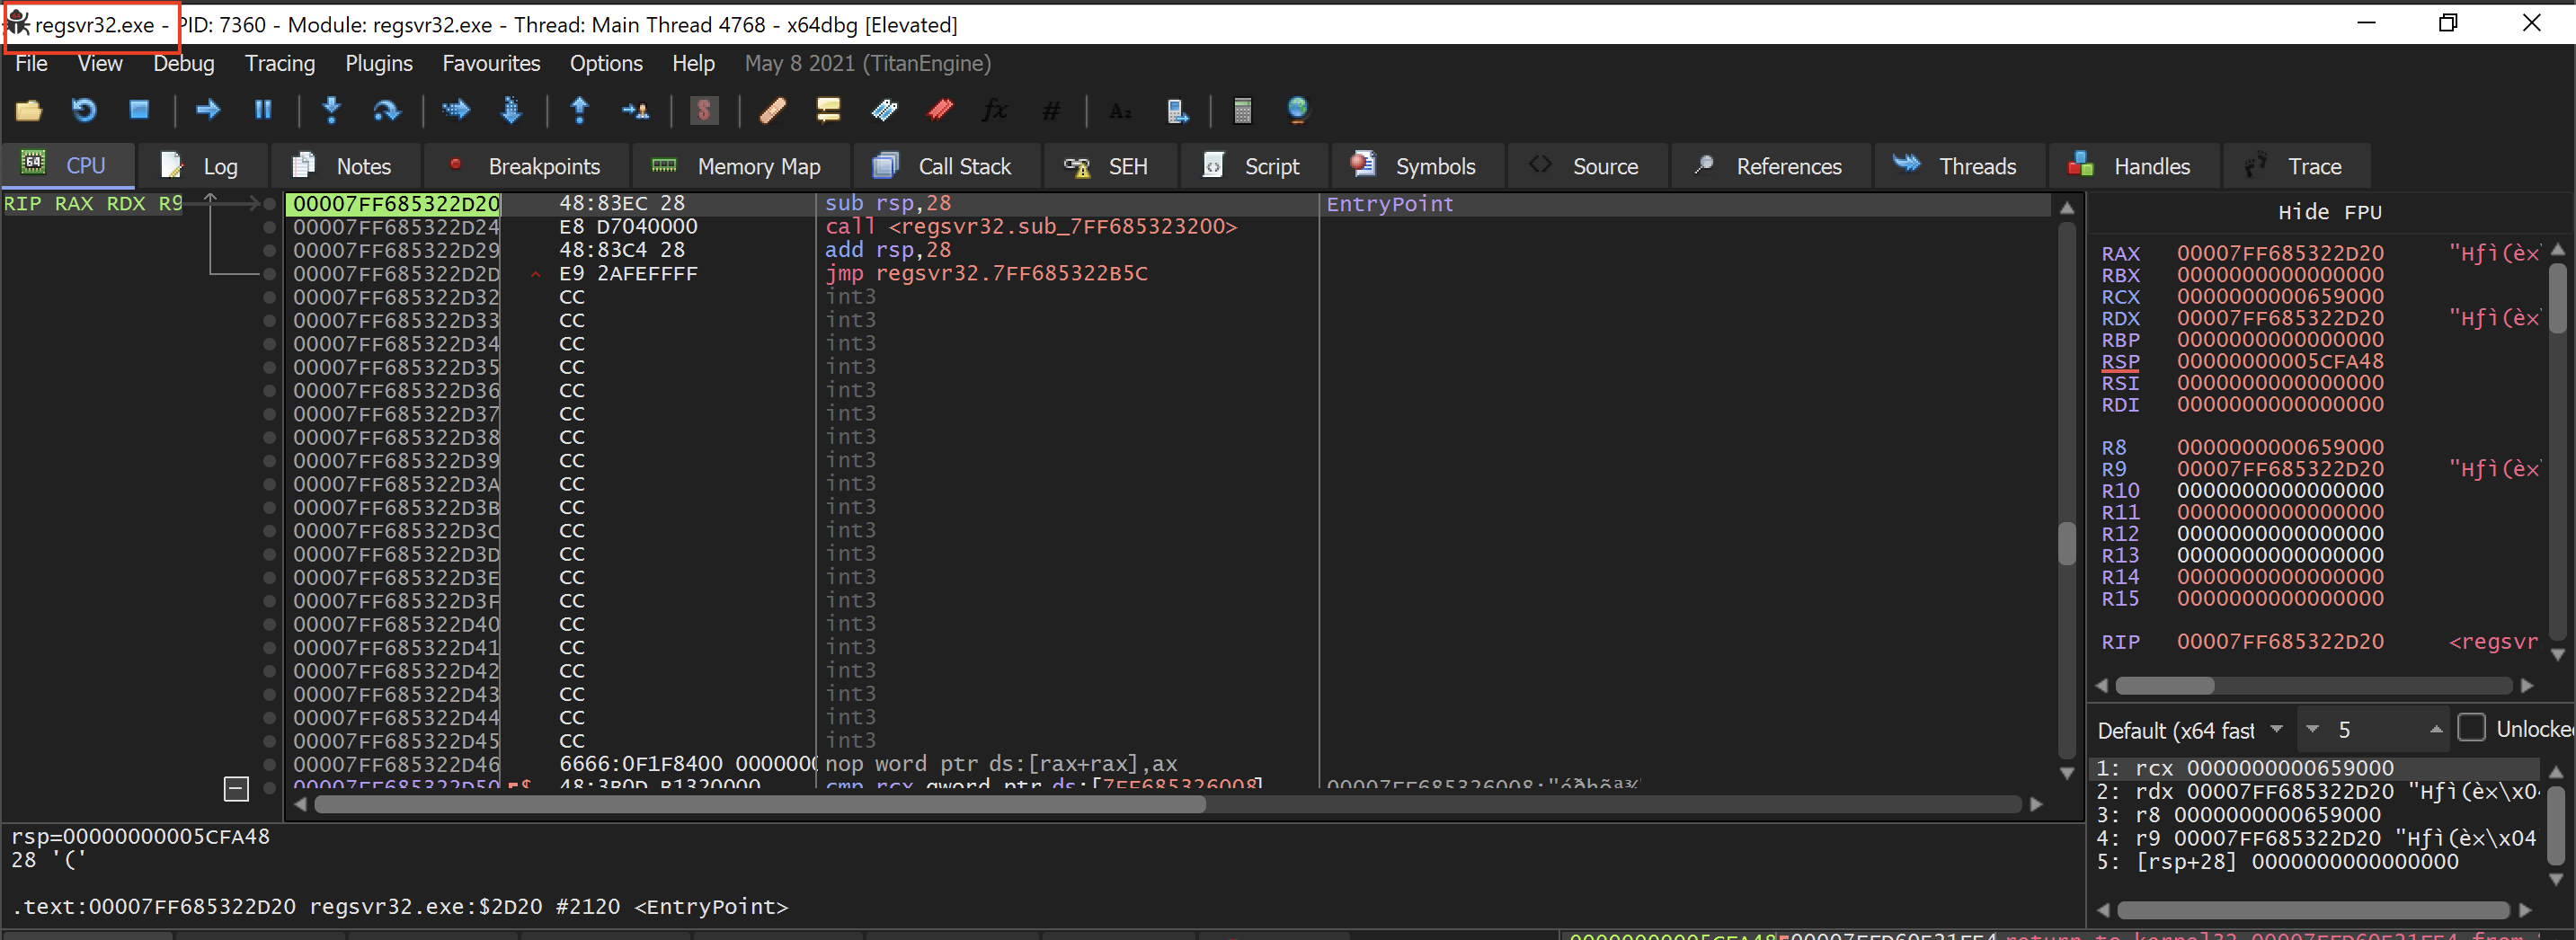
opened regsvr32.exe in x64dbg.
Then I'll go to File > Change Command Line and simply add the path to the dll print.dll just after regsvr32.exe. and you don't need to supply an entry point here in the command line. When you run this dll using regsvr32.exe, it will automatically execute the dll register server export.
Command line:
"C:\Windows\System32\regsvr32.exe" C:\Users\REM\Desktop\samp\print.dll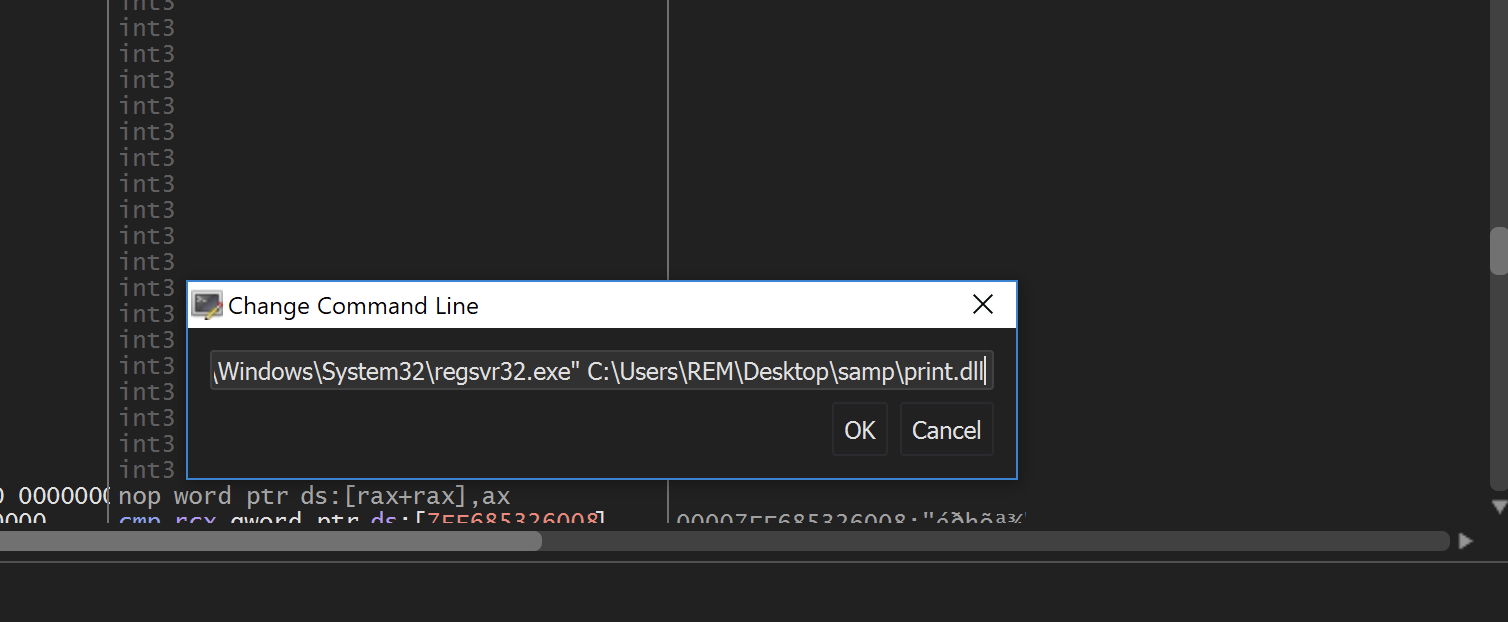
Command line adding path of the print.dll
One more tweak I need to make to the selections. I'll go to options preferences, and in this view right here under events, I'll want to check user dll entry. This ensures that when the dll is loaded by x64 debug, it will pause at the entry point, giving me the opportunity to specify potentially additional break points.
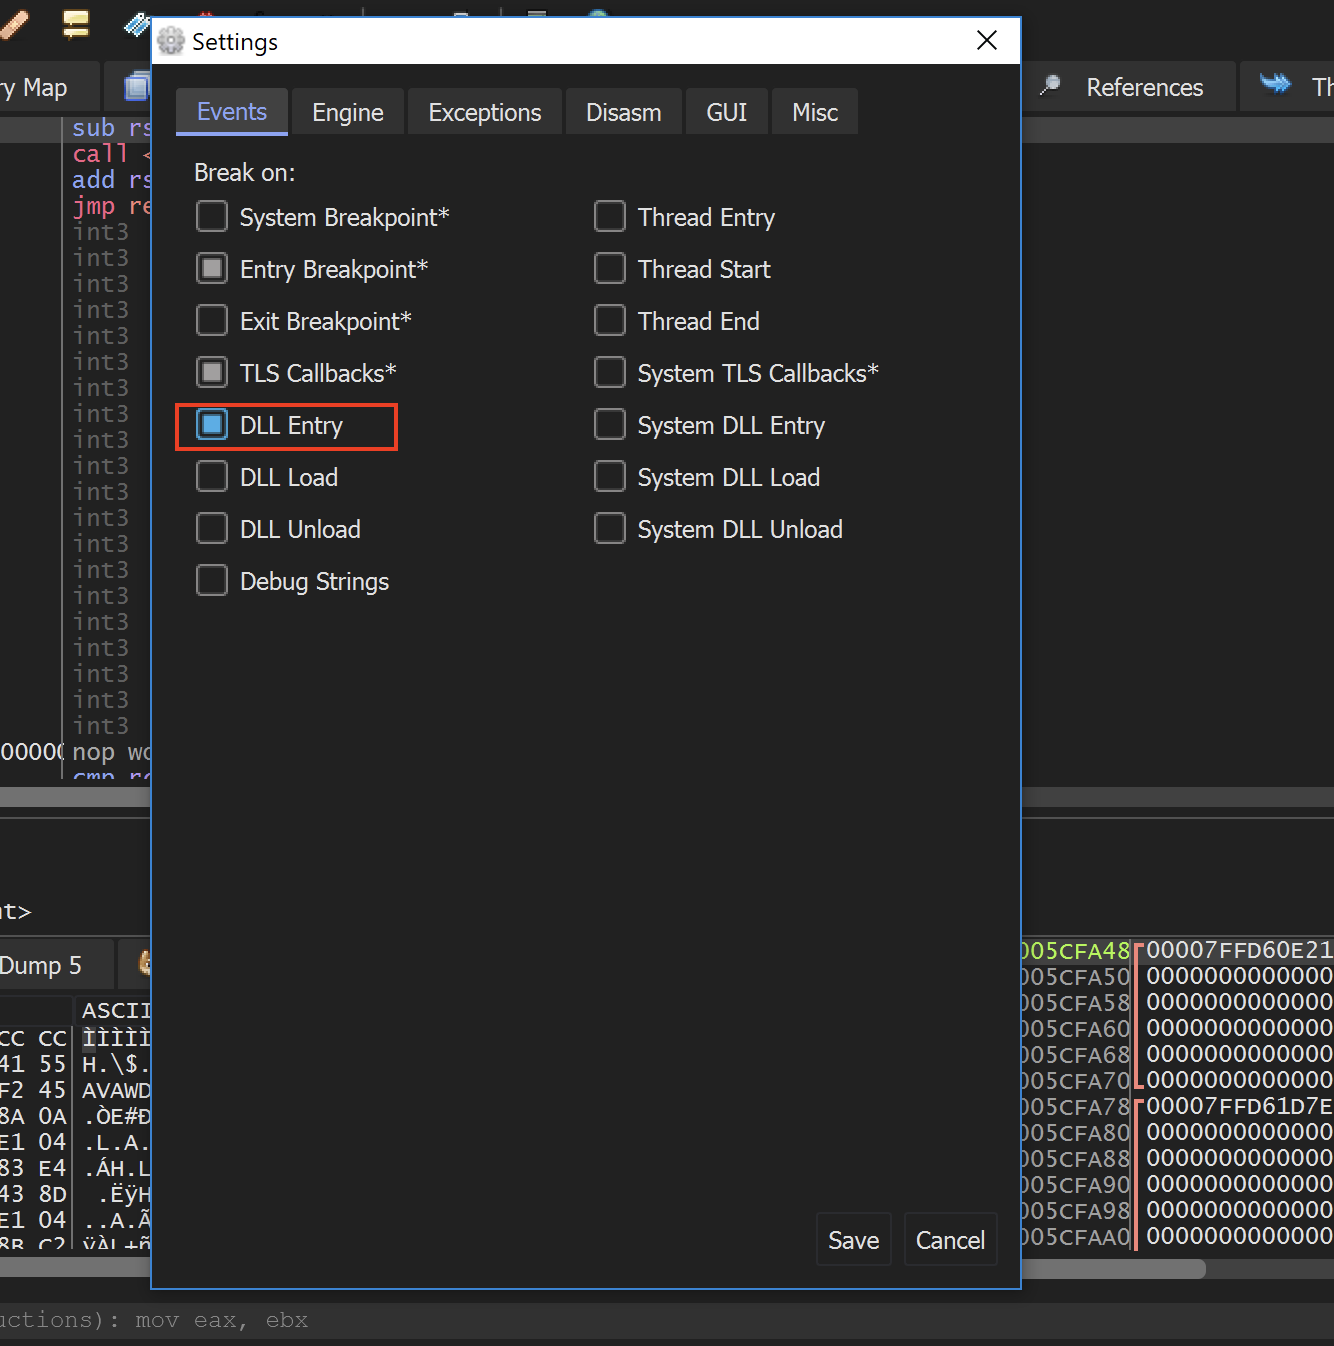
Check DLL Entry
Time to execute the program.
I normally conduct a debug restart to confirm that my change in the command line has been acknowledged by x64 debug, and once that's done, I'll go ahead and hit run again.
You can observe that we are currently halted at the entry point of print.dll.
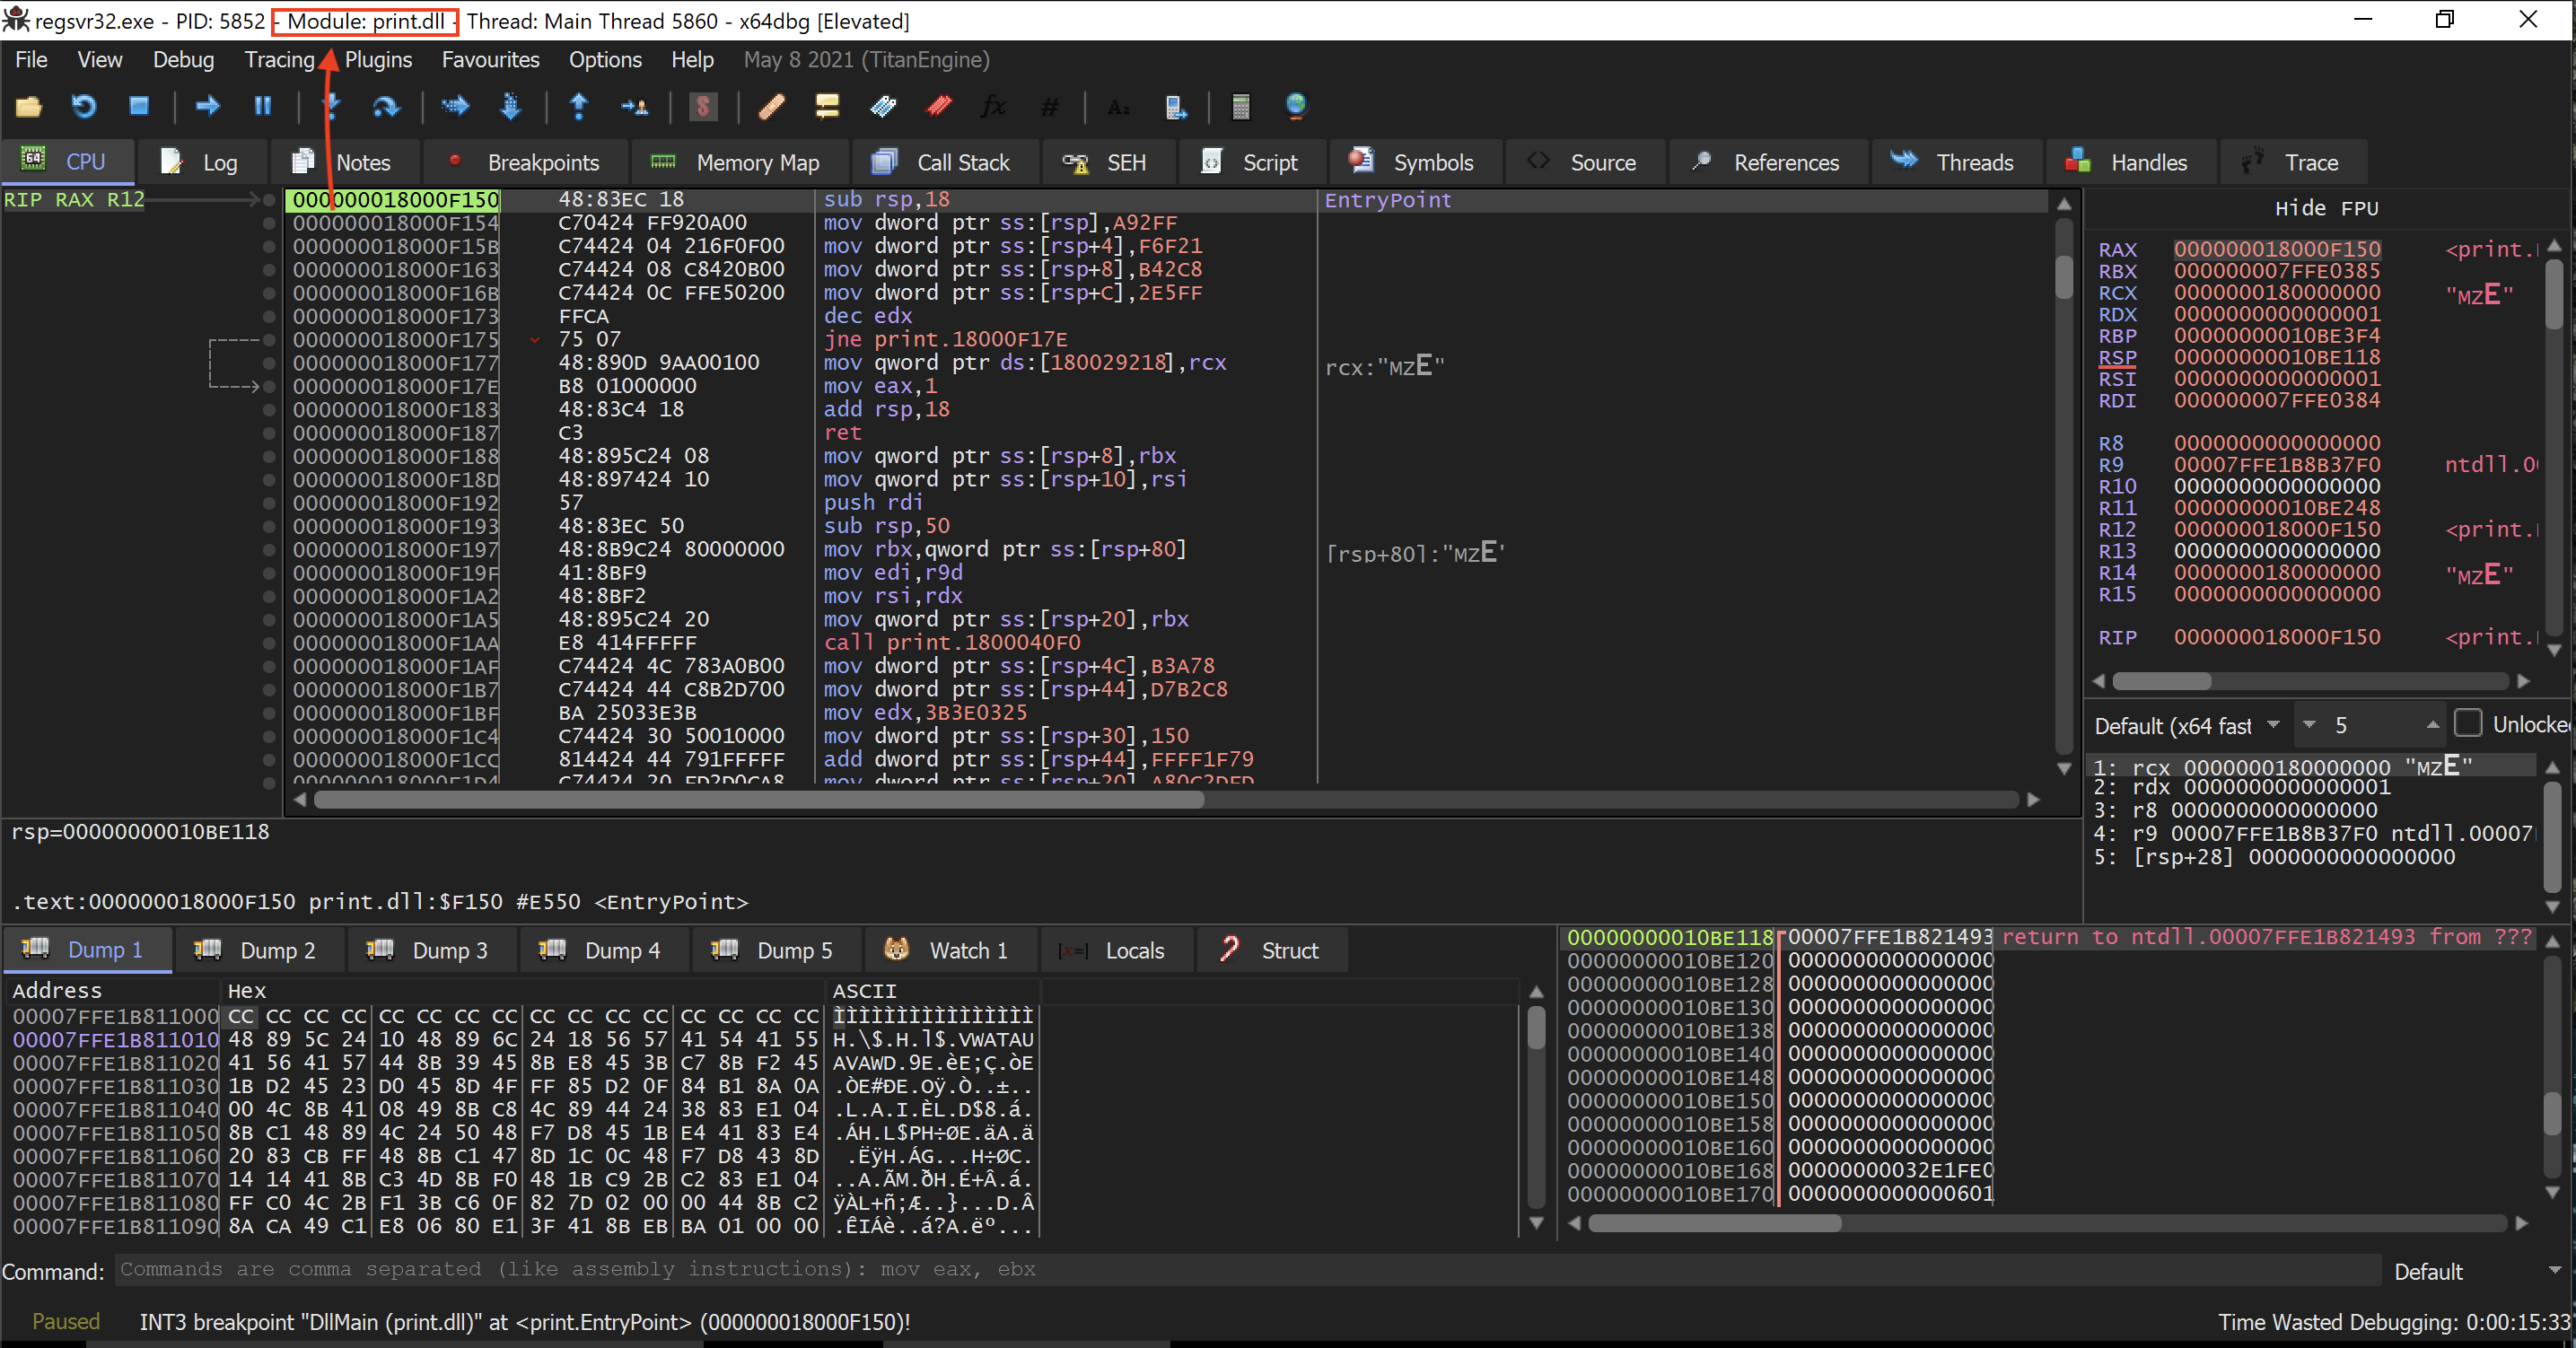
Entry point of print.dll
Now, I'll return to Ghidra and obtain the address of the return instruction.
I have the return instruction here, which was at the end of the function where the loop containing the xor instruction is located.
18001bafb RET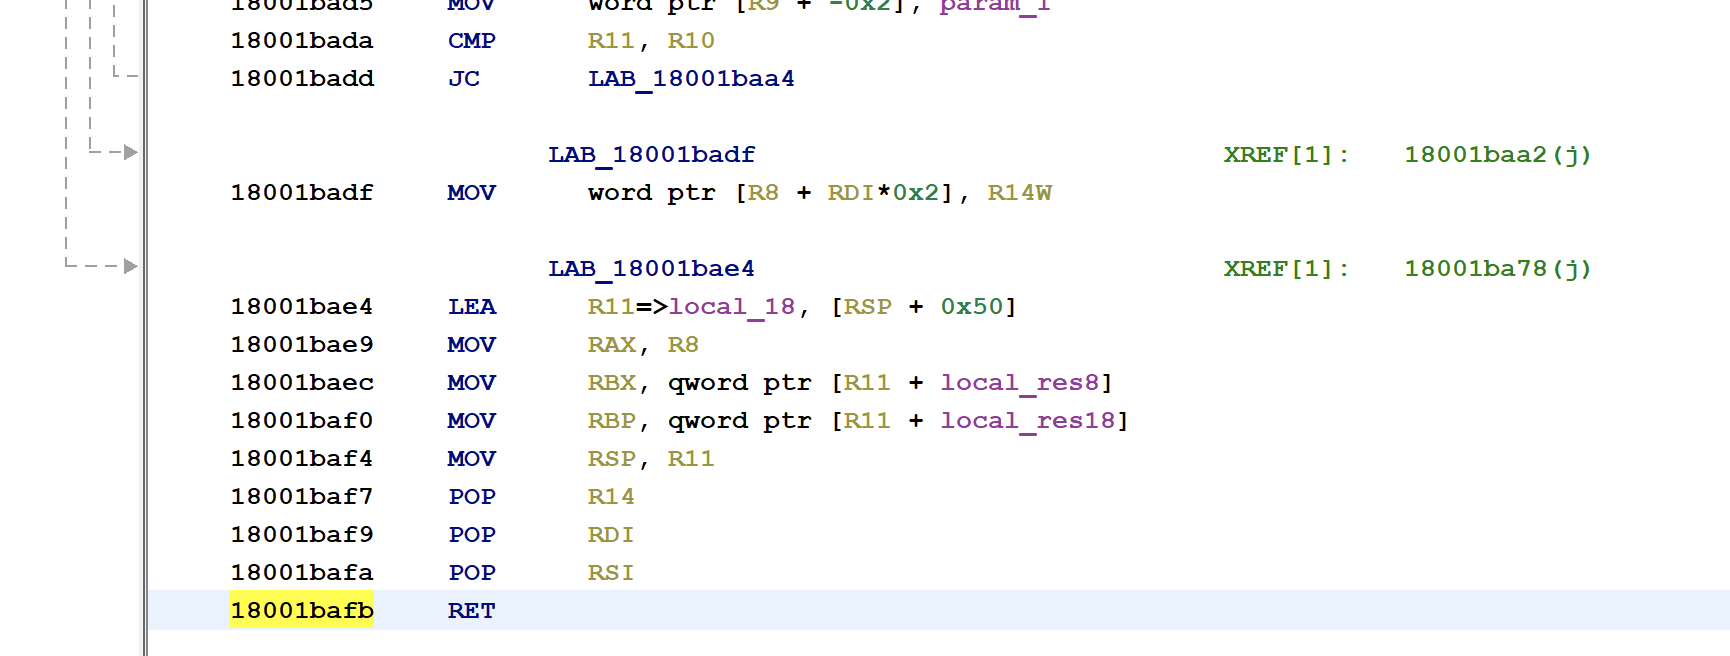
Return address
next, use ctrl G in x64 debug to input that address and navigate to that spot, and I will set a breakpoint on this instruction by pressing F2.

Breakpoint at 18001bafb
I will execute the program upon reaching the breakpoint since I have observed the RAX value the comments indicate that it refers to a string, specifically advapi32.dll.
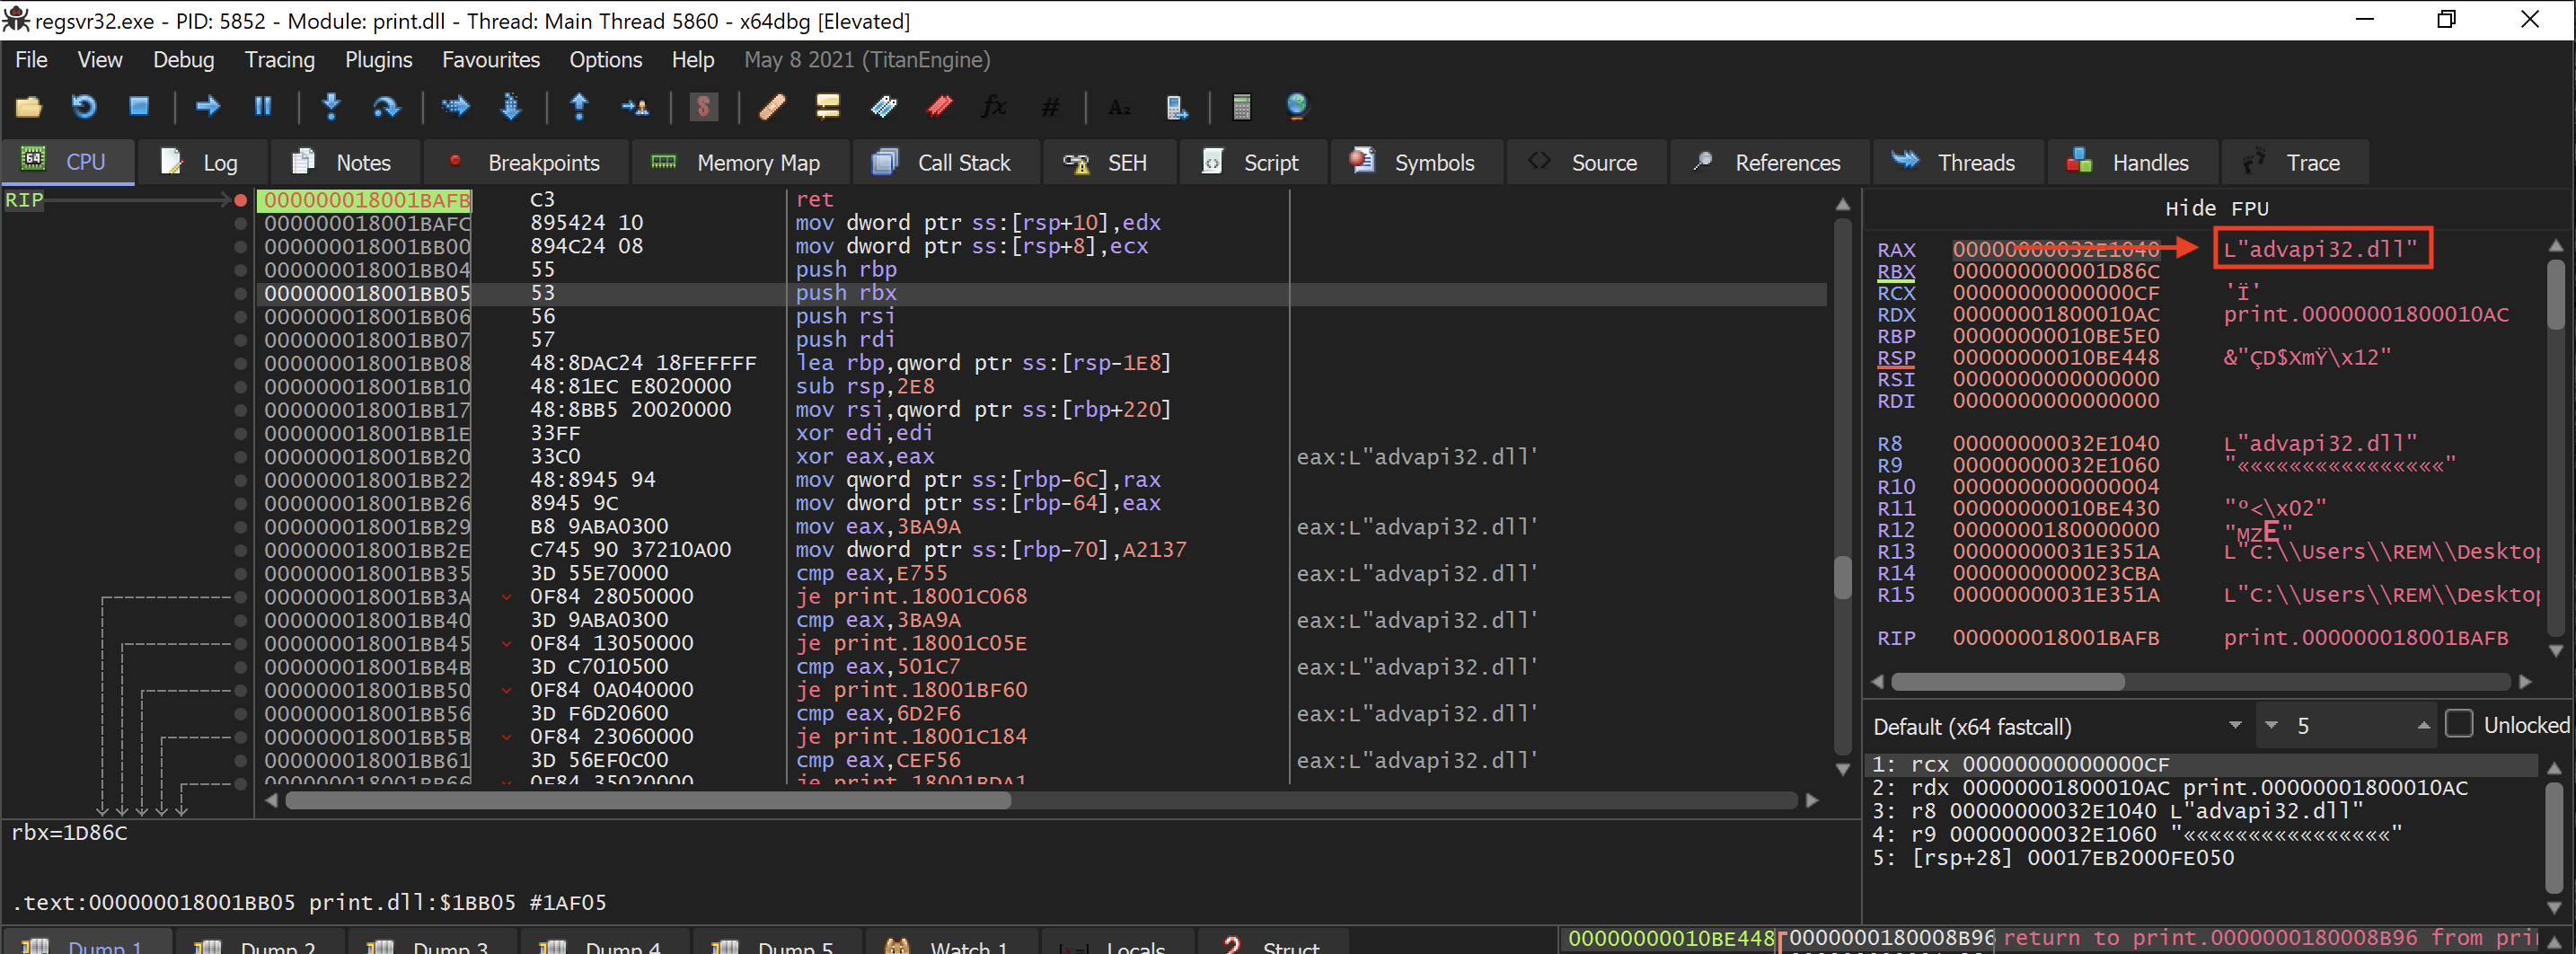
RAX refers to a string advapi32.dll
And if I keep running it a few more times, which I will do now by pressing the Run button again, you'll notice that each time I hit this break point I see a different string indeed.
Second hit it’s bcrypt.dll
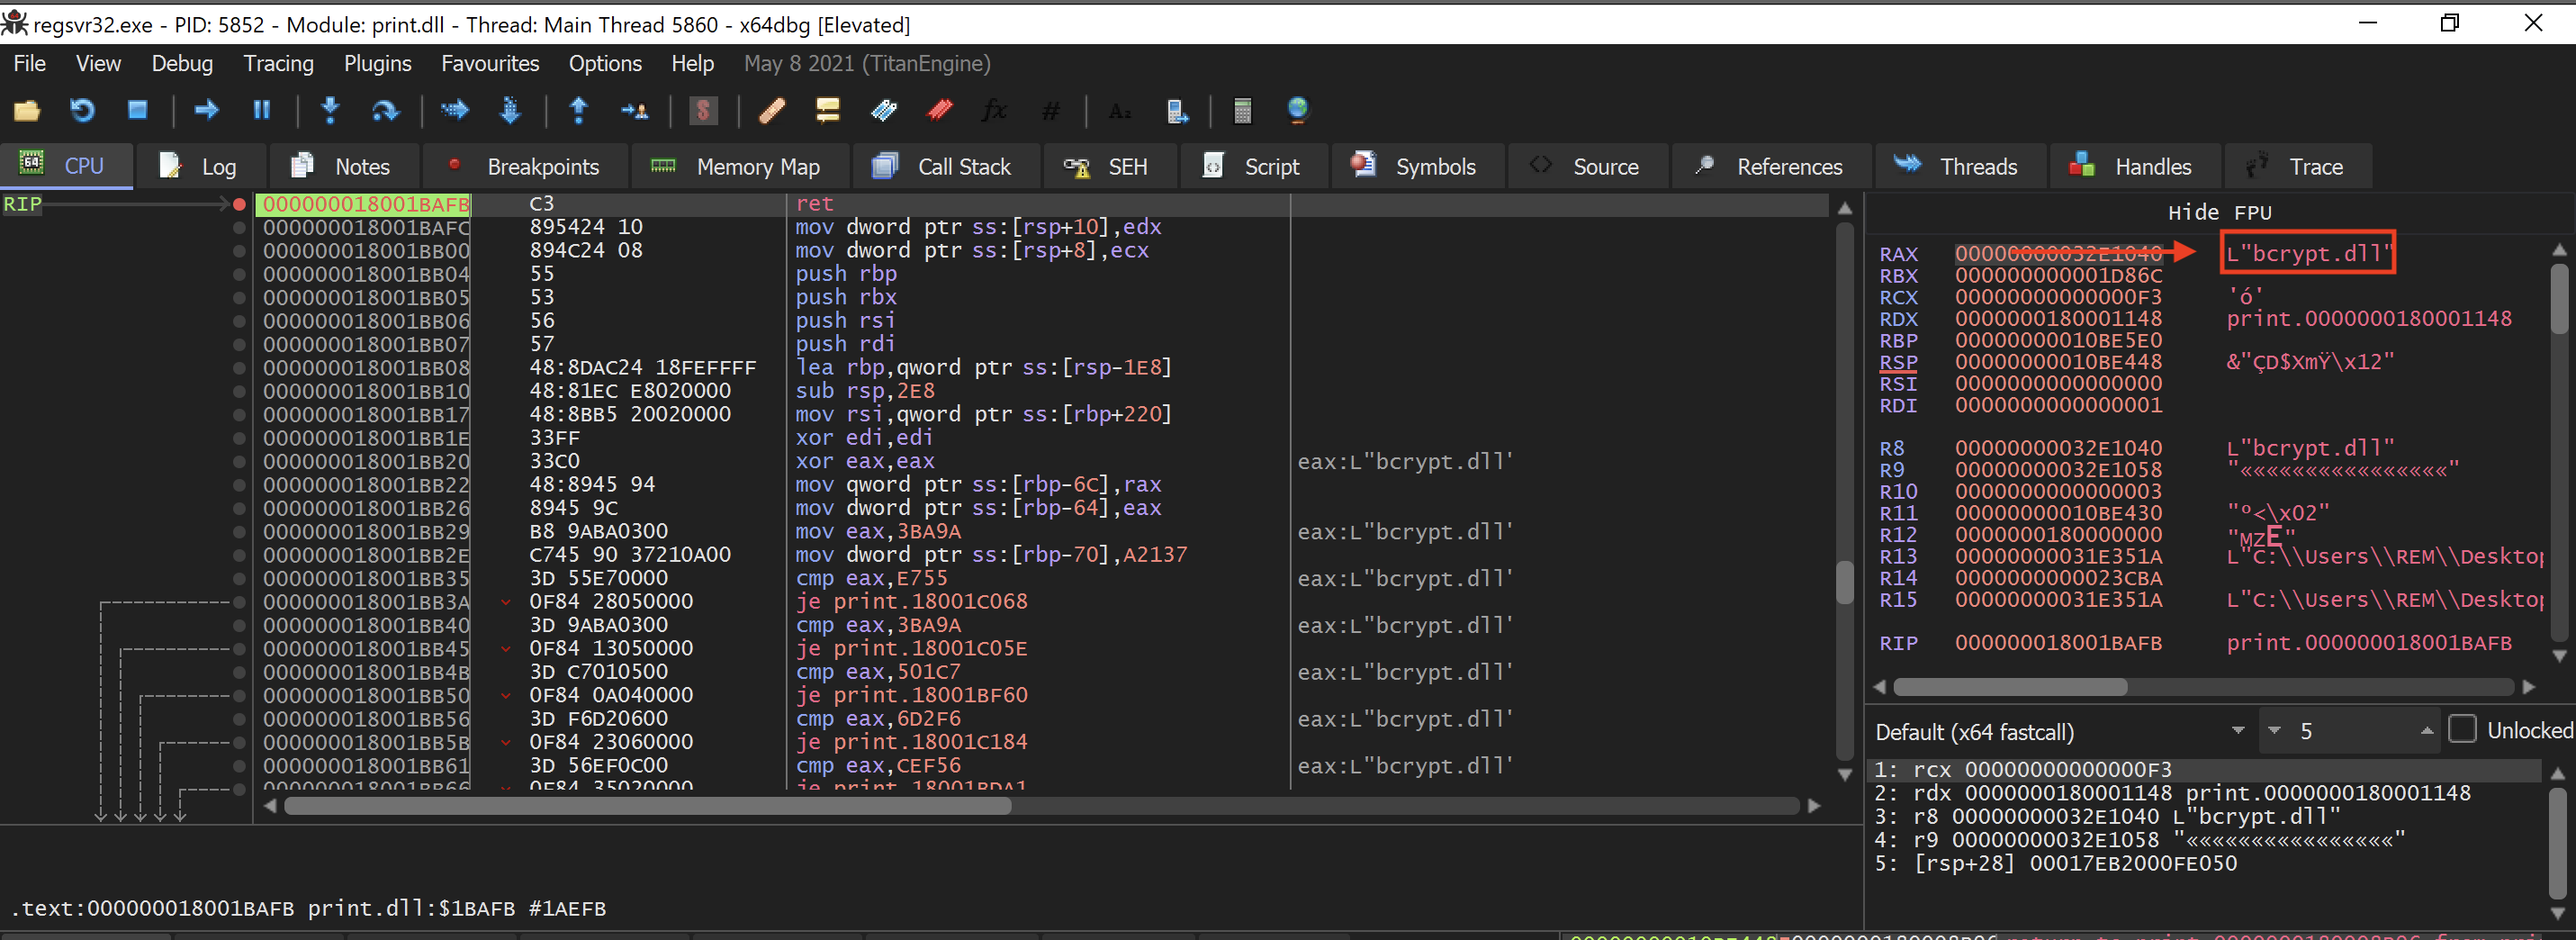
second hit breakpoint of 18001bafb
Third hit it’s crypt32.dll
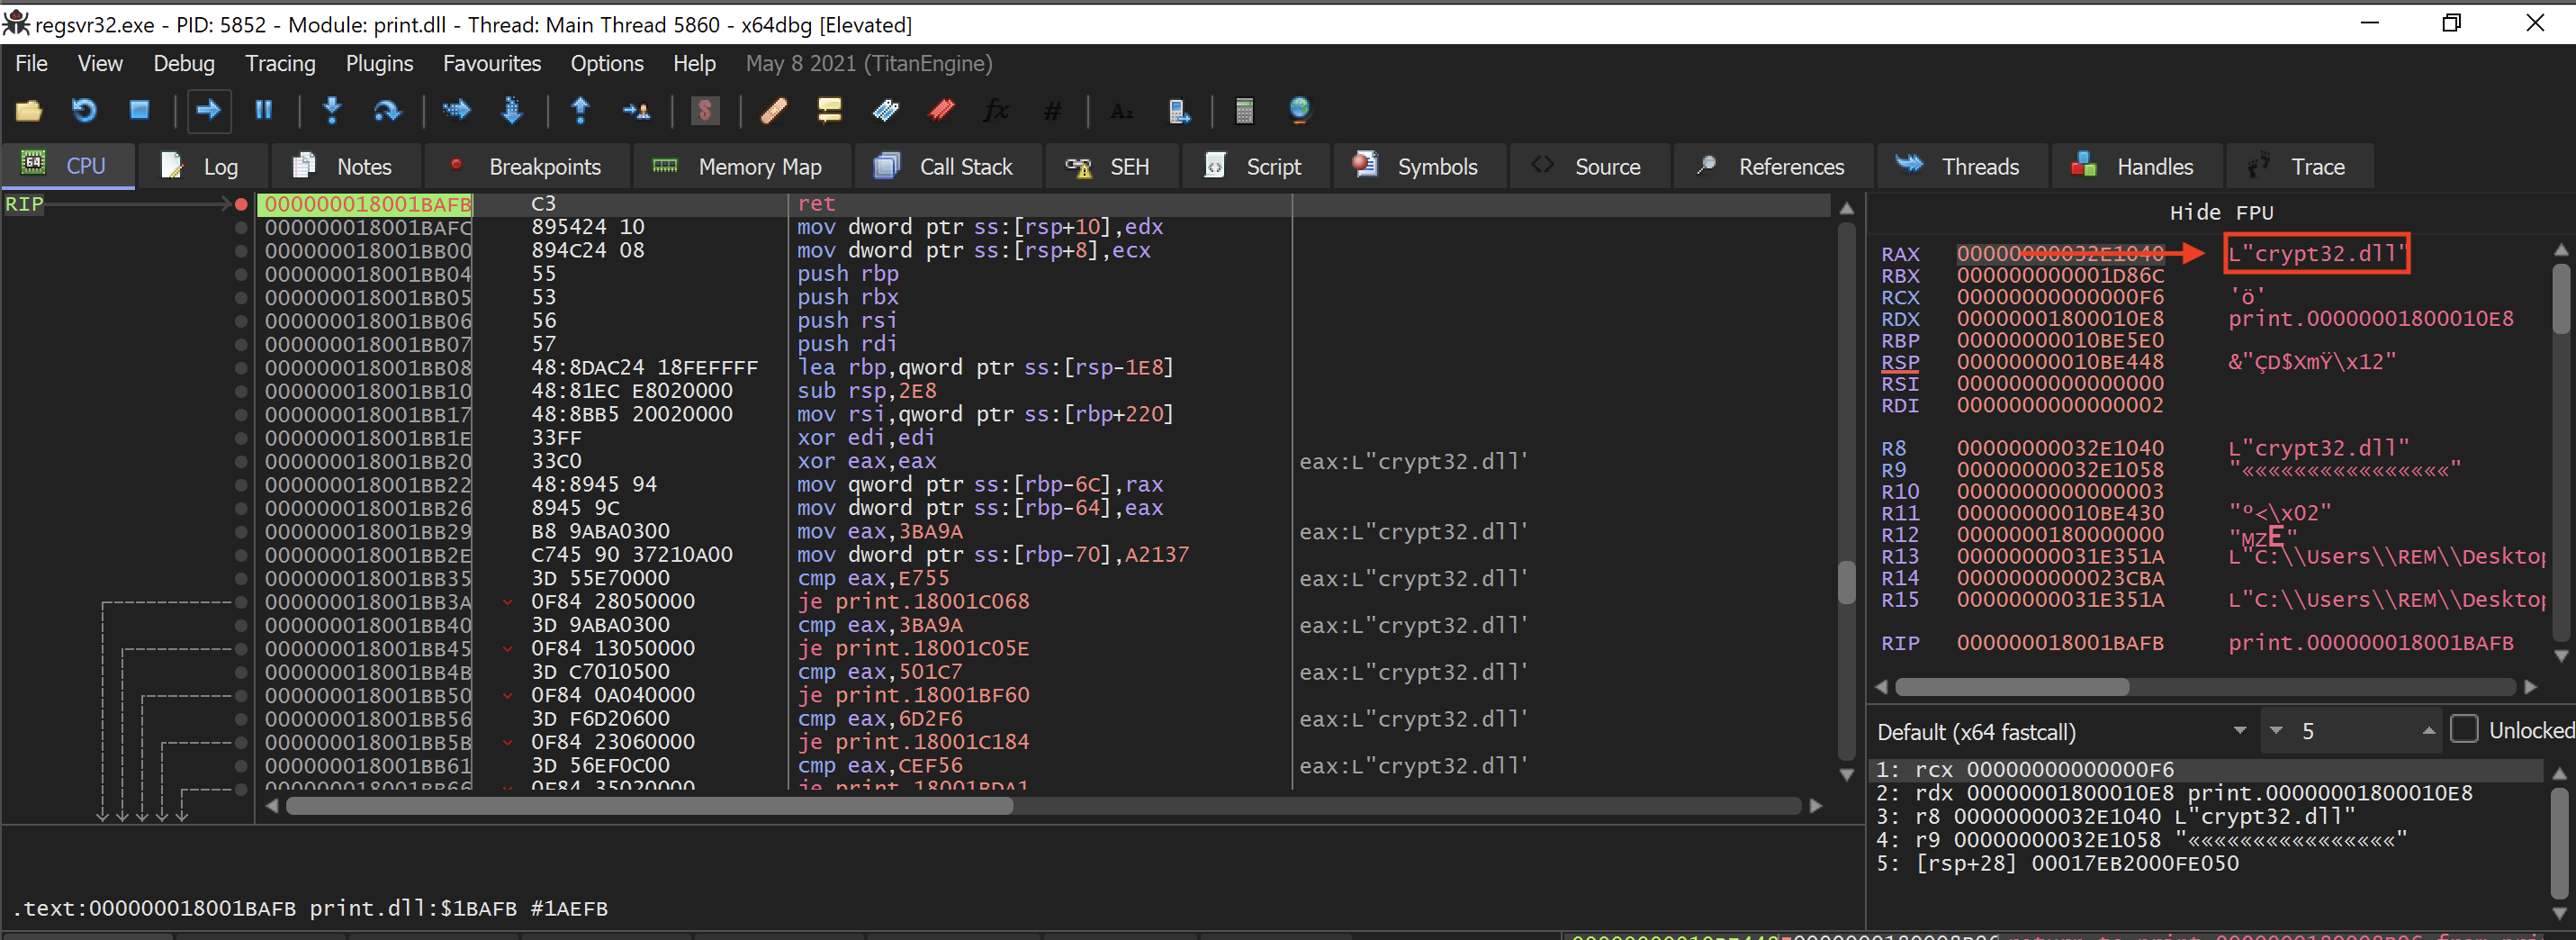
Third hit breakpoint of 18001bafb
If we place one of these values from RAX into the dump window by right-clicking and selecting follow and dump, we can see the string right there again.
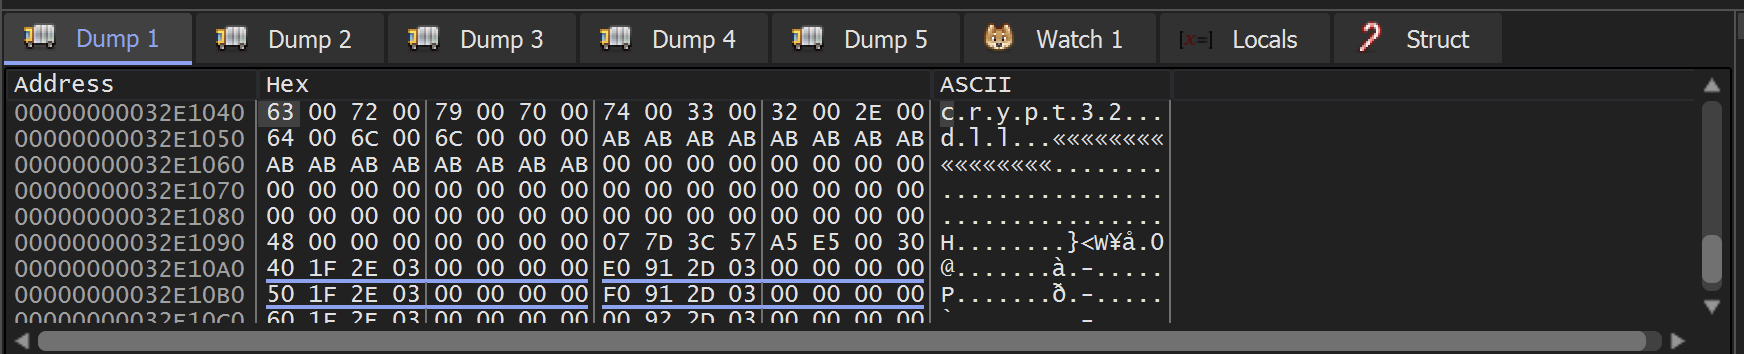
Following RAX in dump.
We can observe that this is a utf16 string.
Although it’s wonderful that we’re now seeing several deobfuscated strings, the process of continuously running and reviewing Rax becomes somewhat monotonous. Ideally, we would like to output the strings in a format that is easy to copy and paste into our notes. One way to tackle these issues is by utilizing conditional breakpoints. A conditional breakpoint in x64 debug is a breakpoint that interrupts program execution when a particular condition is satisfied.
Instead of halting execution every time at a specific instruction, a conditional breakpoint checks a condition we define. If that condition evaluates to true, the debugger pauses the program if false, the program continues running uninterrupted, as though no breakpoint existed. Additionally, such breakpoints can be set to log specific data or run certain commands, depending on whether the specified condition is met.
Let's go over how to set up a straightforward conditional breakpoint to capture all the strings that this function we've been examining deobfuscates. To do this, I'll configure the breakpoint on the return instruction by following these steps.
I will right-click on this instruction, select breakpoint, and then choose edit.
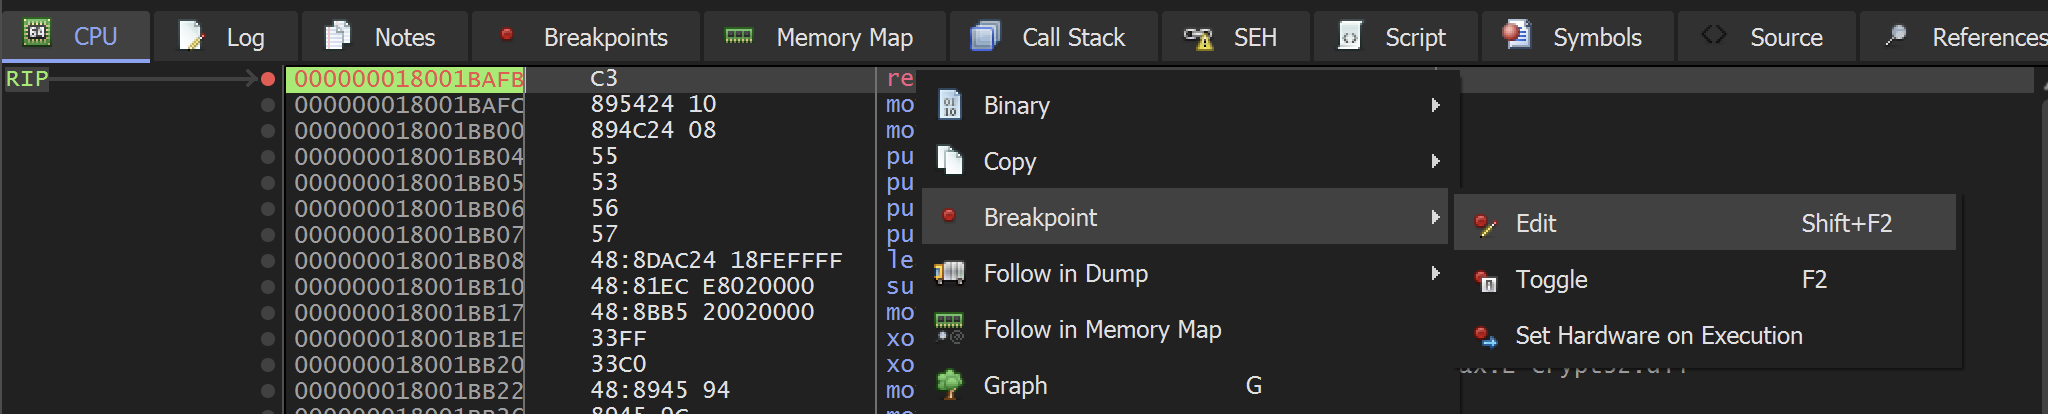
let's discuss briefly what we have in front of us here.
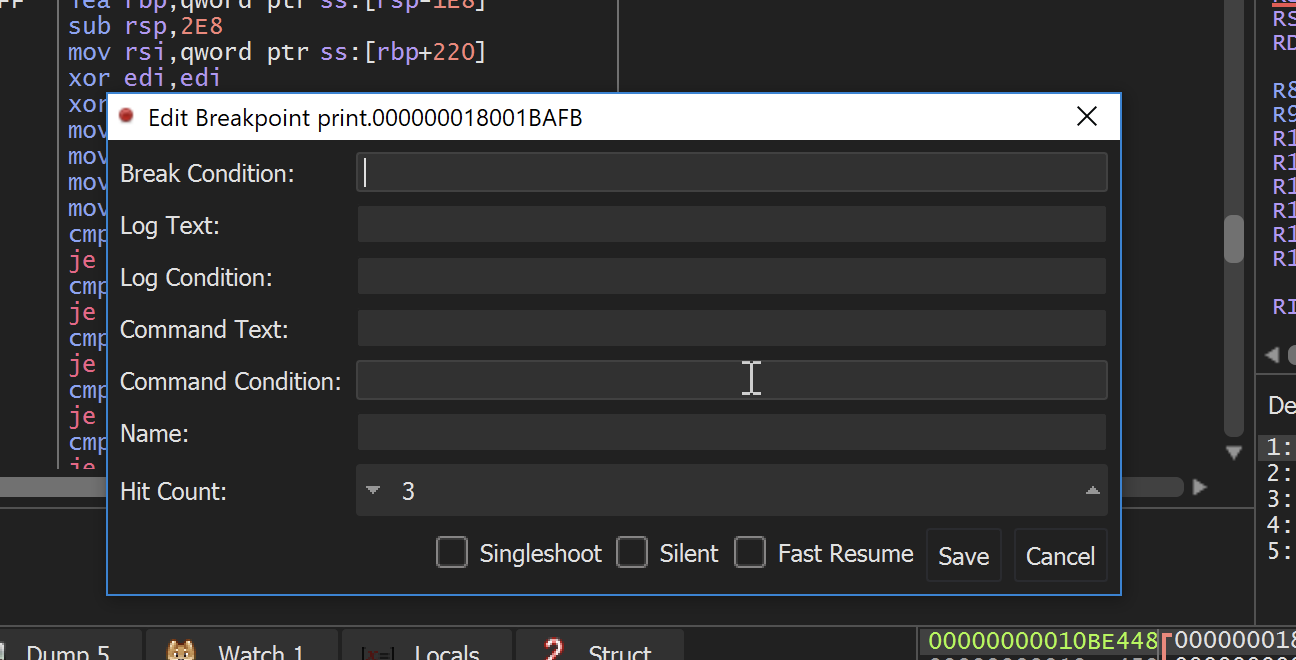
edit breakpoint
We have three conditions to consider. The first is the break condition, which is assessed to decide whether execution should halt or proceed. This condition might, for instance, check the value of a specific memory address or register. By default, it is set to one (true), meaning execution will stop. The second is the log condition, which determines whether a message should be recorded. It also defaults to one (true), indicating that logging will occur. The actual content to be logged is defined in the log text field, and the documentation outlines the formatting rules for this text.
The logged text will appear in the log tab, though it can also be saved to a separate file on disk. The final condition is the command condition, which determines whether a given command should run. By default, this is set to one (or true), meaning that any specified command will execute and display in the command text field. Now, returning to our main objective—outputting all decoded strings referenced by Rax when we reach the return instruction, we realize the break condition isn't necessary for halting or pausing execution. Instead, we only need to record the decoded string. Reviewing the documentation confirms that using the value zero is sufficient for this purpose. I'll proceed with that right away.
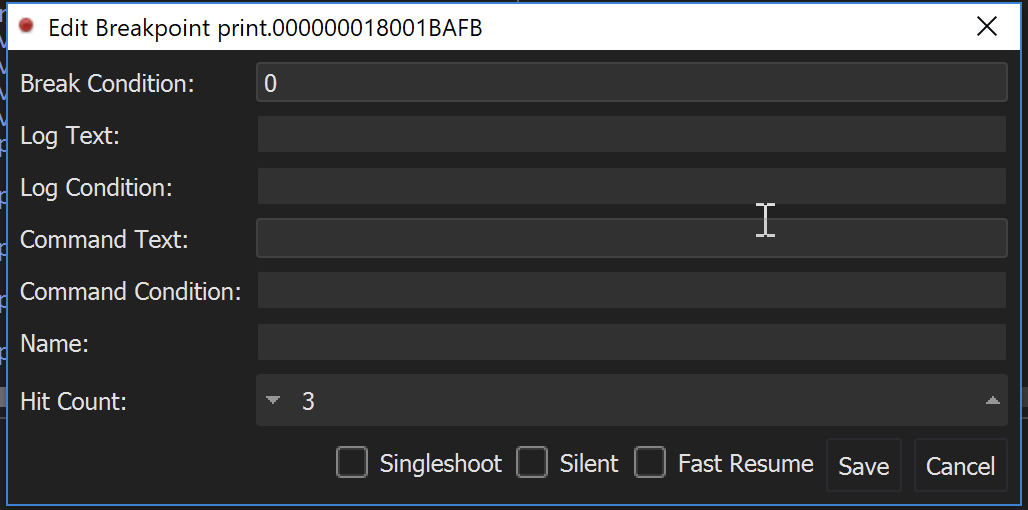
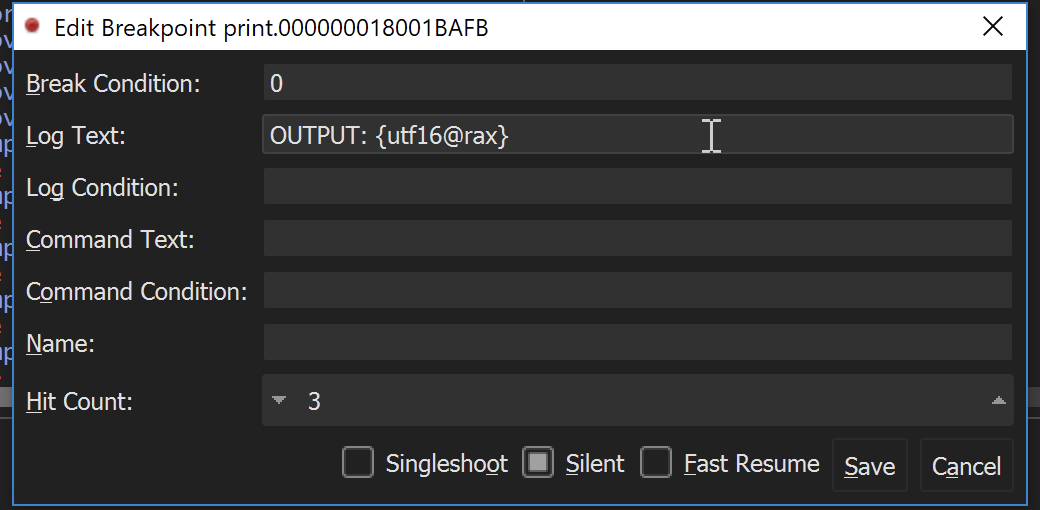
Break condition 0
Moving on to the logging settings, we want to record the decoded string each time execution reaches this return instruction. Since the logging condition defaults to "true," we don't need to enter anything there it will log automatically. Now, what should go in the log text field? We aim to capture the UTF-16 string located at the address held in the Rax register. According to the string formatting guide, any expression must be enclosed in curly braces. There's a specific format option that outputs a UTF-16 string from a given address, and while we could specify a size, it's not necessary in this case. So we can enter something like the following {utf16@ though keep in mind we don't have a fixed address, but rather a register containing the address.
We can retrieve the value of Rax directly by referencing the register. Combining this with the previous steps, we can produce the deobfuscated string by simply adding Rax.
I will add an all caps output followed by:
OUTPUT: {utf16@rax}I want to mention this because, as you’ll soon notice, the log output shown in the log tab isn’t limited to just conditional breakpoint messages it also contains various status updates from x64 debug 2, which can make things a bit cluttered. By adding this text at the start of the log, it becomes easier to locate the specific information I’m looking for. That’s really all there is to it. Of course, you could design more complex or creative conditional breakpoints, but the goal here is simply to demonstrate how straightforward the process can be. So, we’ll leave the remaining settings unchanged and click OK.
the edit breakpoint window should look like this.
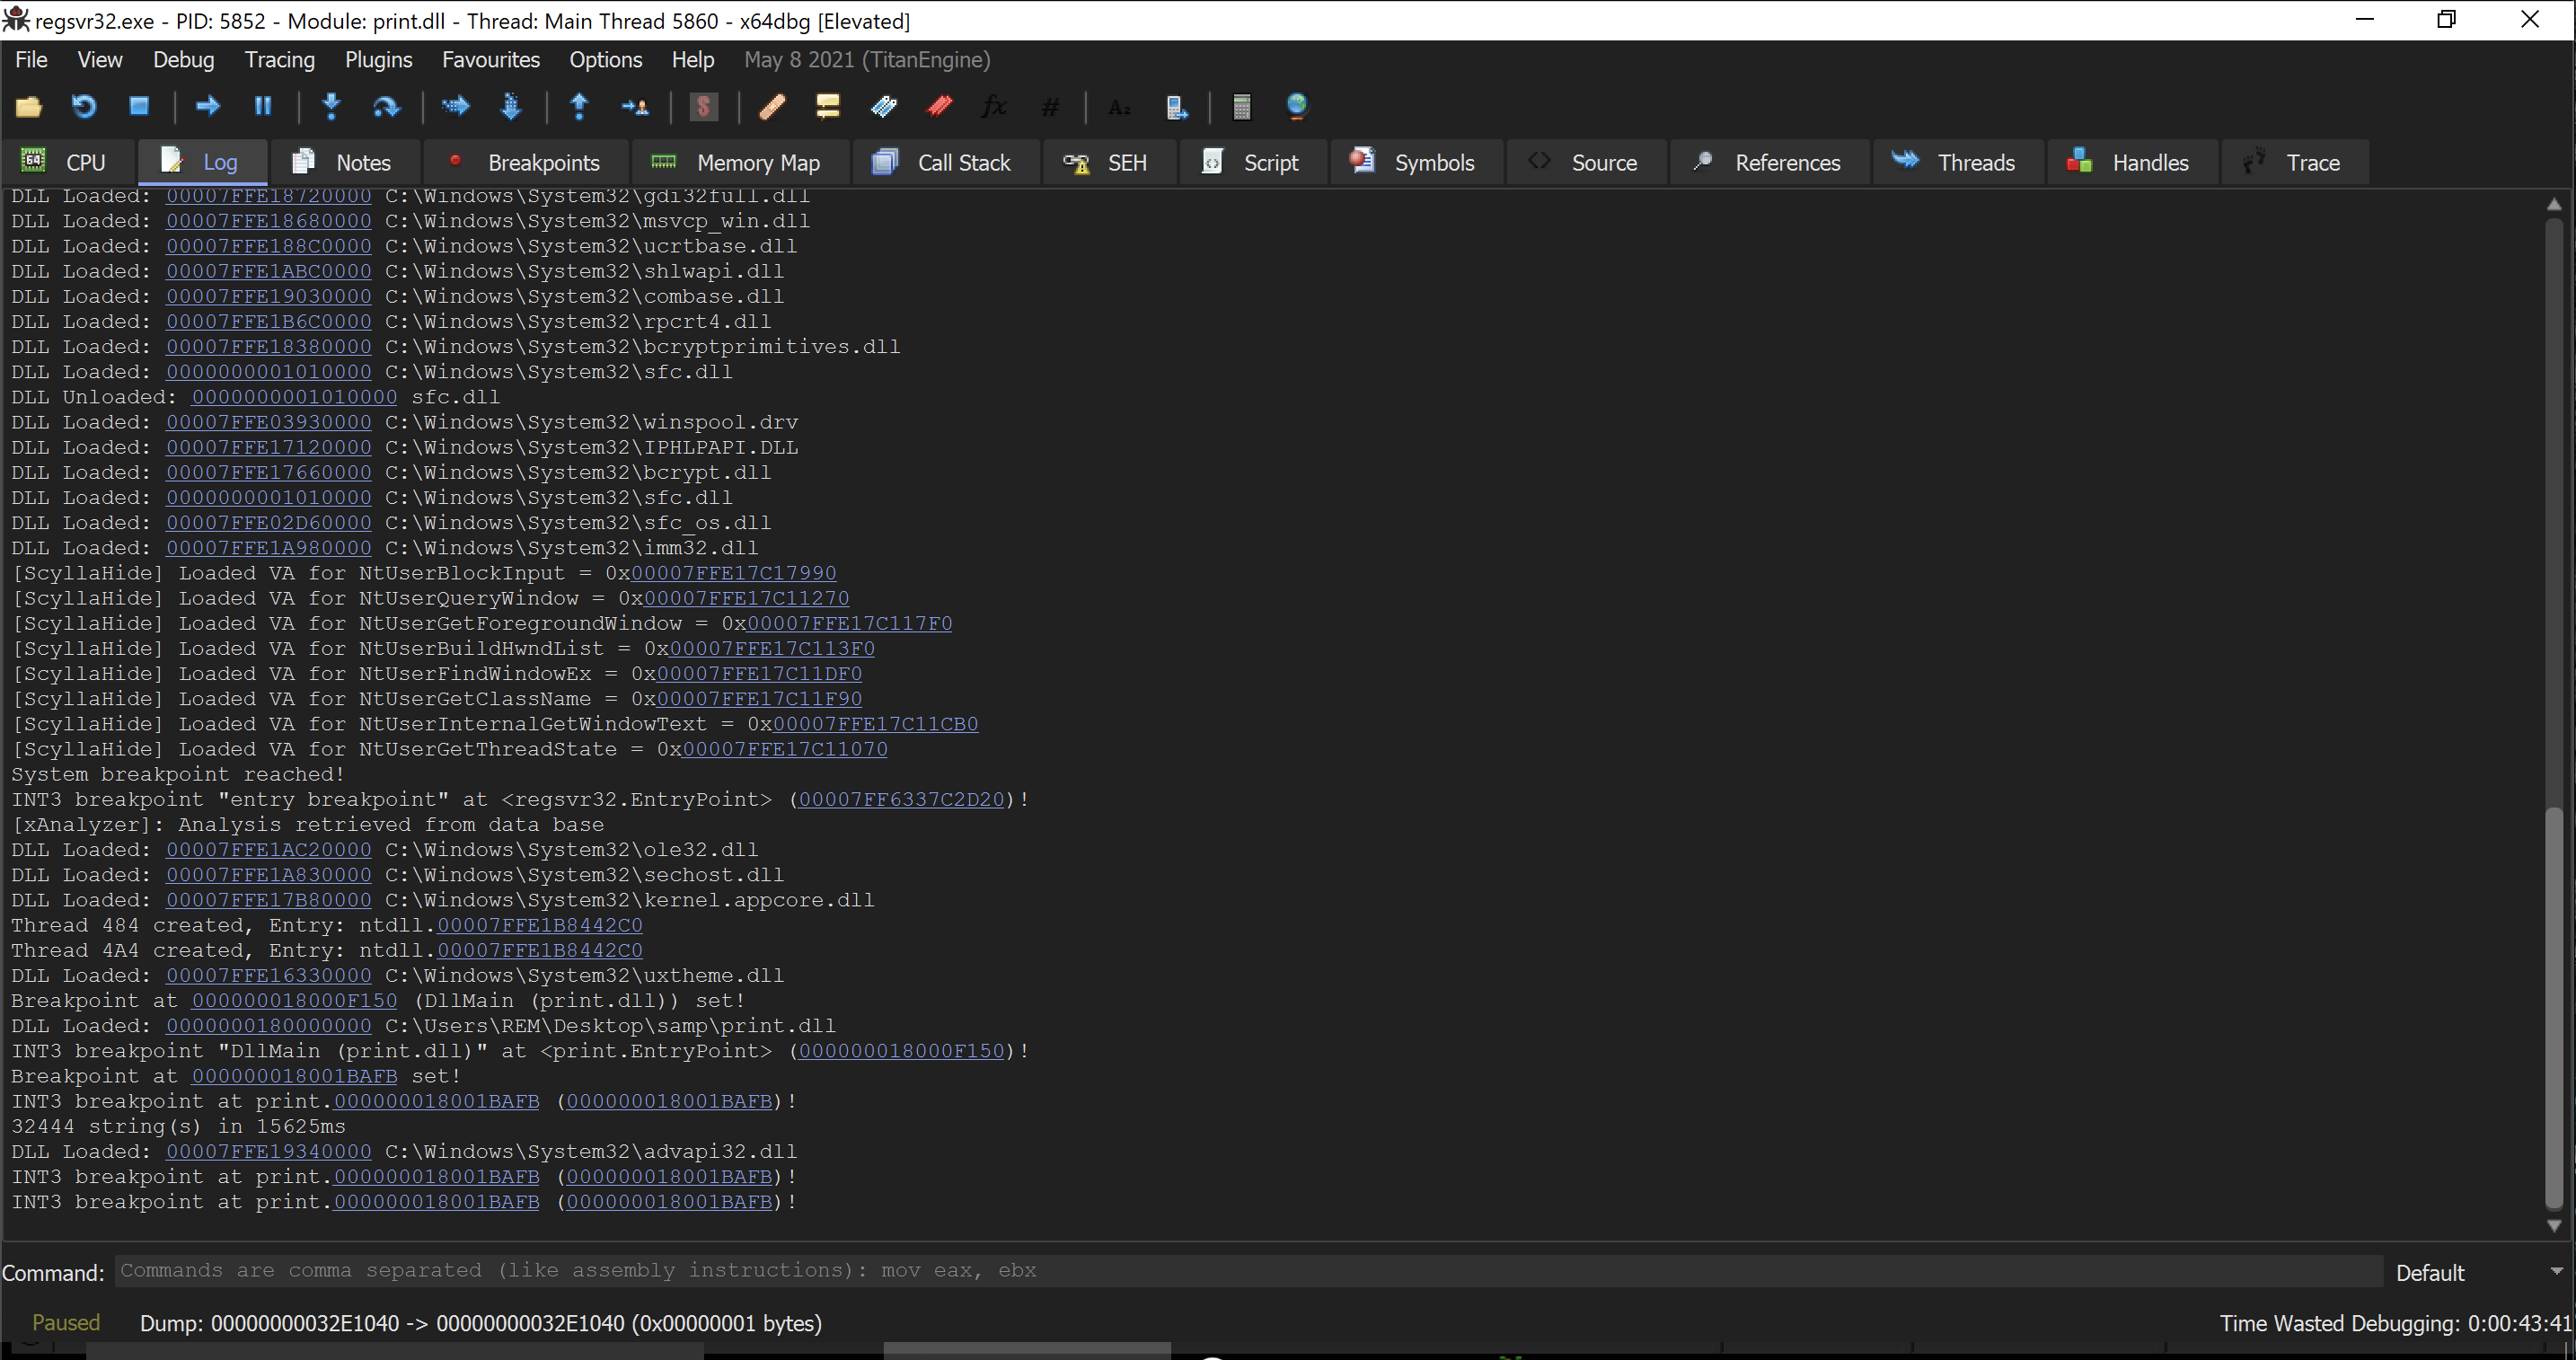
Before proceeding with running the program, I’d like to make one adjustment in the logging tab. As you can see, there’s already a fair amount of content displayed here from the default logging output.
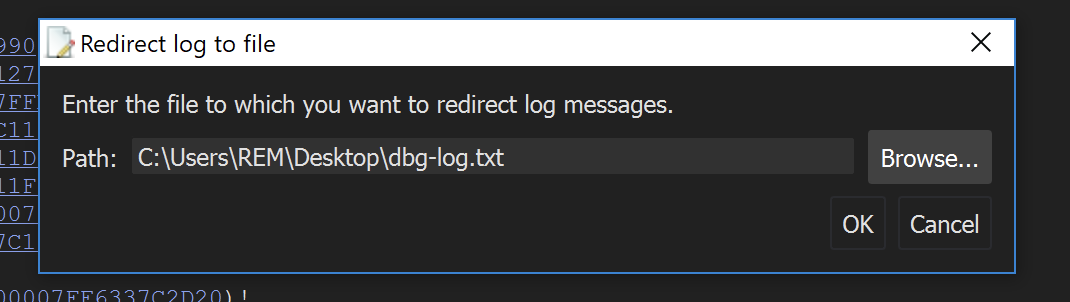
I’ll now set up the logging so that messages not only show up in this window but are also saved to a file I specify. To do this, I’ll right-click anywhere within the view, select “Redirect Log,” and save the log file to my desktop.
I’ll return to the CPU window, perform a debug restart, and then run the program. you’ll notice the DLL’s entry point.
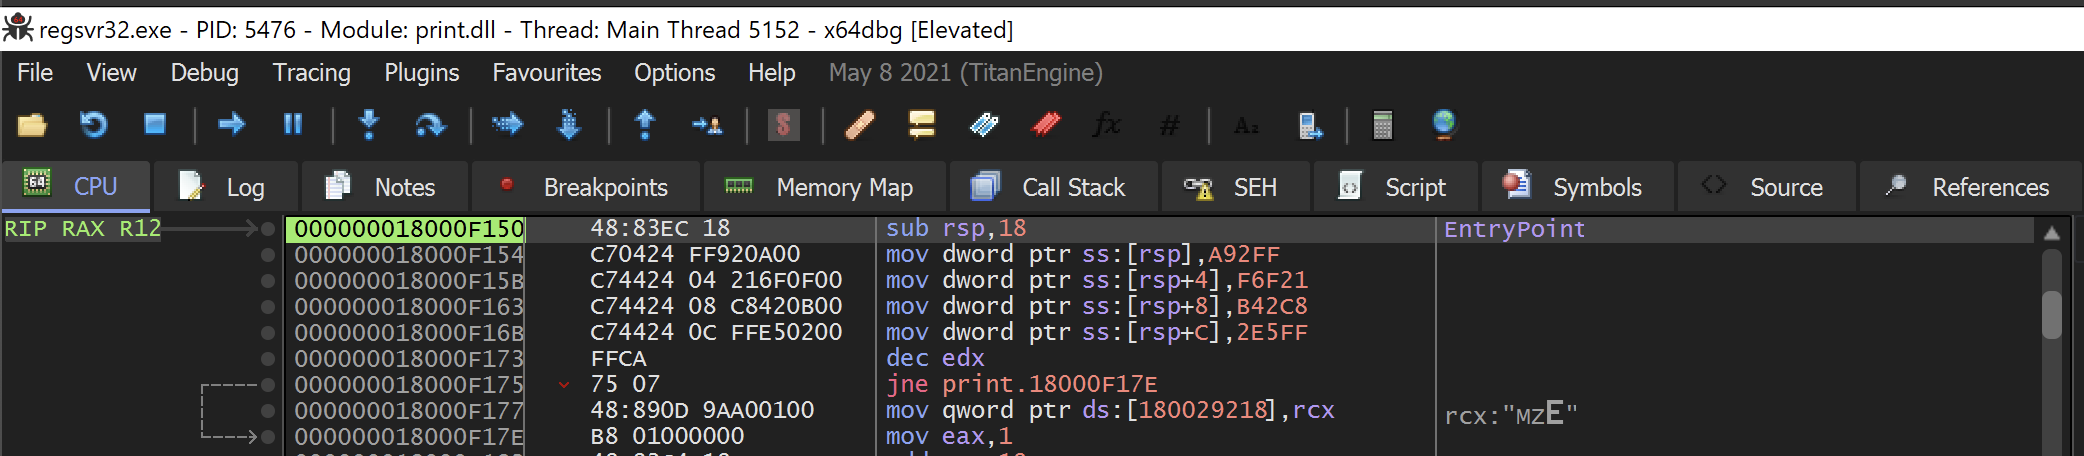
DLL’s entry point
keep proceeding observe that the program continues to run.
If I navigate to the log tab, I can see a substantial amount of output.
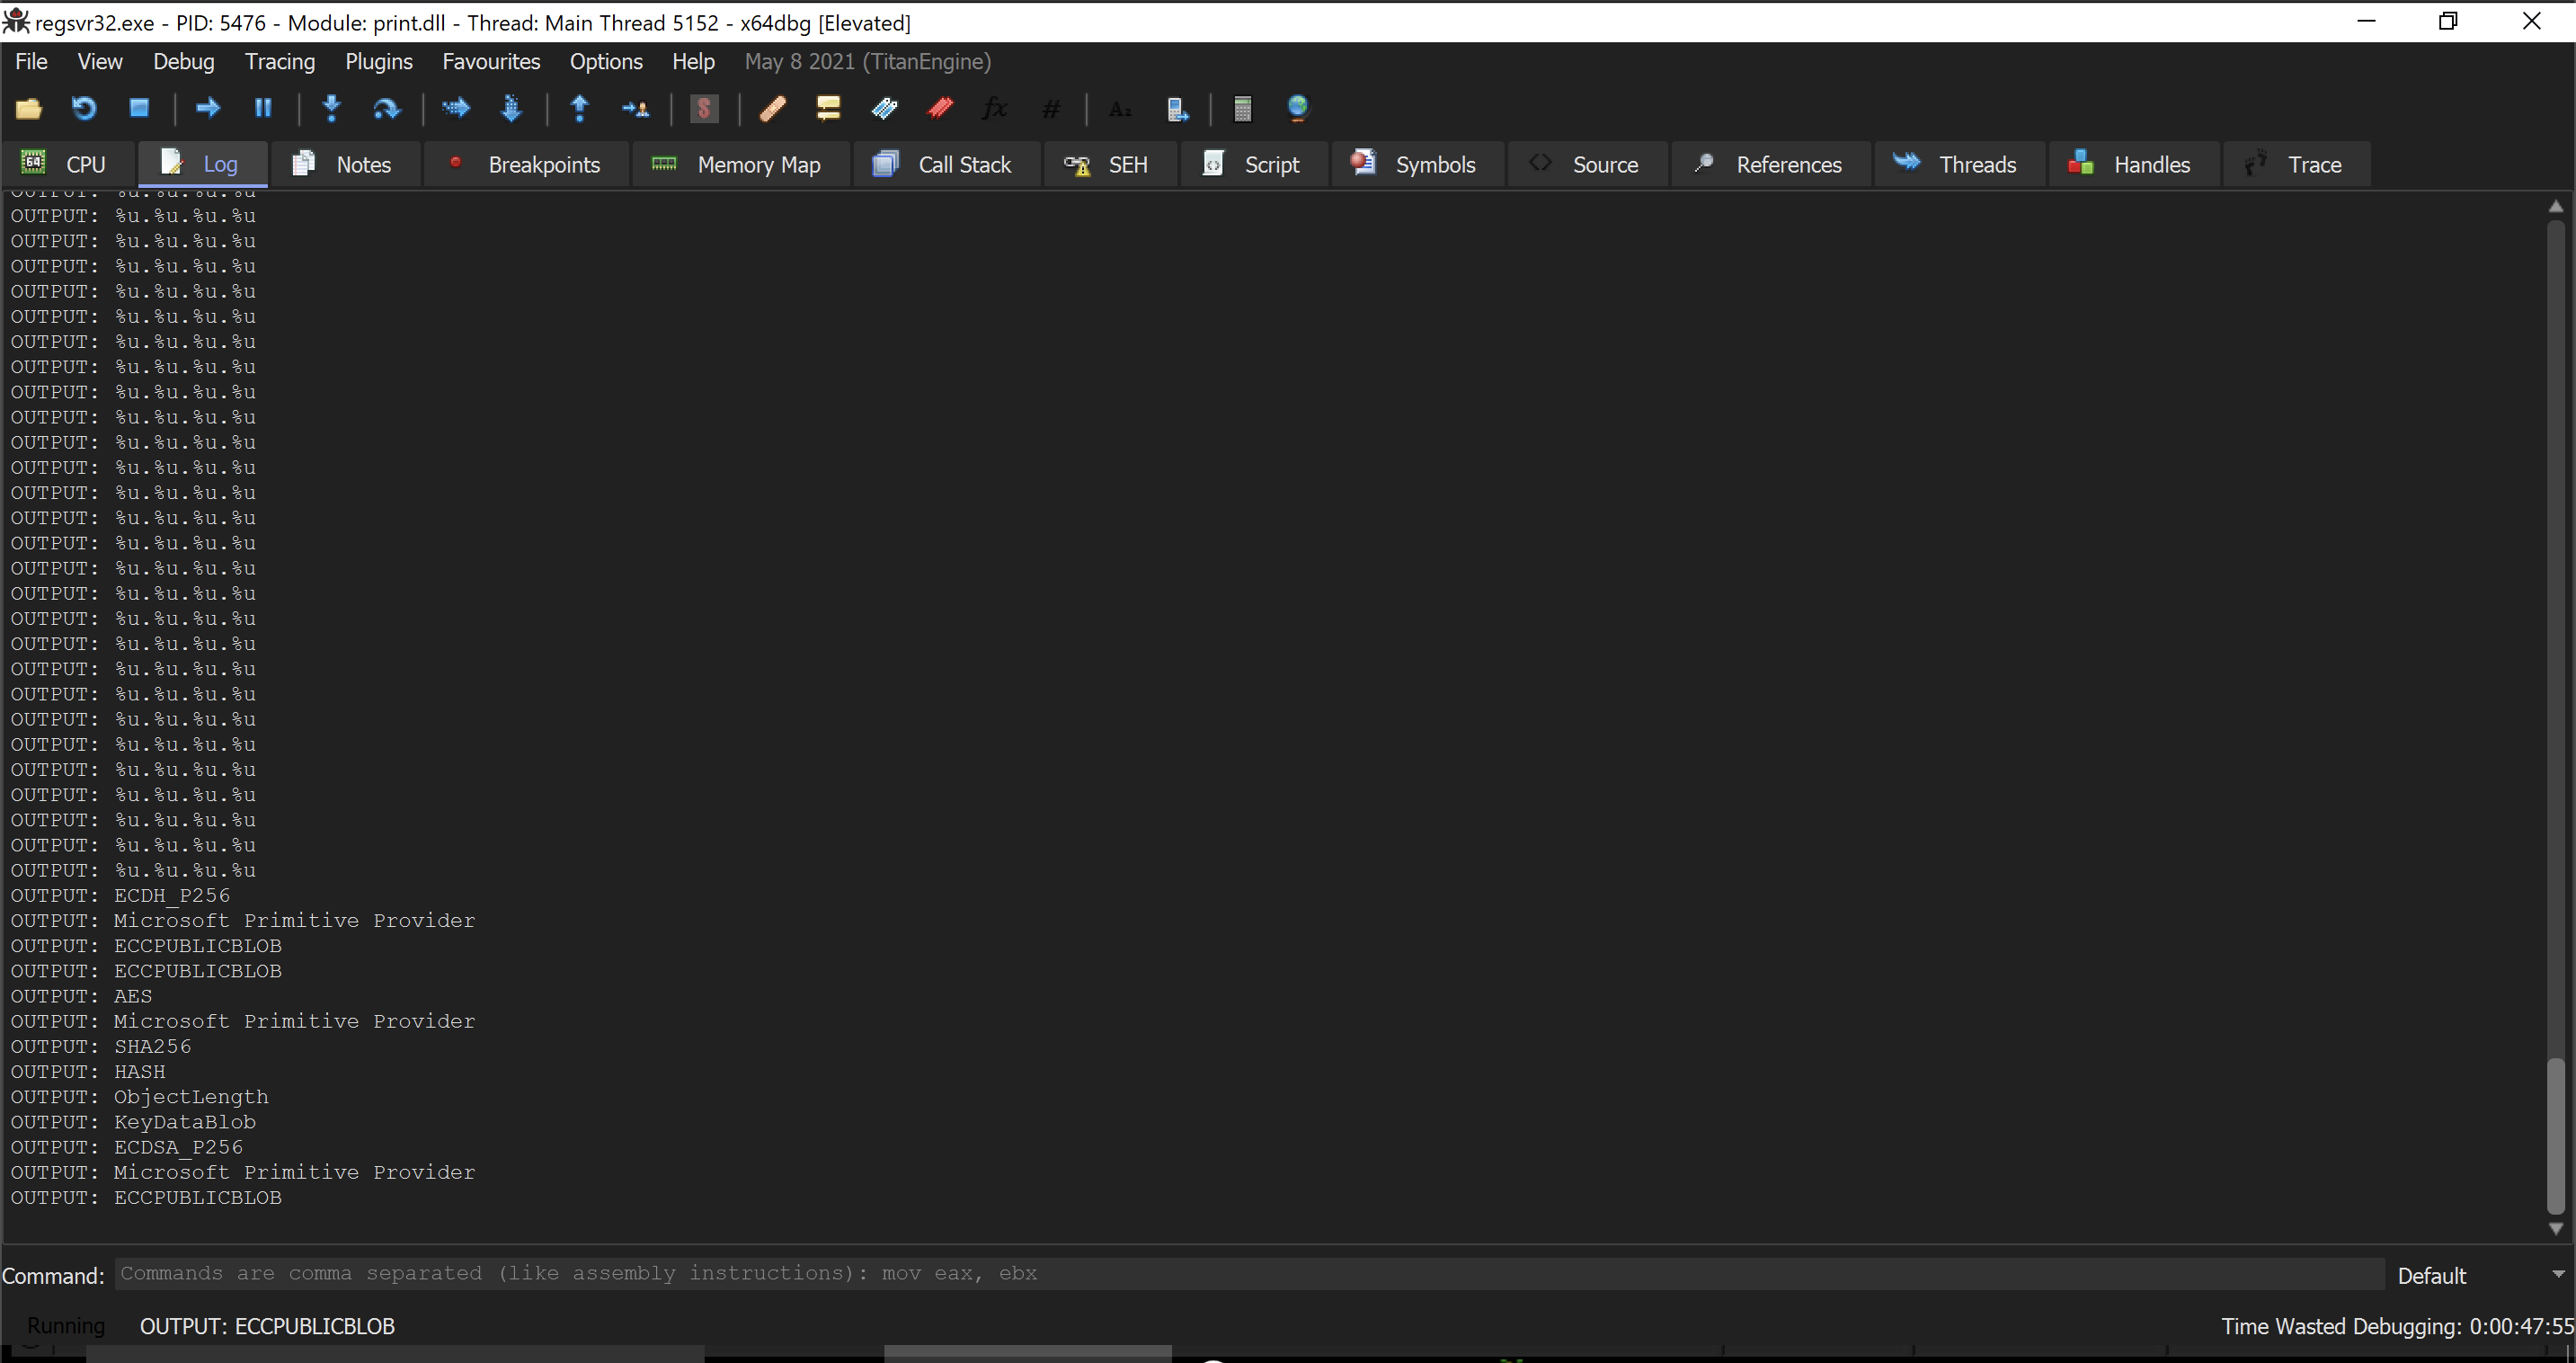
LOG tab
clearly generated by my conditional breakpoint. Scrolling up, you’ll notice there’s a lot of additional information present, and in some instances, my custom output messages are mixed in with the standard x64 debug logs.
To view only the entries from our conditional breakpoint, here’s what we can do remember that I previously redirected the log output to a file on my desktop? Let’s go ahead and take a look at that file now.
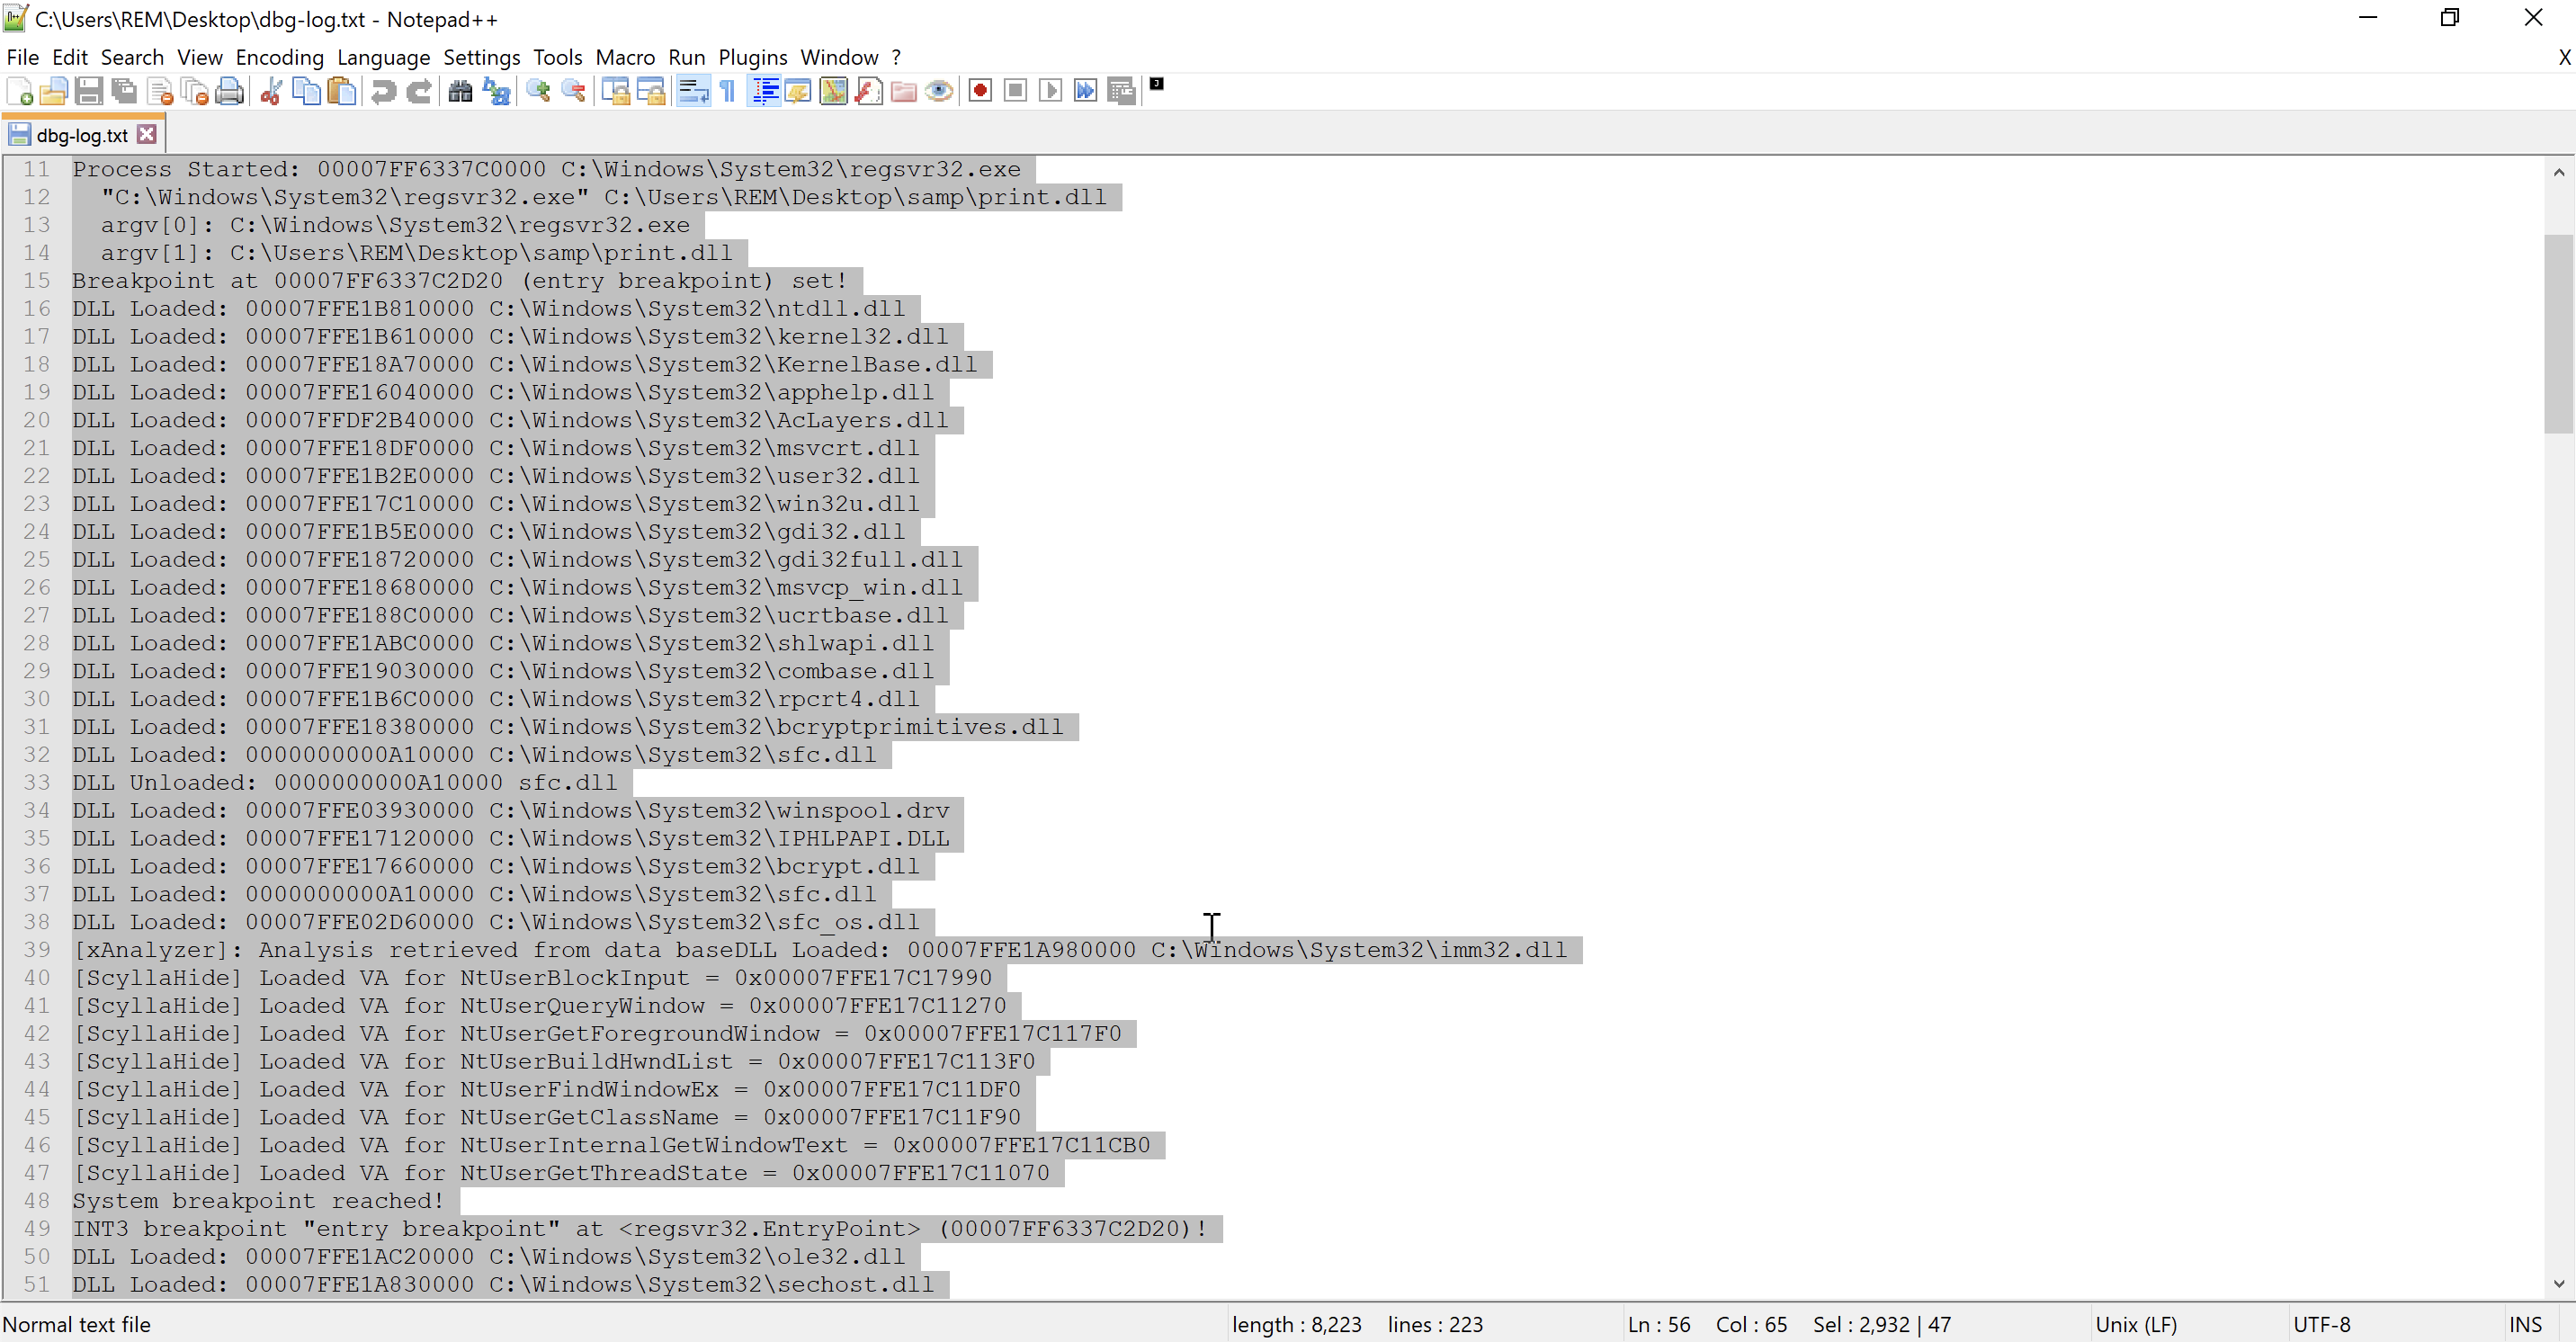
x64dbg log file
There's actually a fair amount of data here, and it aligns closely with what we observed in the log tab of x64 dbook. Next, I'll launch a command prompt and use the FINDSTR command to isolate the logged strings by searching for the specific output text I embedded in the logs.
Command:
FINDSTR OUTPUT dbg-log.txt you'll notice that I now only have my logged text linked to the conditional breakpoint.
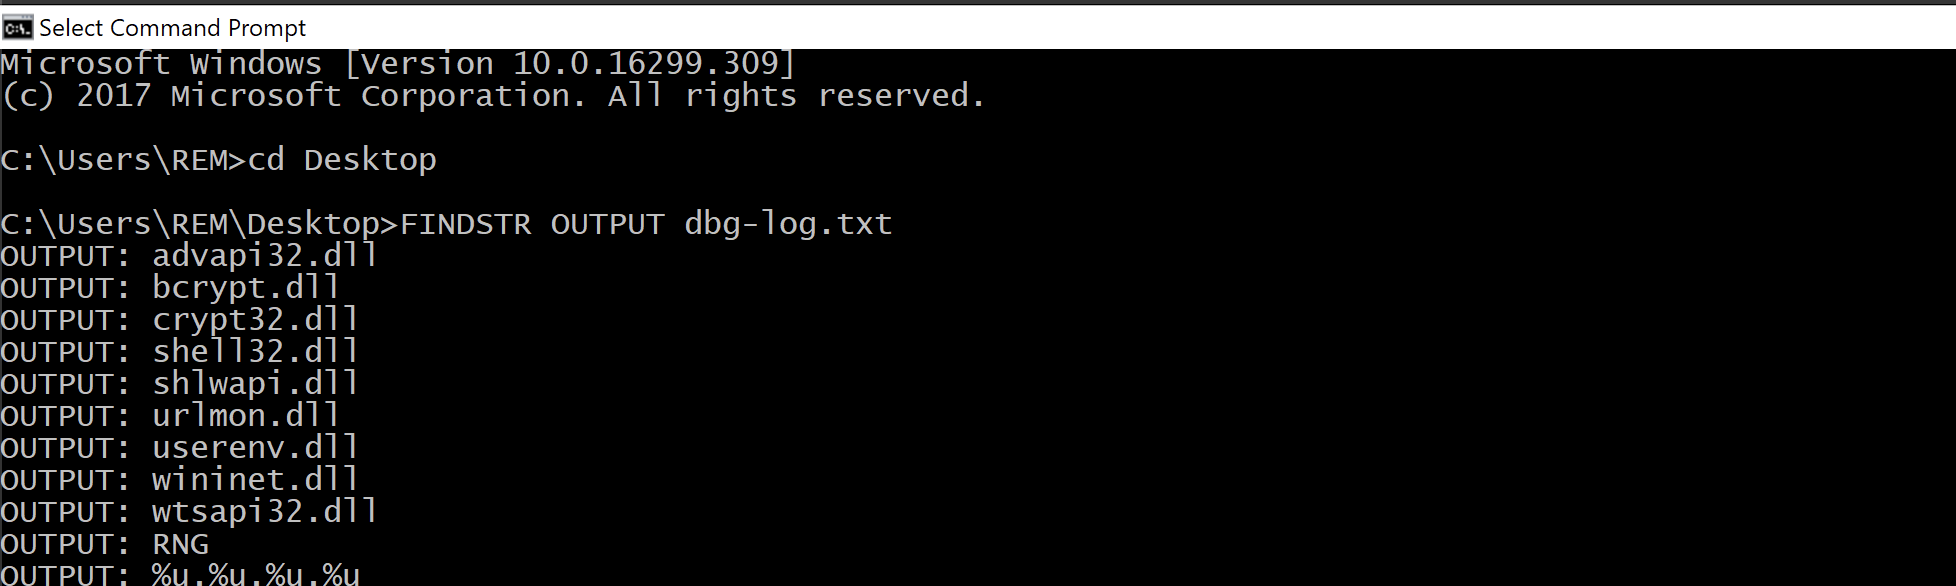
FINDSTR OUTPUT in cmd
Before concluding this article, I’d like to share an example of how conditional breakpoints can help detect code deobfuscation. When analyzing such behavior in a debugger, I typically focus on two key Microsoft APIs: VirtualAlloc, which is responsible for allocating memory, and VirtualProtect, which modifies memory region permissions. By placing breakpoints on these functions, we can examine whether the memory addresses they reference contain executable code.
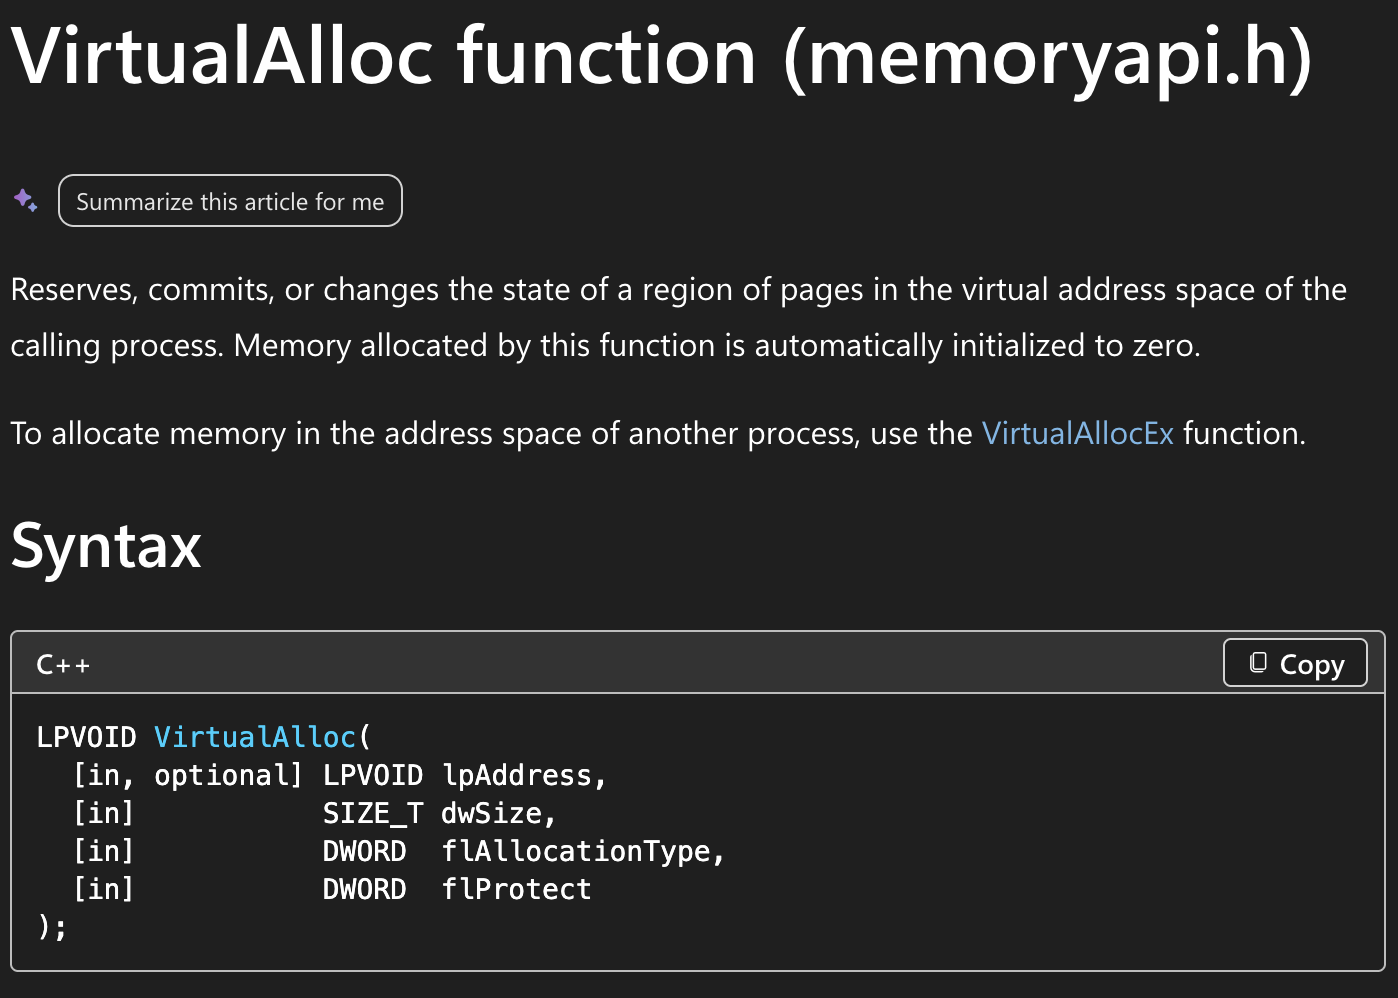
MSDN - VirtualAlloc
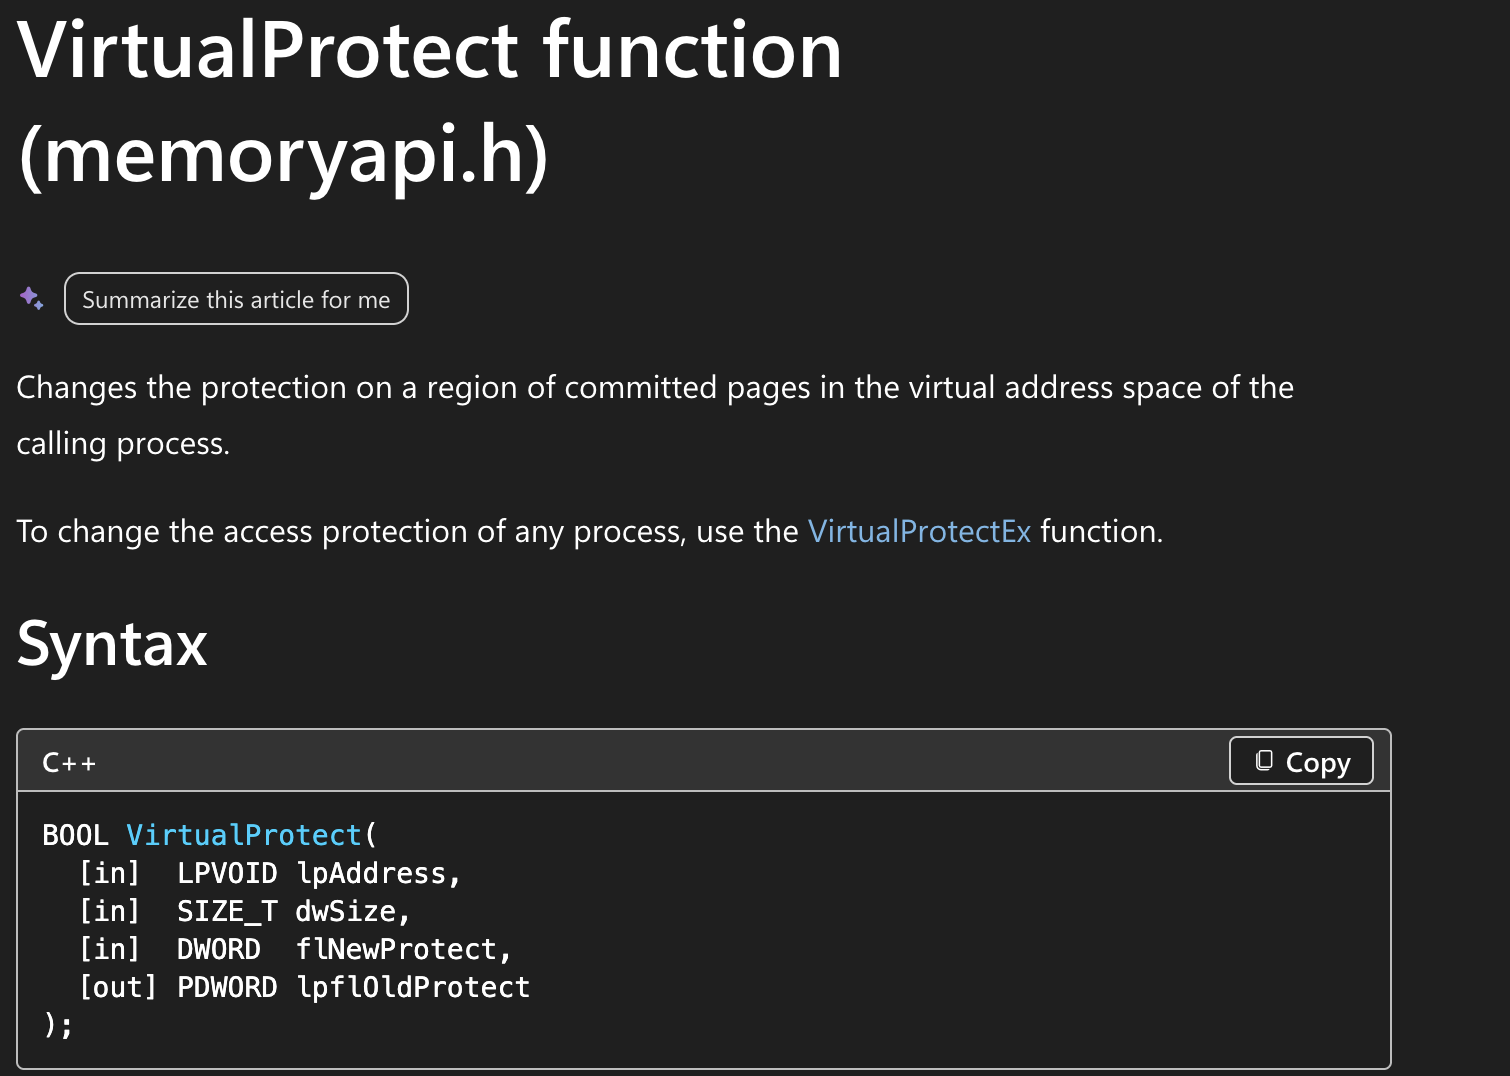
MSDN - VirtualProtect
To carry on our conversation about this scenario, I'll import another file, sample-2.exe, which is a 32-bit Windows executable, into x64 debug.
Sample Metadata:
| Property / Field | Value |
|---|---|
| MD5 | 2bf1a674a5e63bb27f695f0e09ba0ec5 |
| SHA-1 | 16d486aec6801956cc70330343f8f53b070d2a35 |
| SHA-256 | a4852a7a1307ba83e0017b24000d9238a26e3198abb390d2536cee103a629191 |
| Vhash | 015046656d151az45nz1ez1 |
| Authentihash | 93d70fe738f91d747bbed5914af5eb06daa8392fcdaddbfc29423f52f4c65206 |
| Imphash | e28e04a7ac948b435bd640e83b2d285c |
| Rich PE Header Hash | 05e00c445df281f24266aee892fbdb93 |
| SSDEEP | 3072:4efx+Z+FjoD/aPkInA/n7kl7m56mztCb+ZLhzI5alj/5ISk:4e4+pPkAA/gJm5tg+ZLhzialjyp |
| TLSH | T11D04C0223A40D473D427A1724860DA74EF3866714B7C95DB7BE903BE9F603E0923E35A |
| File Type | Win32 EXE executable windows win32 pe peexe |
| Magic | PE32 executable (GUI) Intel 80386, for MS Windows |
| TrID | Win32 Executable MS Visual C++ (47.3%) · Win64 Executable (15.9%) · Win32 Dynamic Link Library (9.9%) · Win16 NE executable (7.6%) · Win32 Executable (6.8%) |
| DetectItEasy | PE32, Compiler: EP:Microsoft Visual C/C++ (2008-2010) [EXE32], Compiler: Microsoft Visual C/C++ (15.00.21022) [LTCG/C++], Linker: Microsoft Linker (9.00.21022), Tool: Visual Studio (2008) |
| Magika | PEBIN |
| File Size | 174.50 KB (178,688 bytes) |
Load it into x32dbg.
I can proceed to set break points on both virtualAlloc and VirtualProtect with the following command.
bp VirtualAlloc; bp VirtualProtect
Breakpoint set
Now If I keep running this code, I'll pause every time I come across one of those APIs. Let’s proceed and check how many such references exist, then I’ll keep pressing the run button.
VirtualAlloc hit - 2 times

VirtualProtect hit - 5 times
That adds up to seven pauses at breakpoints linked to calls to VirtualAlloc and VirtualProtect. The question is, which of these might involve executable memory? Both APIs include a parameter for a memory protection flag, which defines how the allocated memory can be accessed. Among these flags, four specifically allow execution within a memory region. When one of these execution-enabled flags appears in a function call, it’s often a sign that the allocation or protection change could involve executable code. Instead of going through each of the seven stops individually to check the protection settings, we could set up a conditional breakpoint to jump directly to the relevant instances.
Keep in mind this sample deletes itself after execution.
Let’s roll back and load it again in x32dbg.
Now that we've returned to the entry point, I'll move on to VirtualAlloc. I'll press Ctrl+G, enter VirtualAlloc, and click okay.
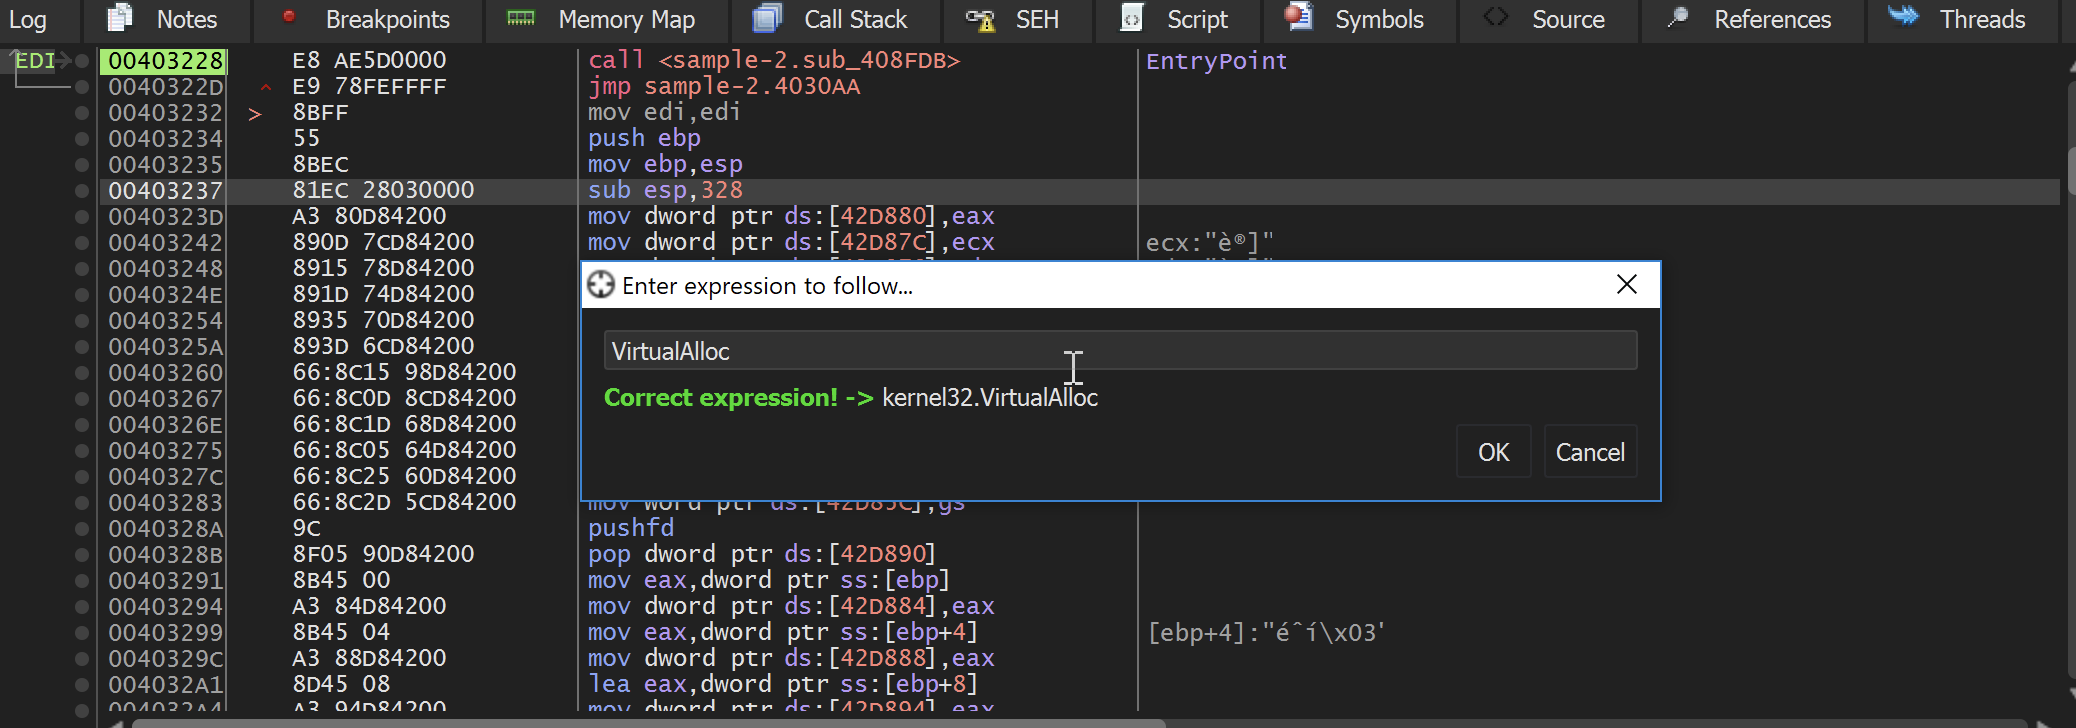
jumping to VirtualAlloc
Next, I'll right-click in this area, navigate to breakpoint, and select set conditional breakpoint.

right click → breakpoint → set conditional breakpoint.
According to the x64dbg documentation, in the section on expression functions, under "arguments," it states that arguments can be retrieved using ARG.get followed by the corresponding index, with indexing starting at zero.
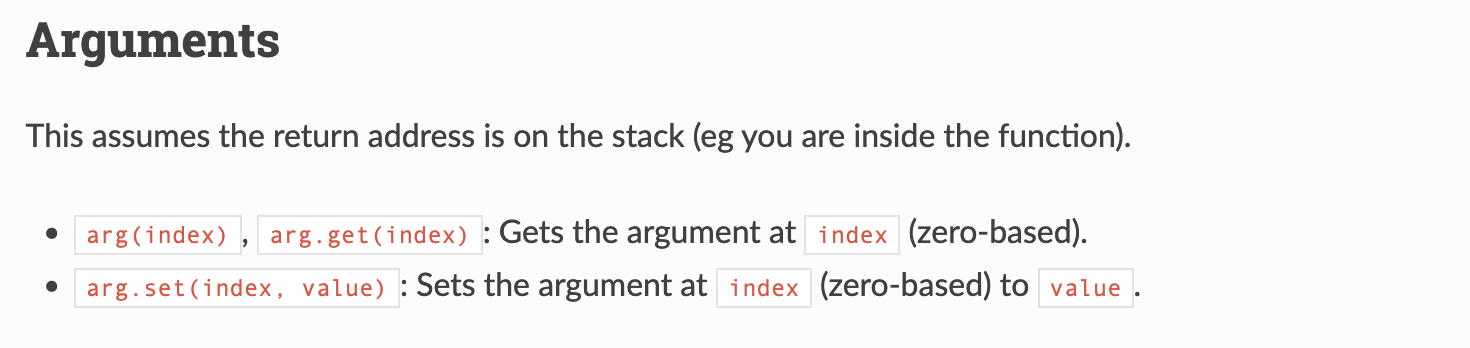
X64dbg documentation arguments.
The fourth parameter passed to VirtualAlloc defines the memory protection setting. By comparing this value against the four memory protection constants that allow execution, I can narrow in on the VirtualAlloc calls most relevant to detecting executable code. This would require a condition that evaluates the fourth argument and checks whether it matches any of those four specific constants.
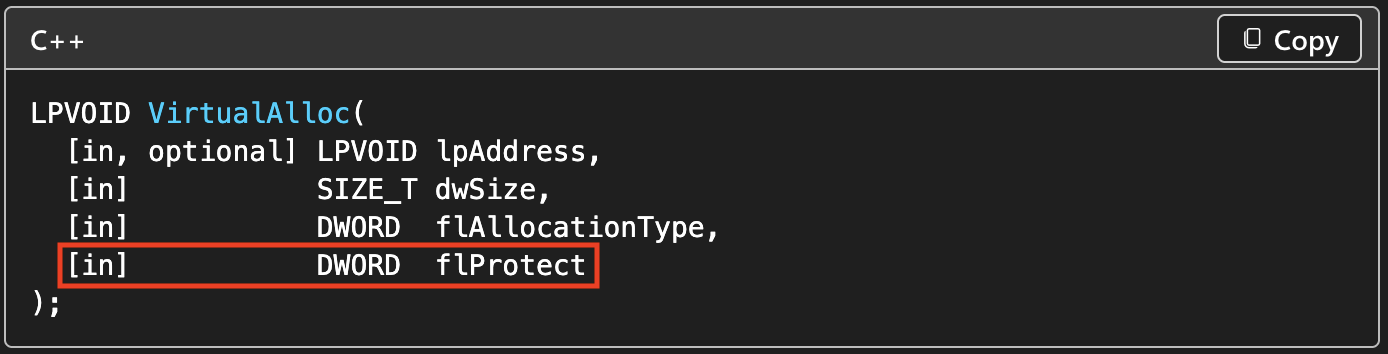
VirtualAlloc
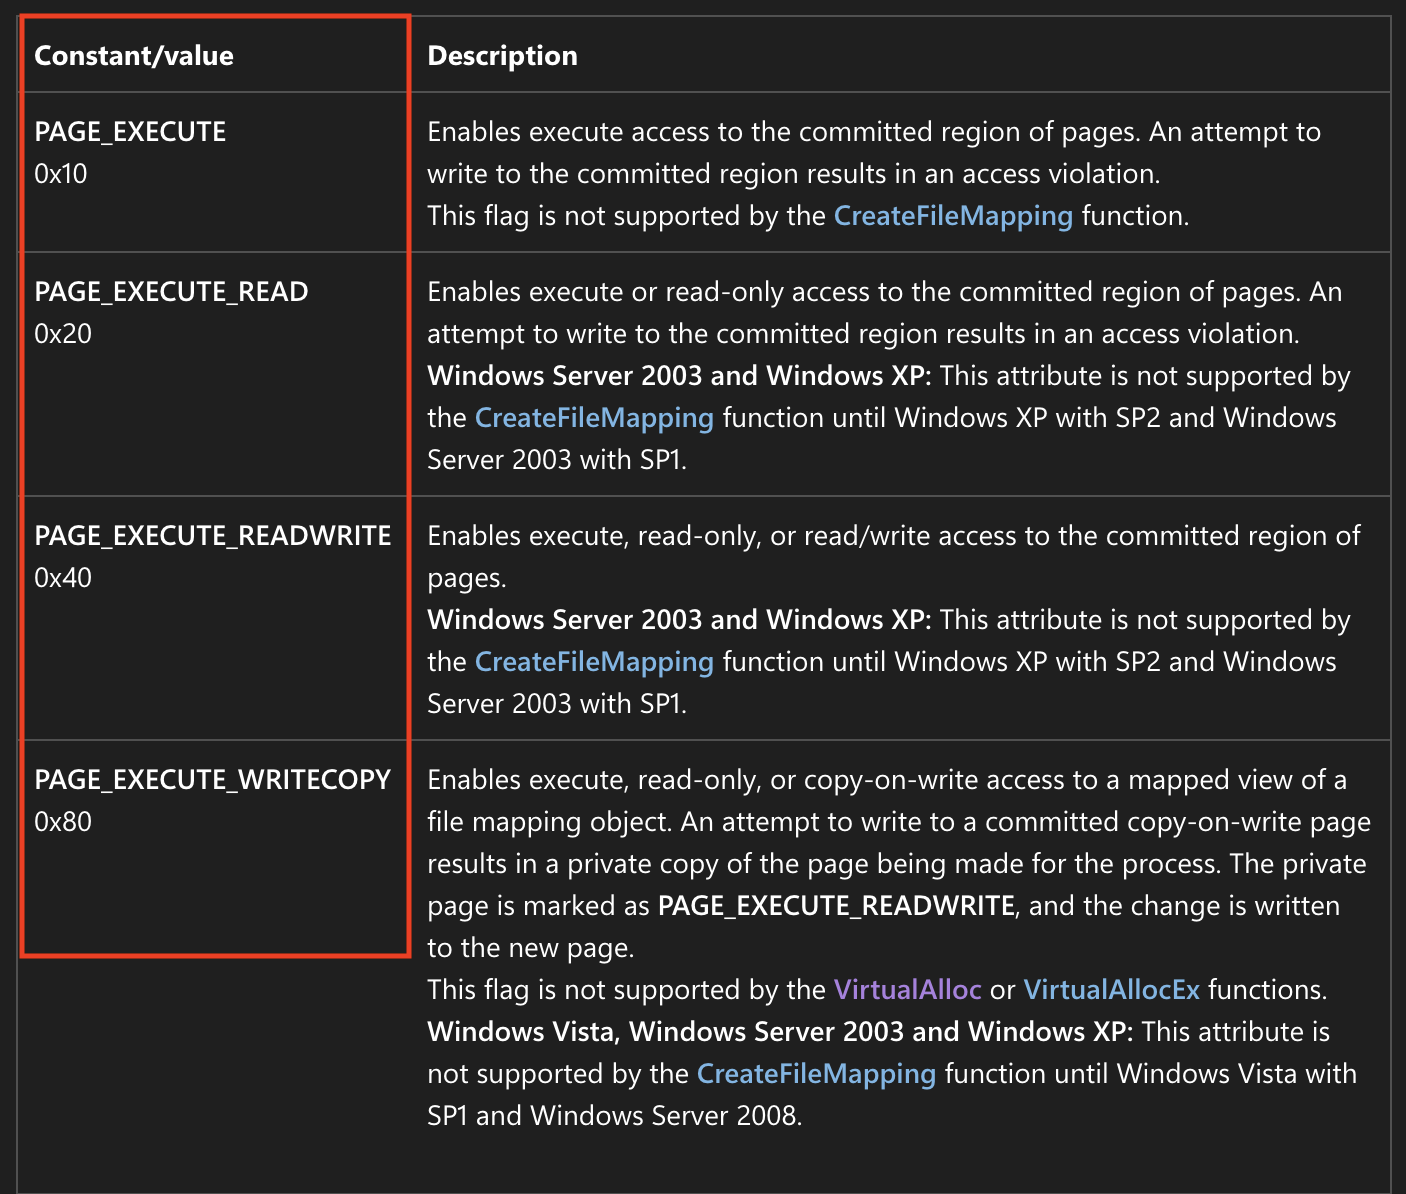
Memory protection constants
Here, you can see I’ve set up four checks targeting the memory protection constants most relevant to us. The two vertical lines represent a logical OR operation just to clarify and we’re using the number three because the indexing is zero-based. This means the first argument corresponds to index zero, so the fourth argument, as shown here, is accessed with the value three. Next, I’ll go ahead and copy this command.
arg.get(3) == 0x10 || arg.get(3) == 0x20 || arg.get(3) == 0x40 || arg.get(3) == 0x80Four relevant memory protection checks constants will look something like this.
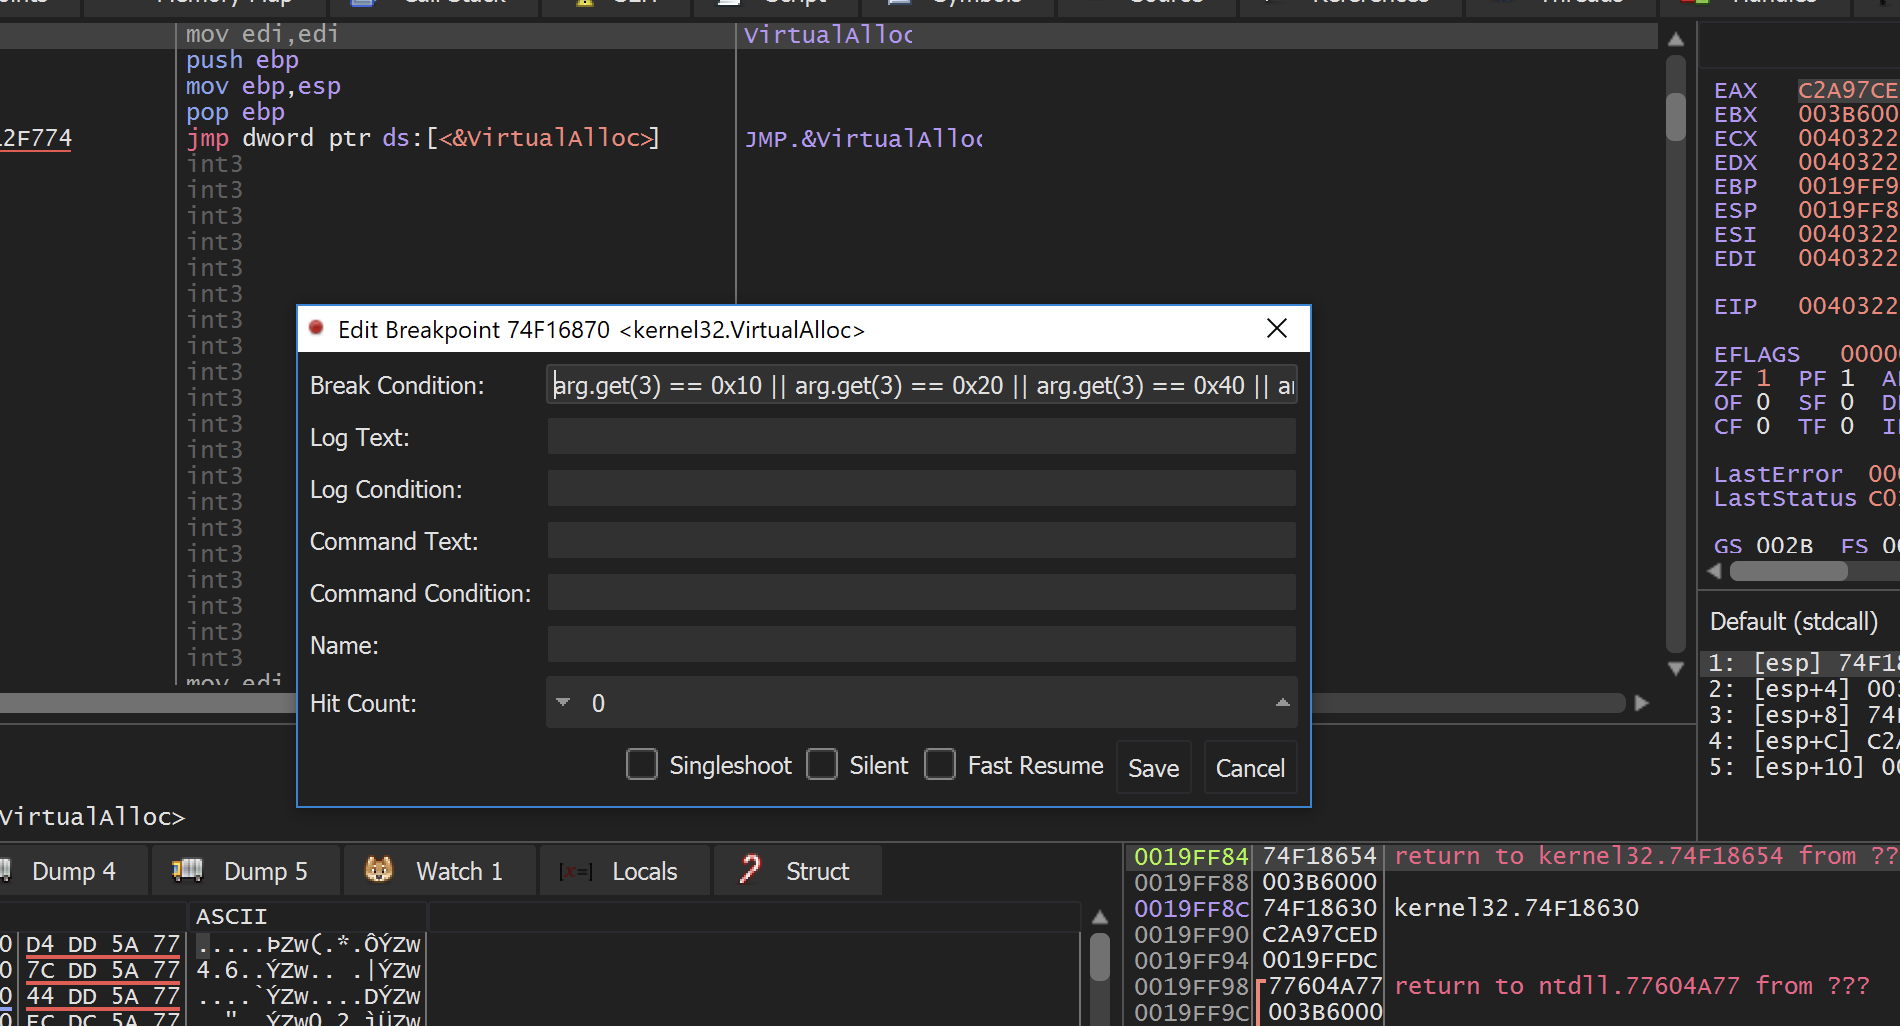
Edit breakpoint VirtualAlloc: Break condition
now press save.
The same approach can be applied to VirtualProtect. I’ll navigate to VirtualProtect and set a conditional breakpoint there as well. The condition will be similar, but since the memory protection flag is passed as the third argument in this case, the breakpoint logic will mirror the previous one—only instead of retrieving the fourth argument, we’ll extract the third.
like this
arg.get(2) == 0x10 || arg.get(2) == 0x20 || arg.get(2) == 0x40 || arg.get(2) == 0x80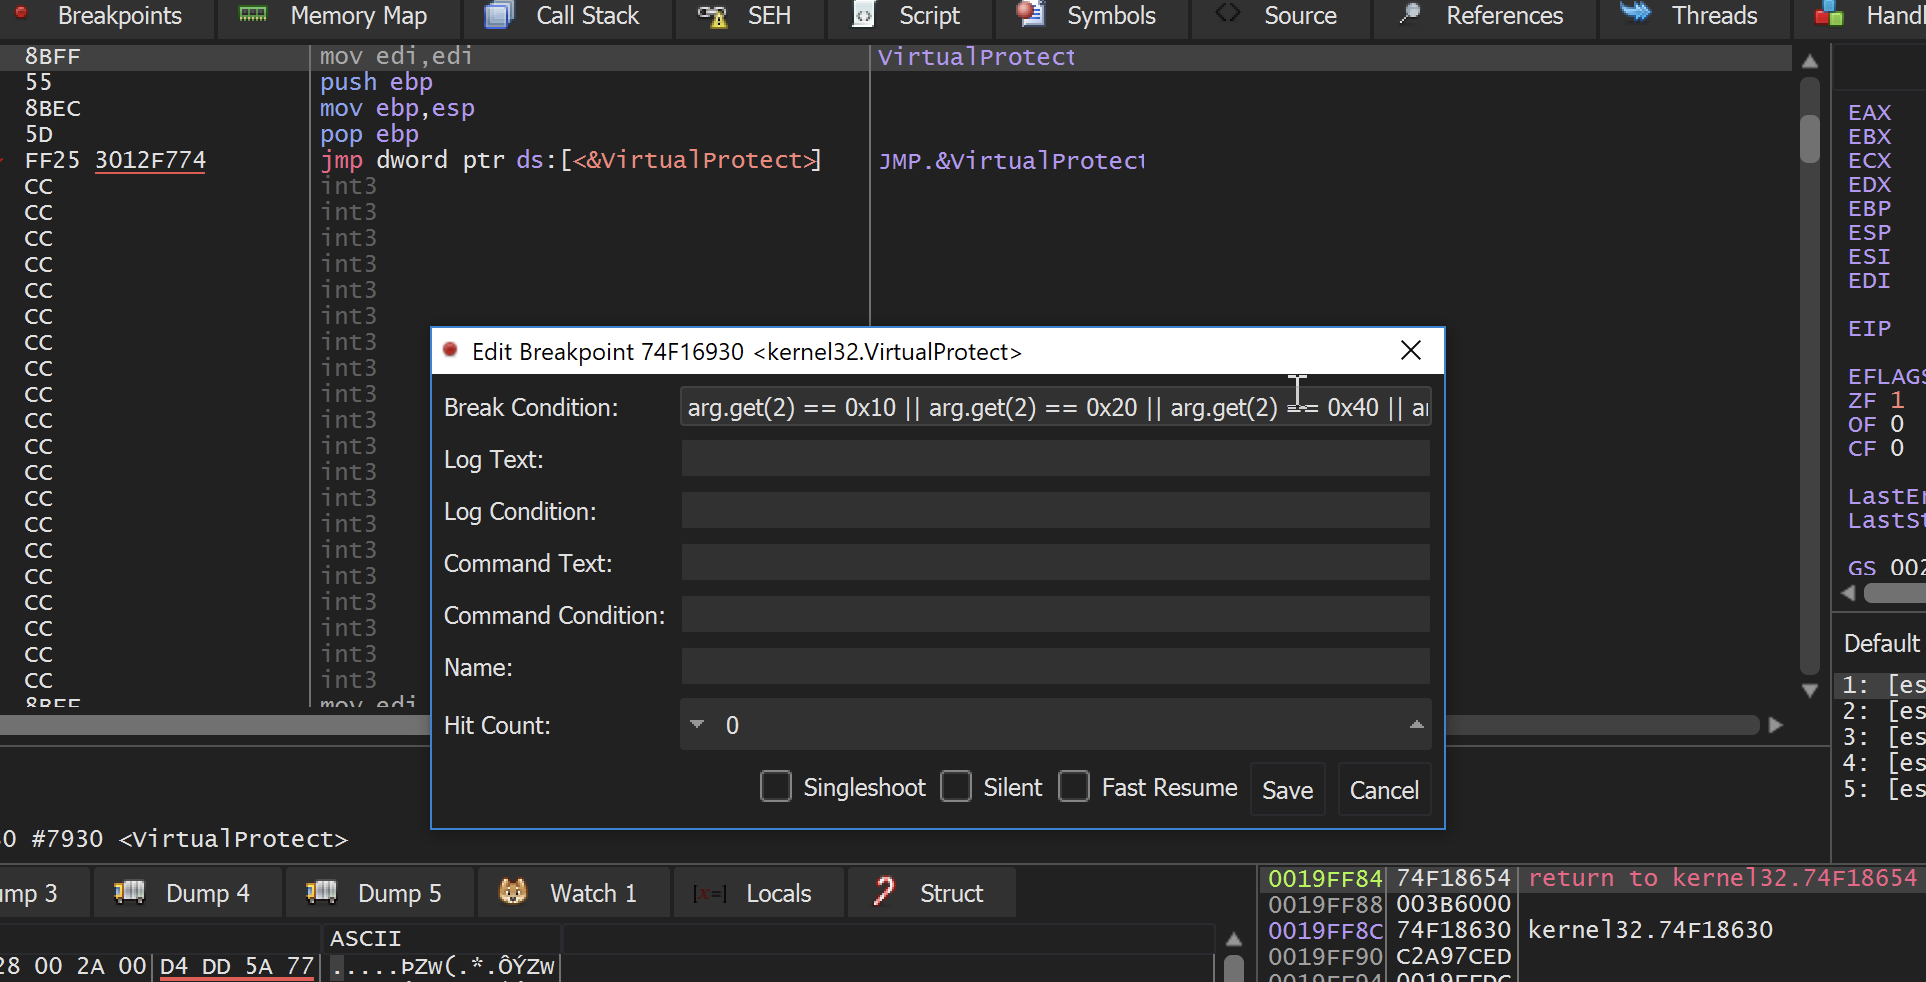
Edit breakpoint VirtualProtect: Break condition
and click save.
Now I can go back to whatever EIP refers to by right-clicking here and tracing it in the disassembler, and I can begin executing this program.
Now, the first time we arrive at one of our conditional breakpoints, we'll see that there is a call to VirtualAlloc. That's how we ended up at this code.
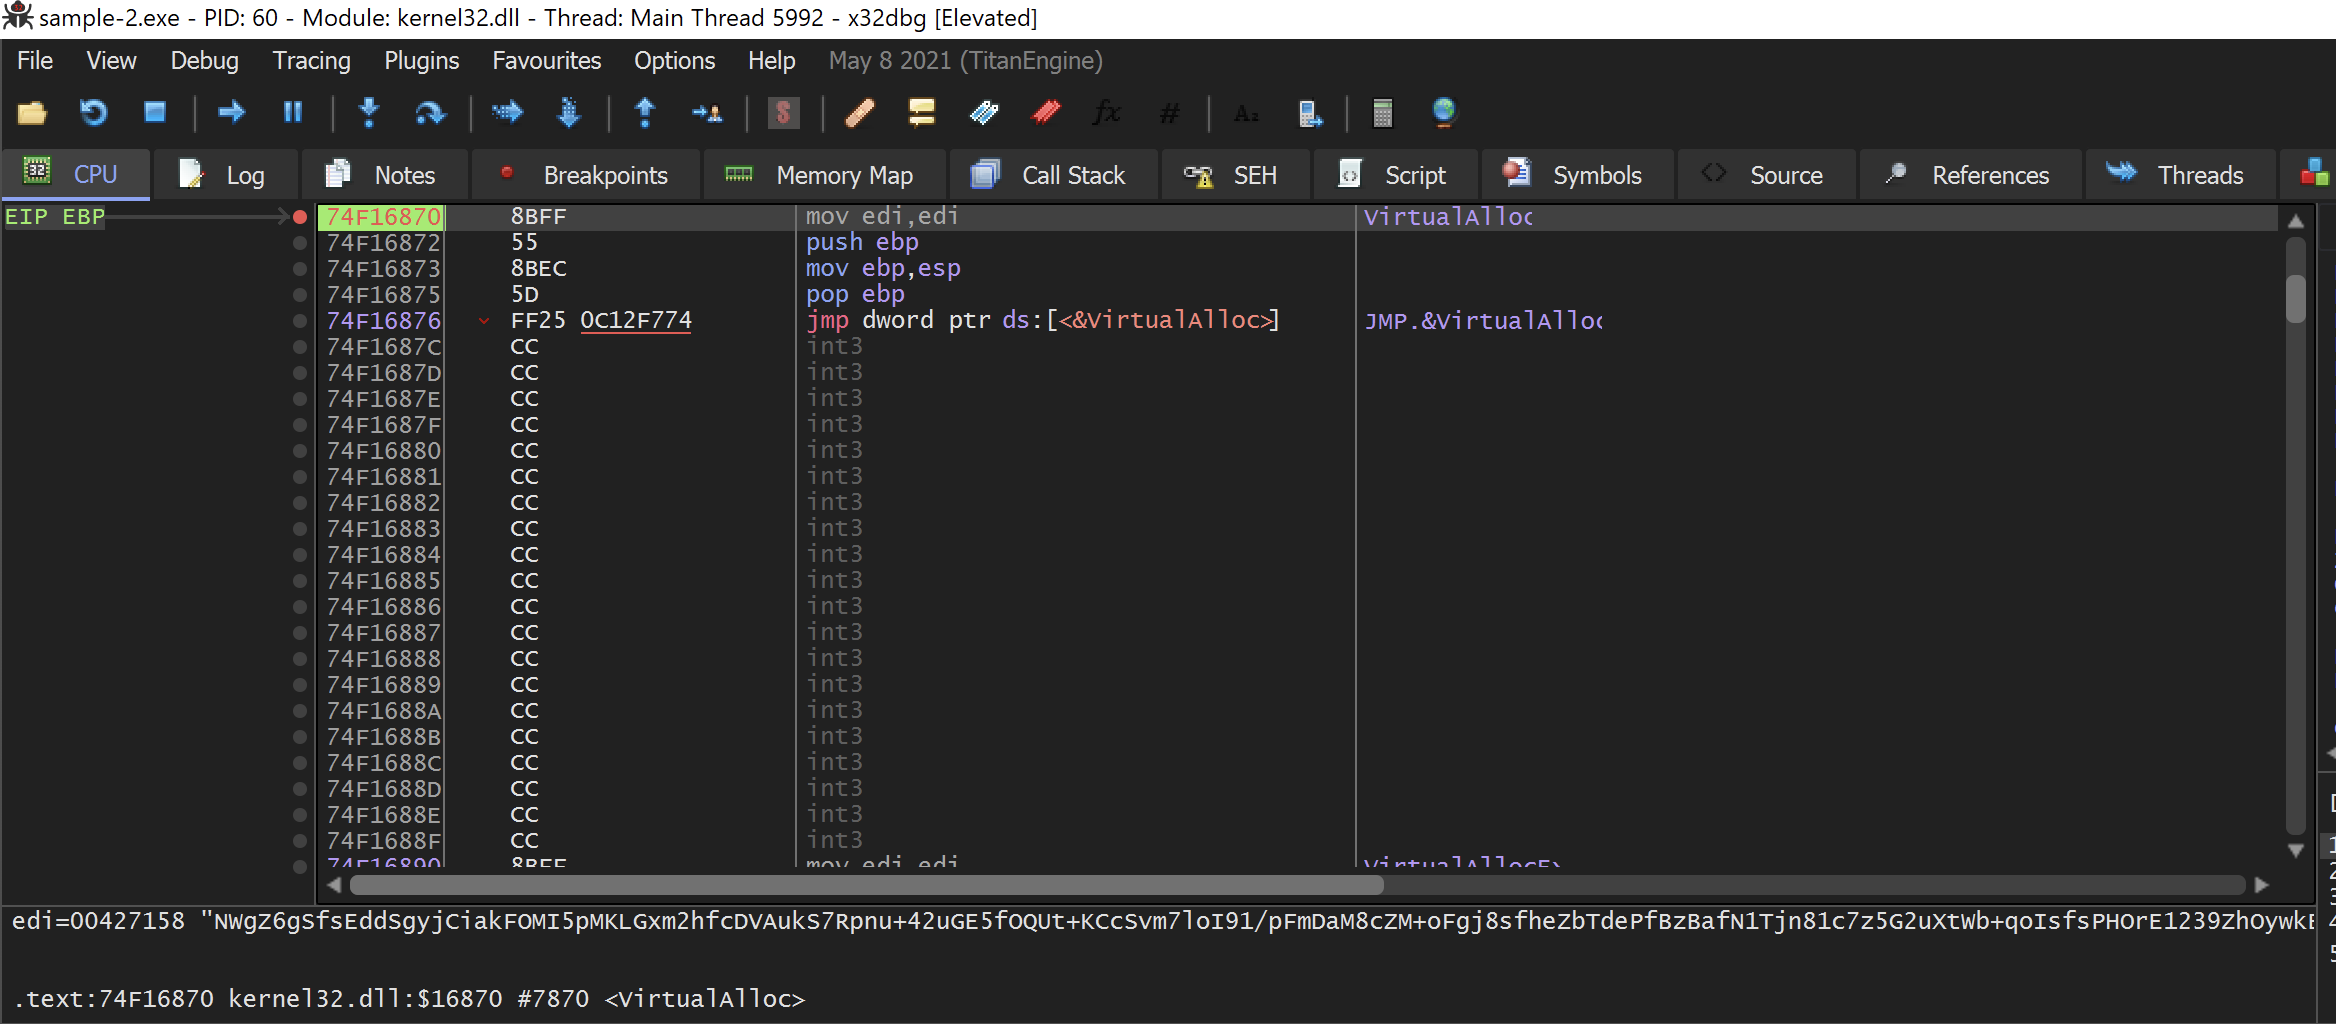
VirtualAlloc conditional breakpoint
VirtualAlloc provides the starting address of the allocated memory region. I want this function to run until it produces a result.
Execute till return.
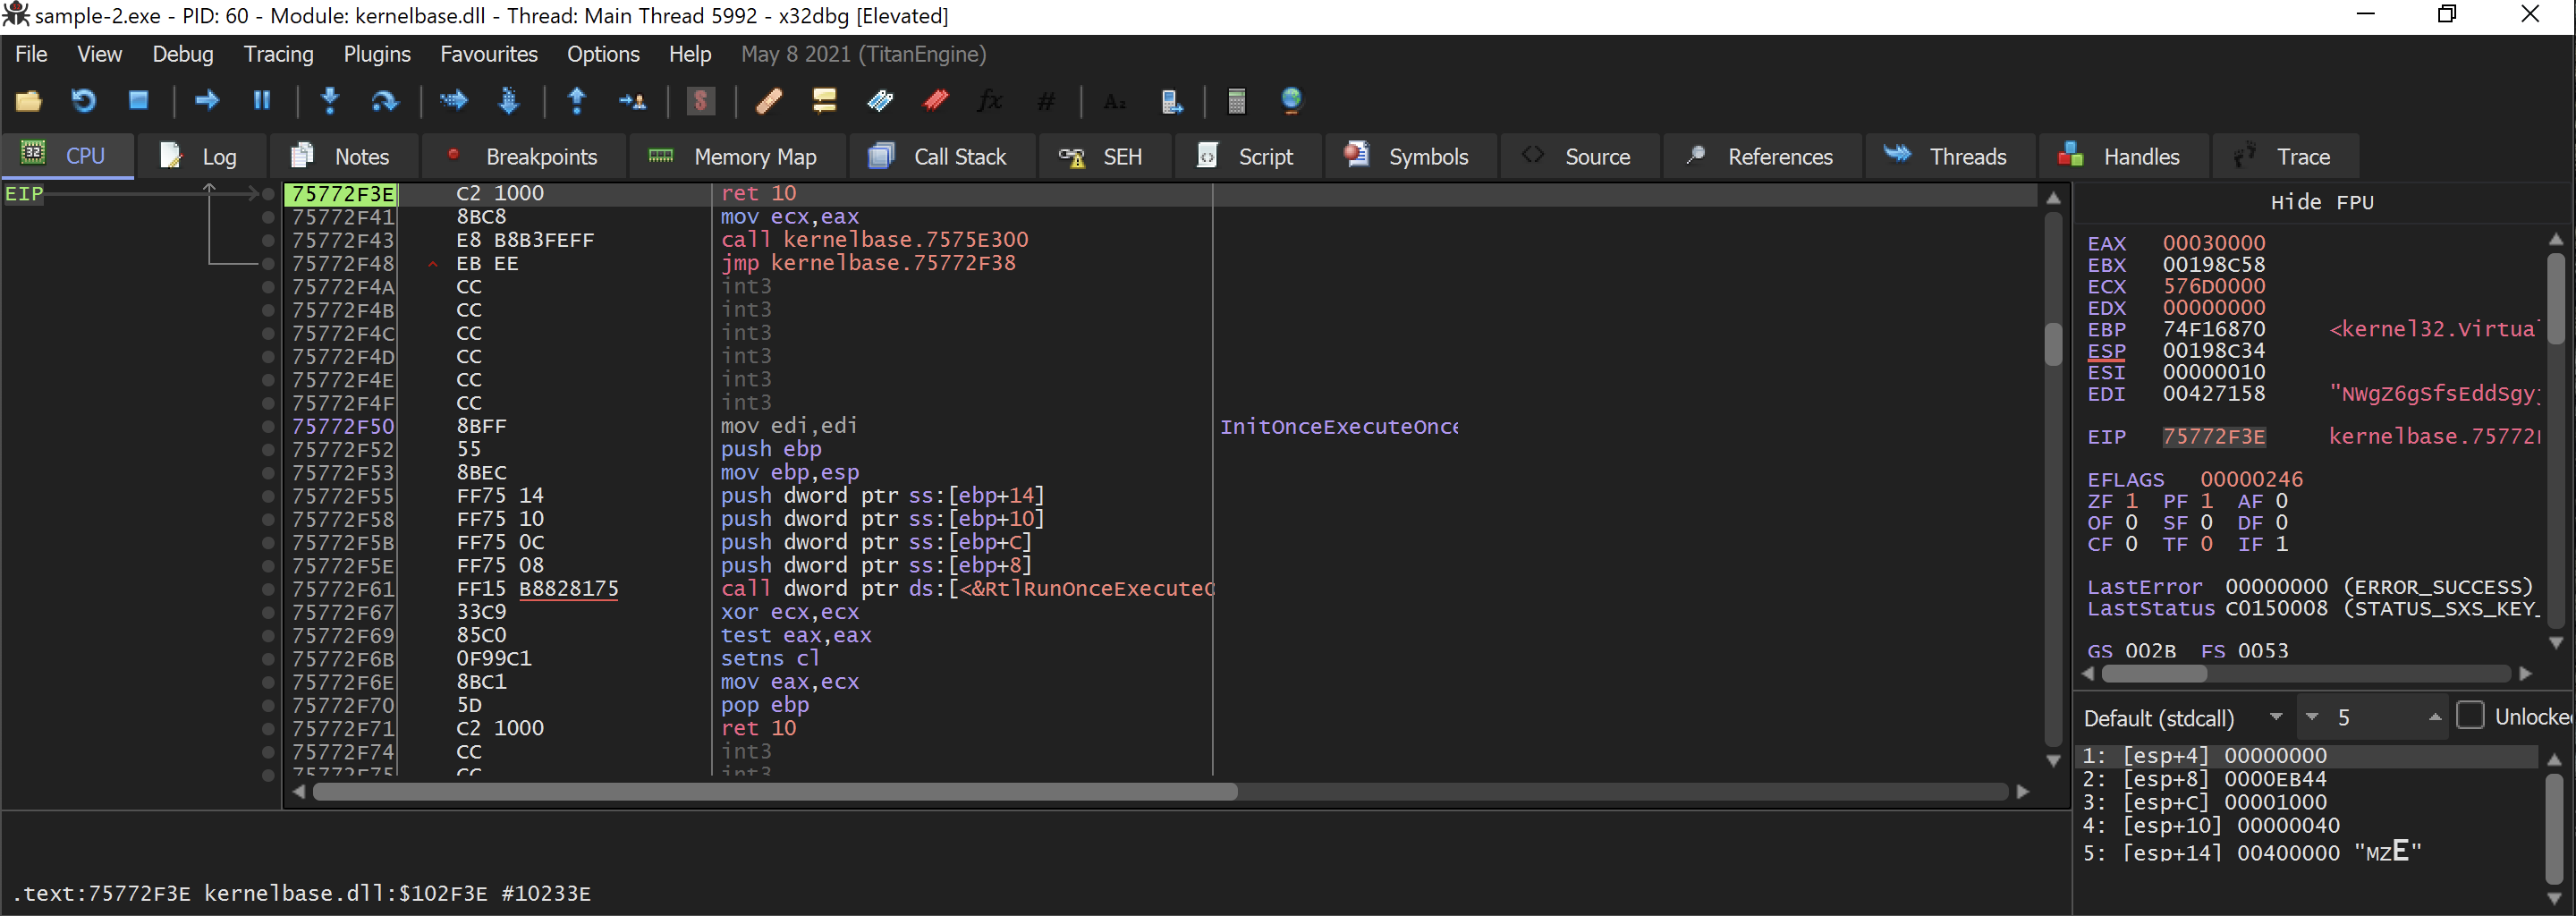
Executed till return
Now I will begin pressing F8 or using step over on my keyboard, which enables me to go back to the user code.
Notice i’m return to sample-2.exe
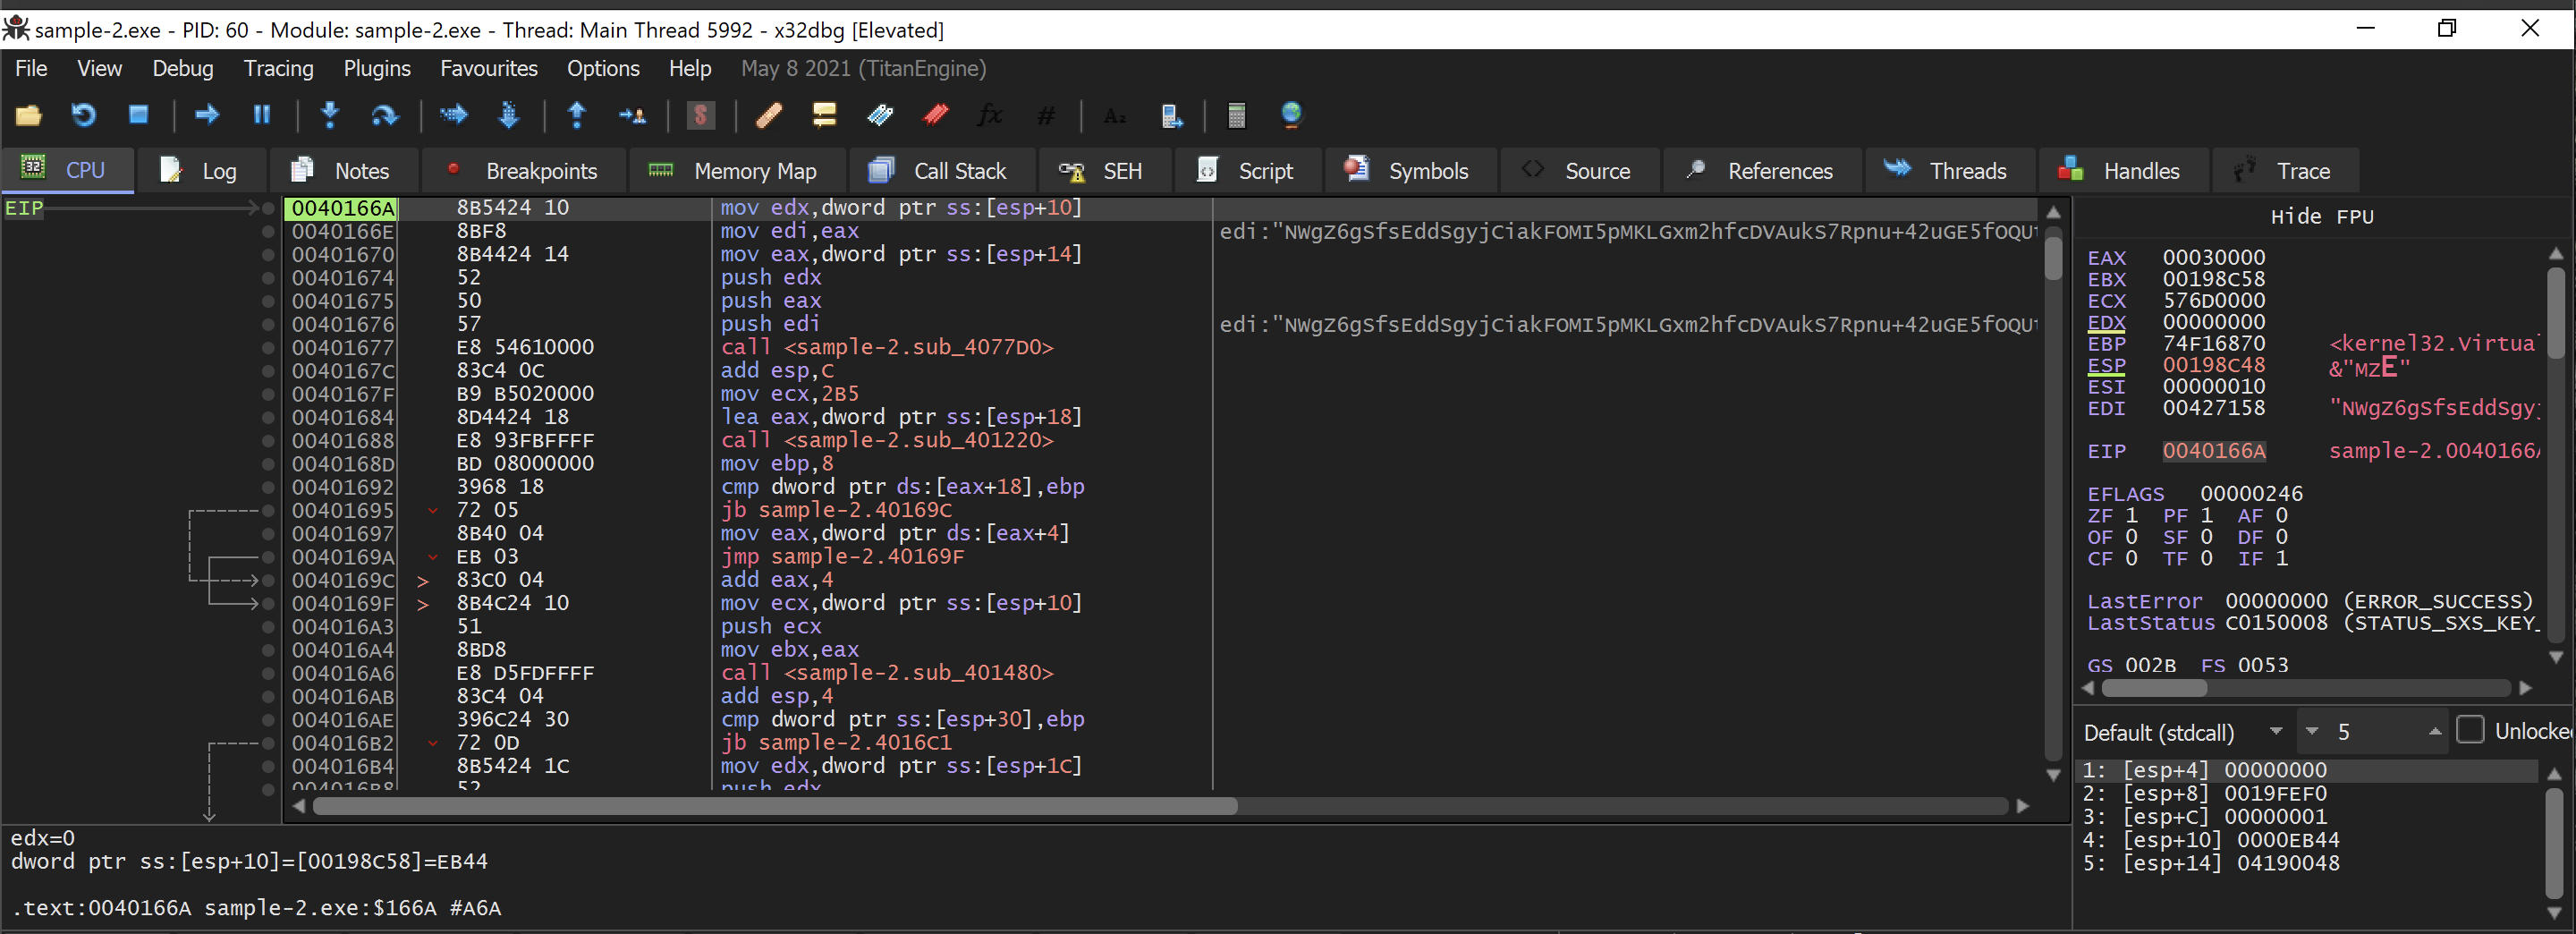
back to user code.
At this point, EAX will hold the address of the newly allocated memory region, as previously noted. If I track this in the dump, I'd anticipate seeing it cleared out essentially what VirtualAlloc does. From here, I can keep stepping through the instructions by pressing F8 again, and once I pass that function call, you'll see data start to appear in the dump window.
Currently, what I'm examining could be code, yet further analysis and experience would suggest this remains ambiguous.
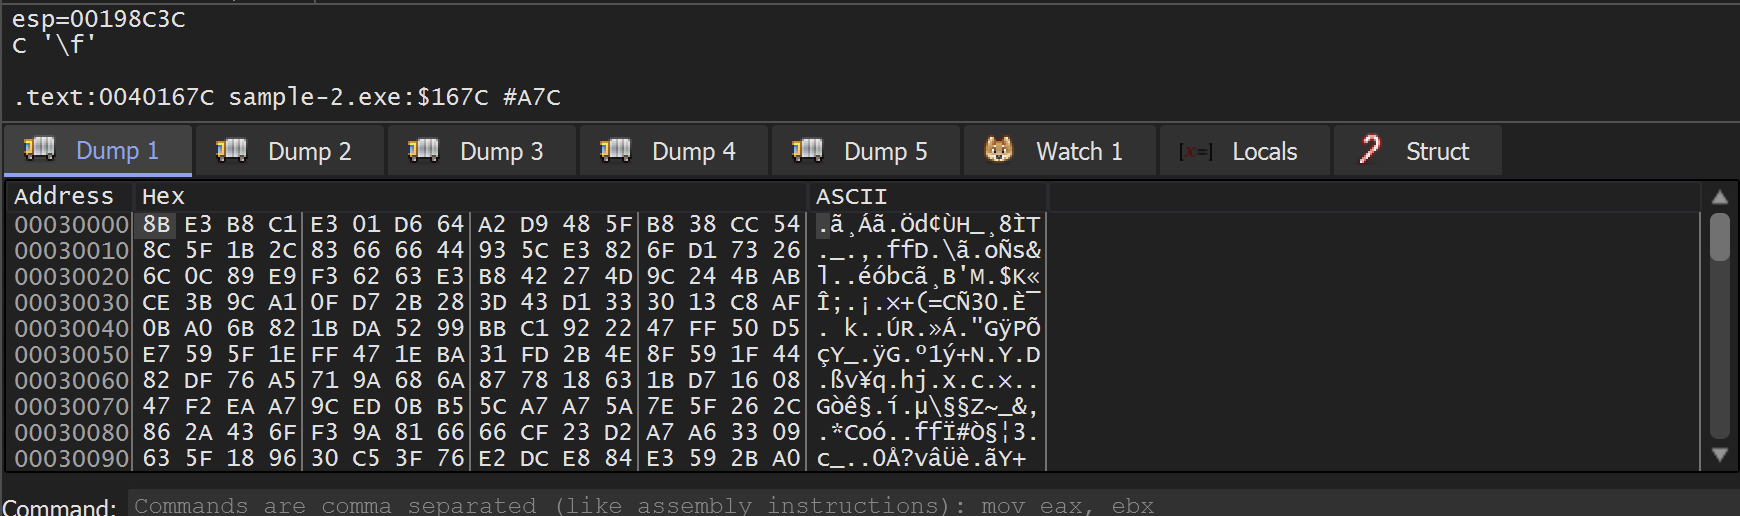
As I continue stepping through the execution, I eventually reach a function call that modifies the contents of the dump window. At this point, experience suggests that the opcodes currently displayed in the window are indeed linked to executable code.
As shown, the initial conditional breakpoint we set successfully pinpointed a region that eventually contained executable code.
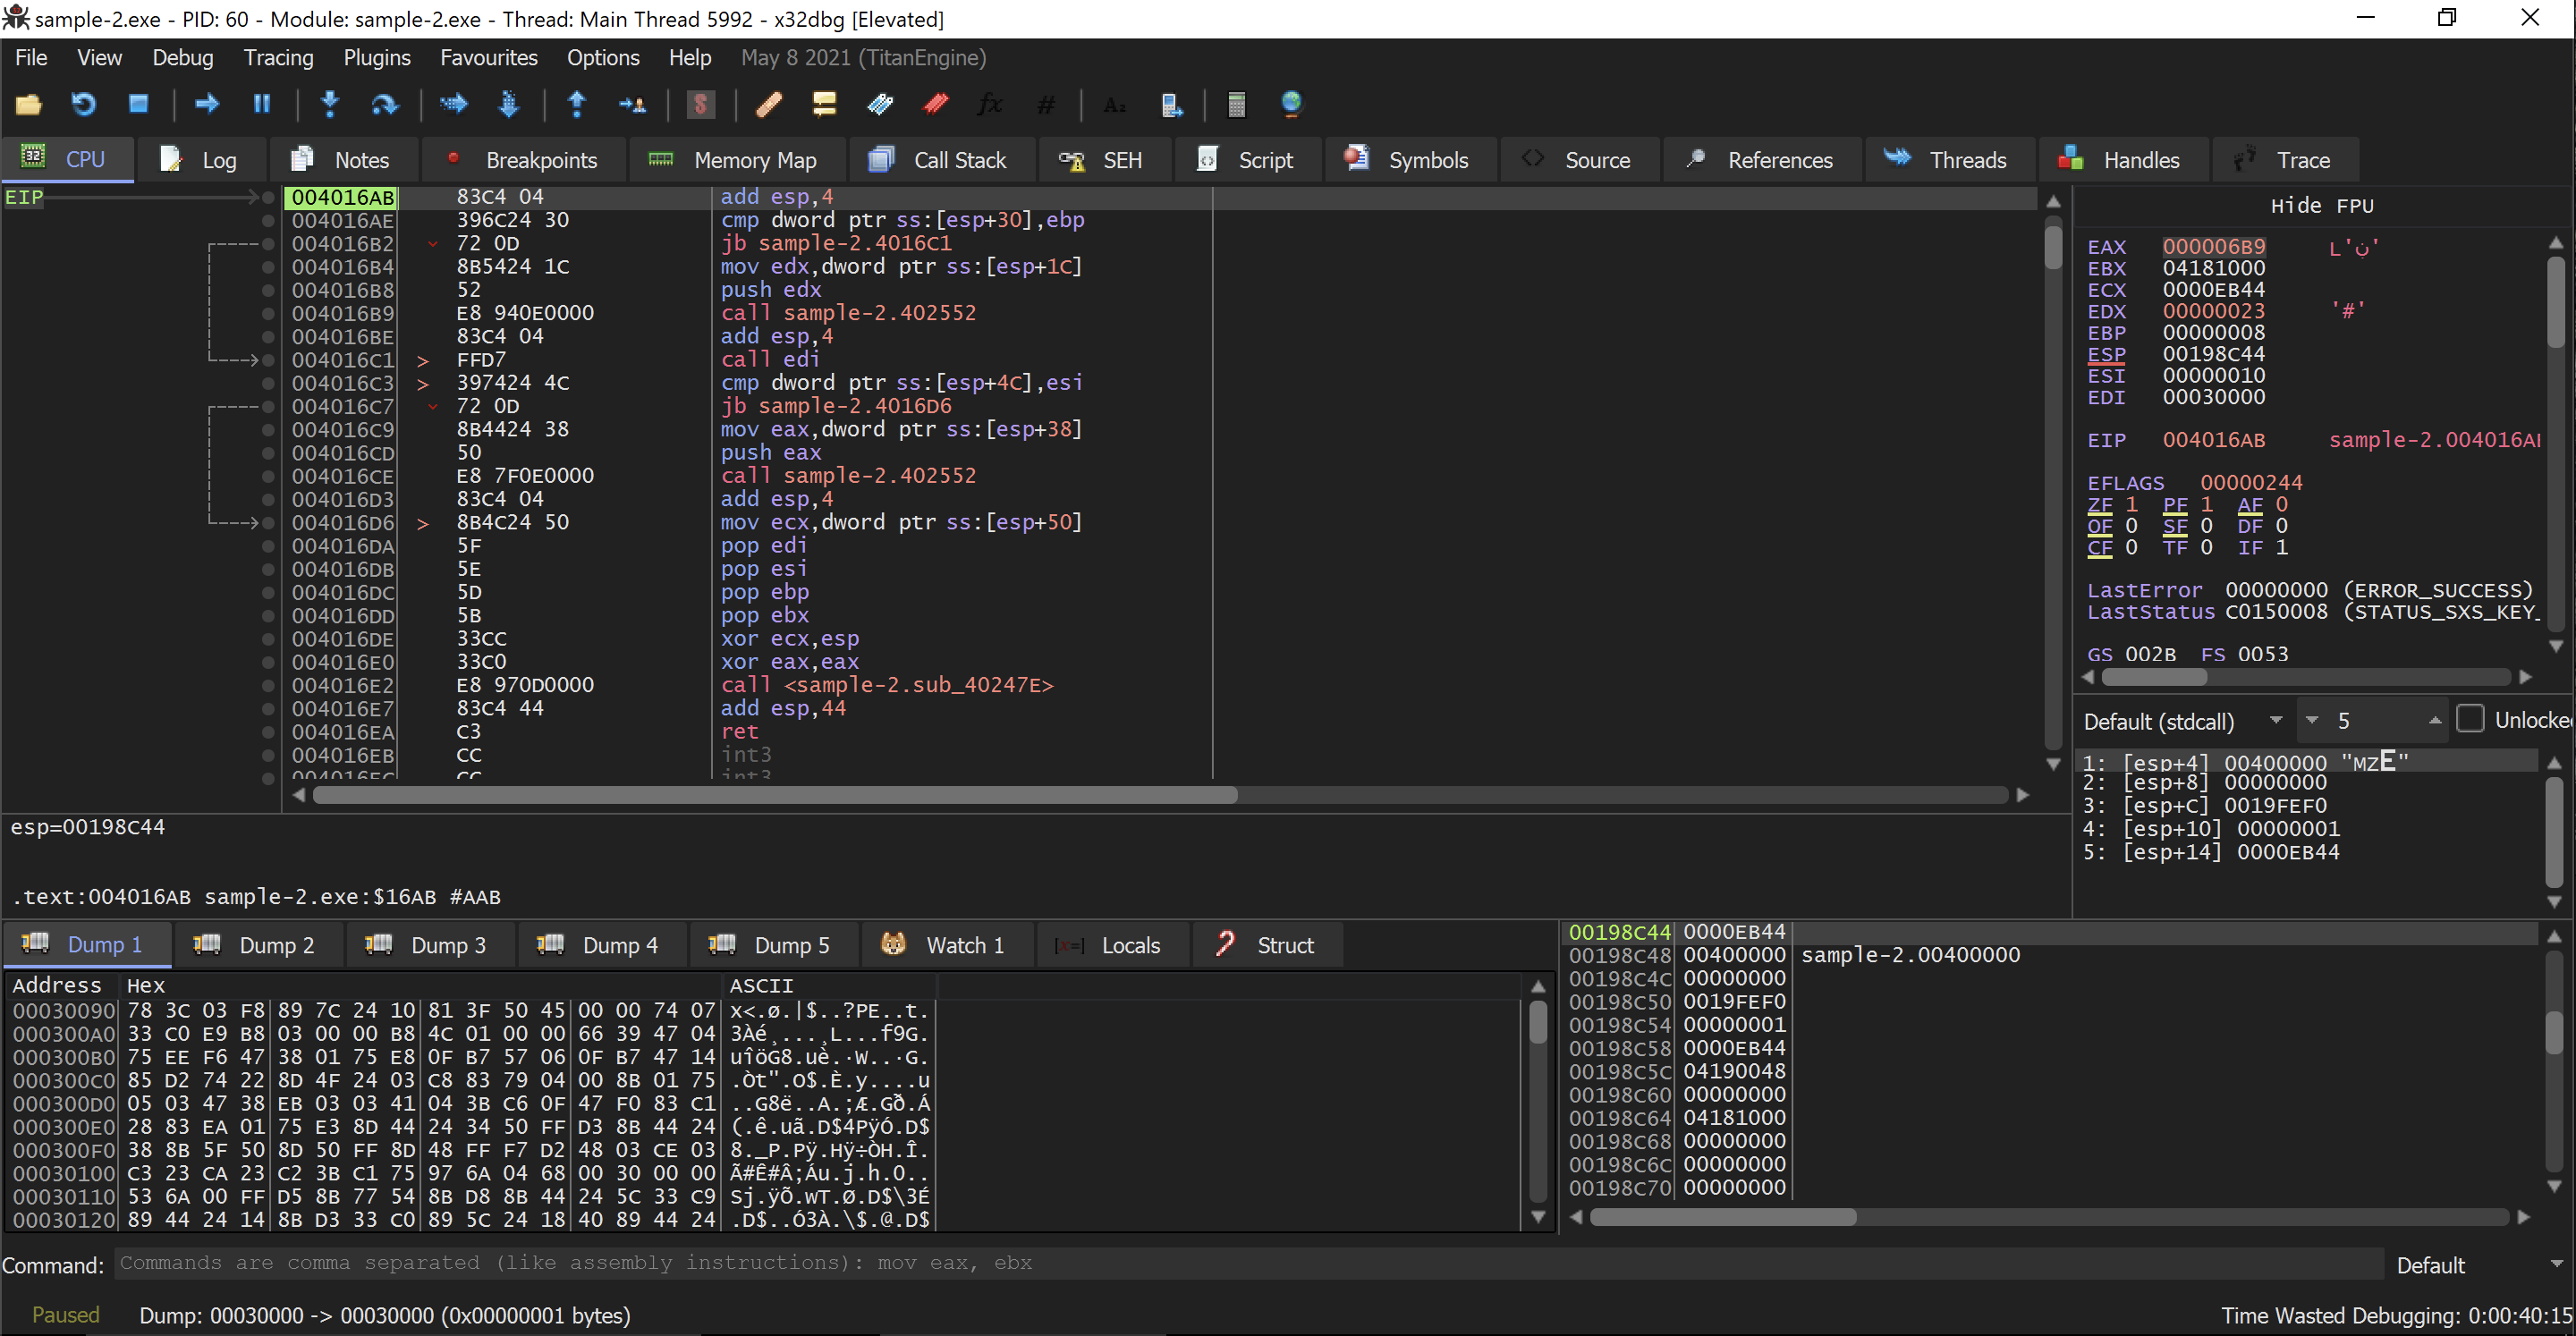
Now, if I proceed with running the program, I reach the VirtualProtect function.
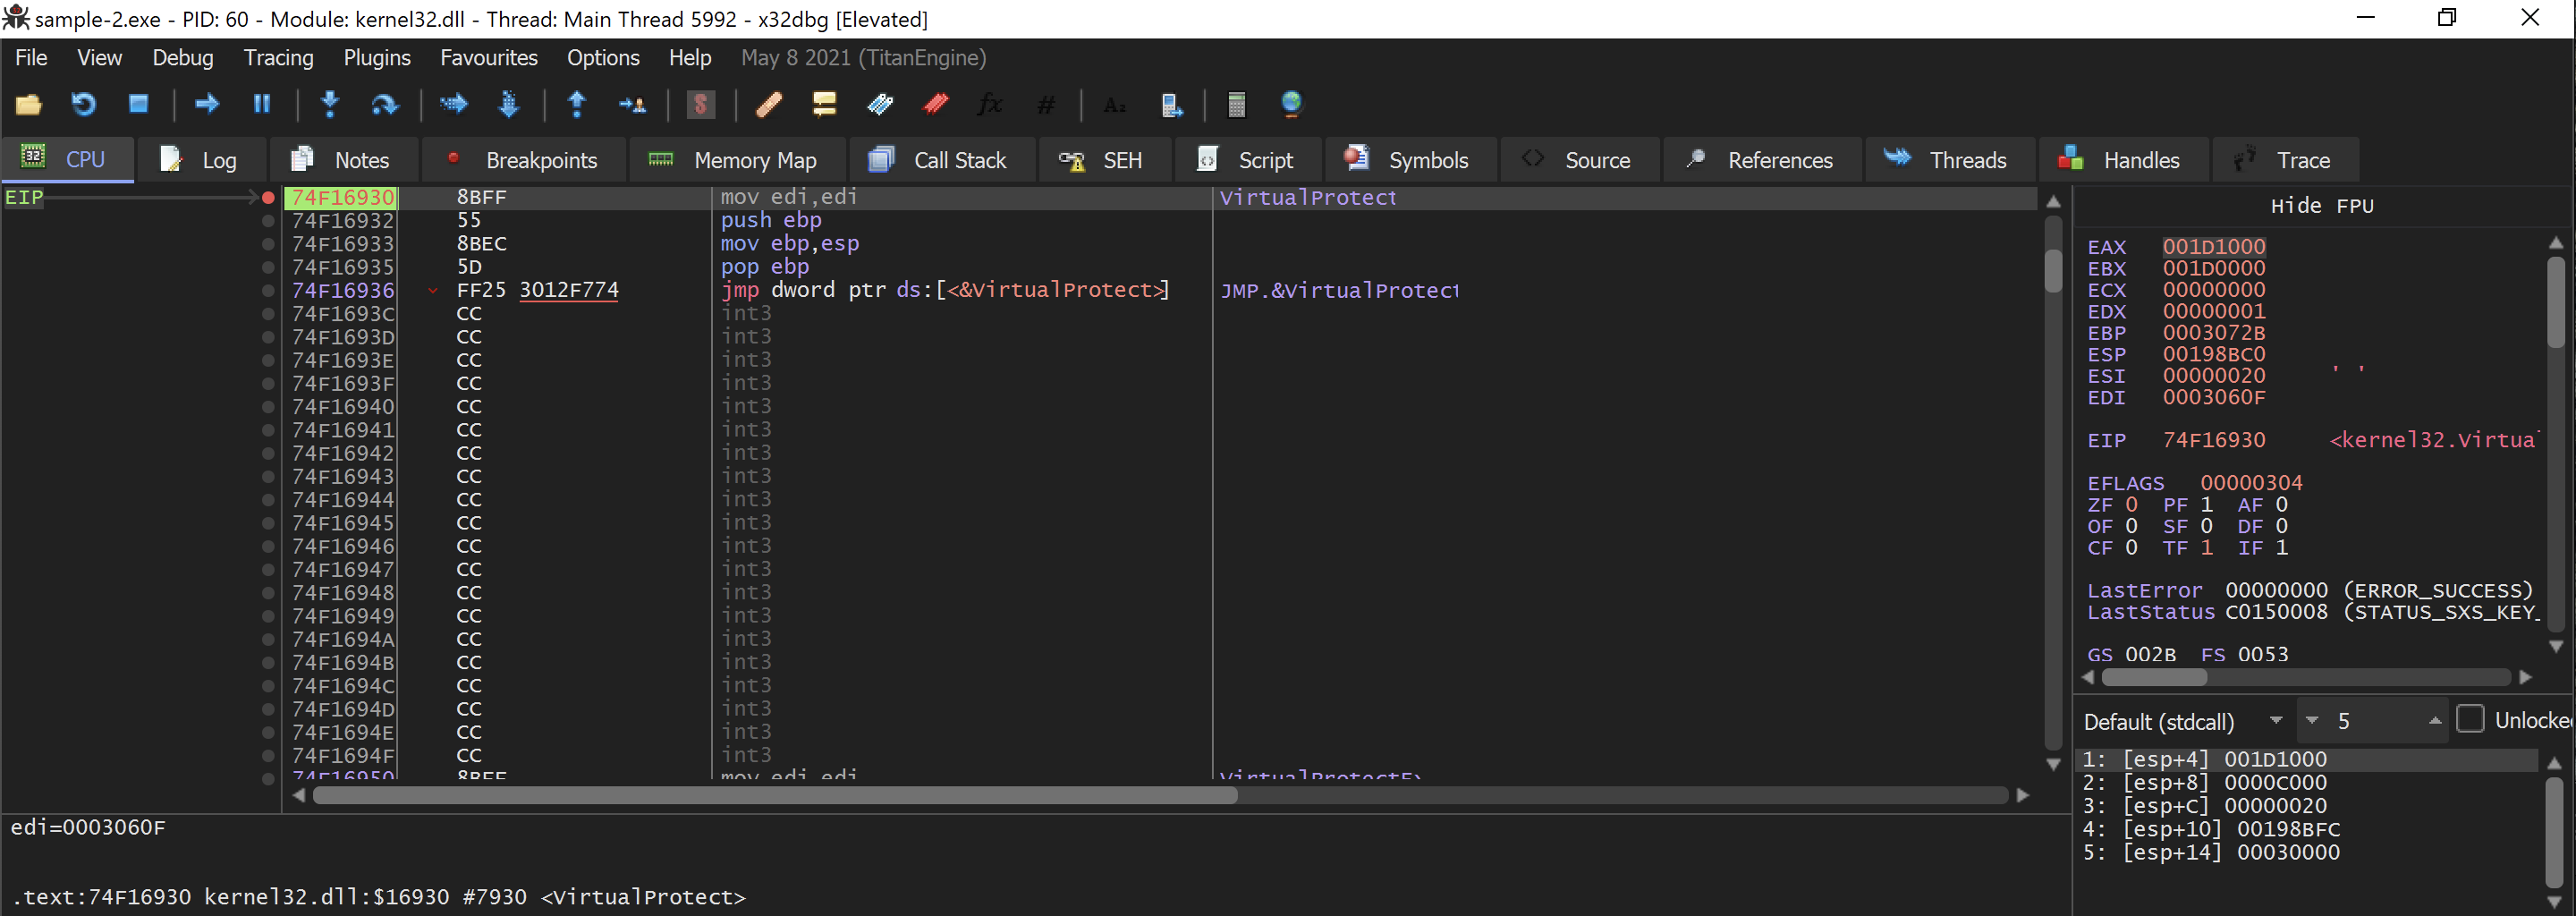
Arrived at virtualProtect conditional breakpoint
The fourth parameter of VirtualProtect contains a constant related to executable permissions; I can inspect the address in the first parameter to check for any code present.
I can follow the first argument of VirtualProtect in the dump.
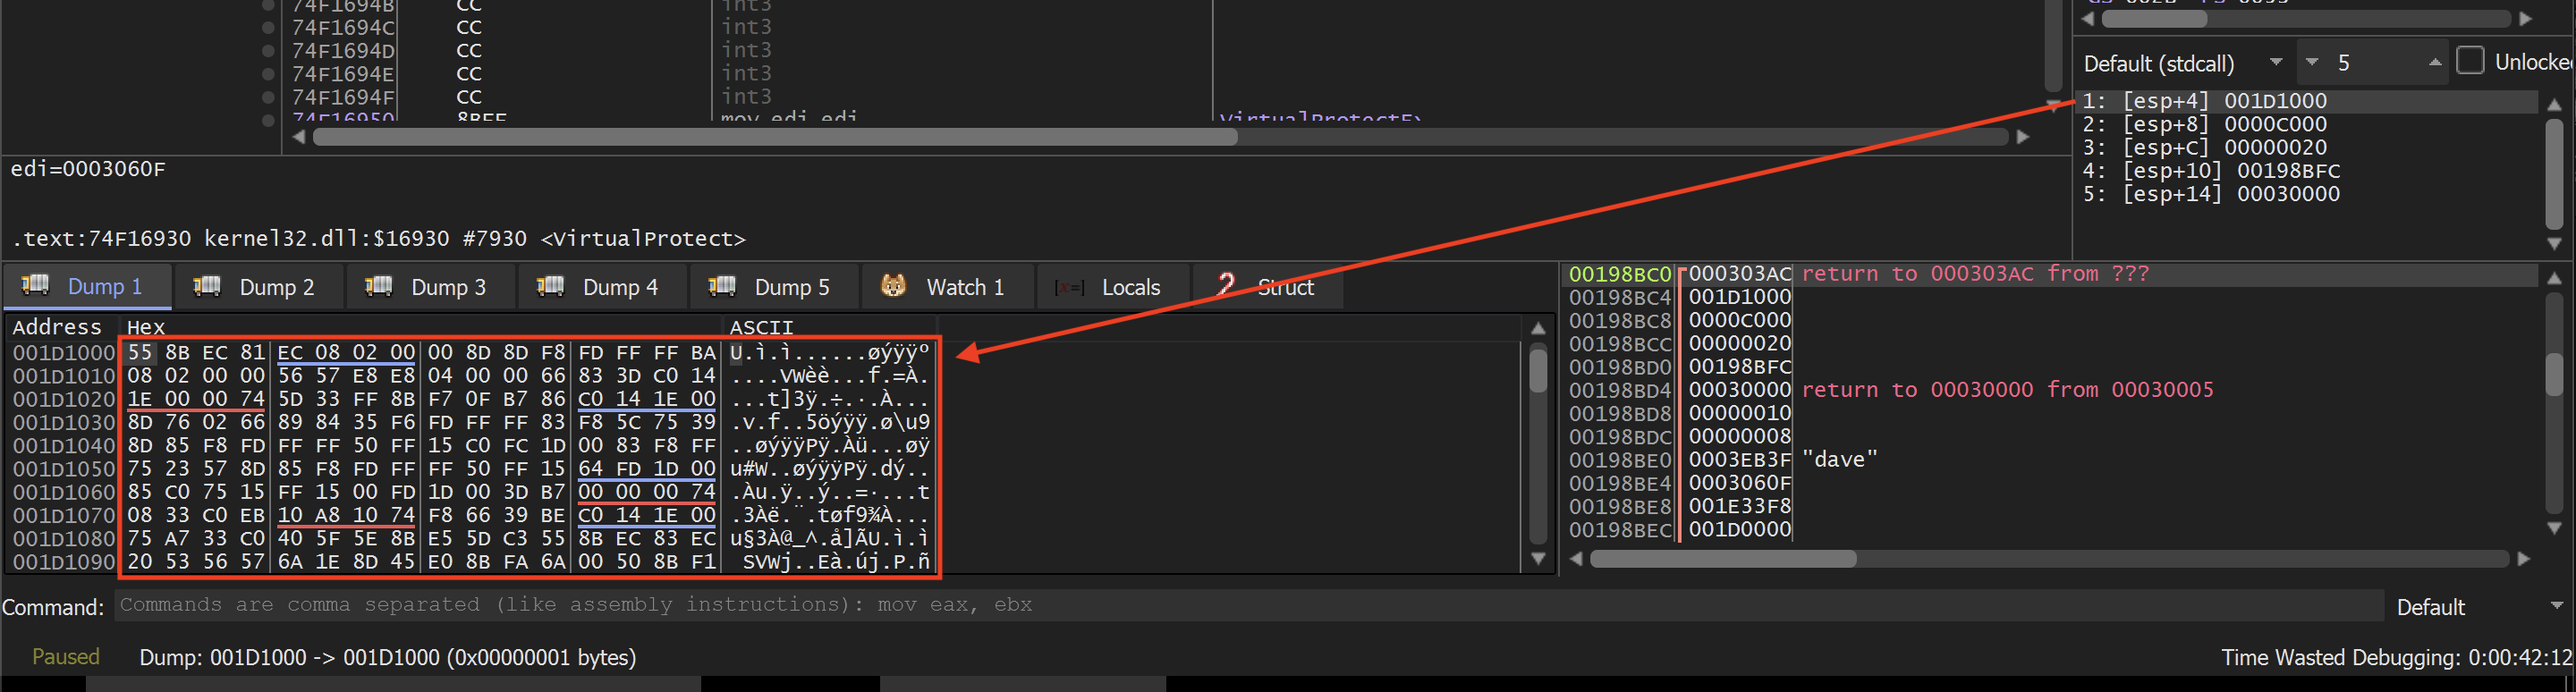
Following 1st argument of VIrtualProtect in dump.
A bit of experience or quick investigation would show that these opcodes relate to executable content. When I proceed with running the program at this point, it exits immediately. This meant I could narrow my attention to just the two stops at APIs dealing with executable permissions, rather than the original seven pauses I encountered using a standard breakpoint. As a result, I was able to swiftly locate the deobfuscated code, save it to disk, and carry out deeper analysis. I hope you found this article on leveraging conditional breakpoints for unpacking code and data informative and useful.