The program is read in by the packer. The packer creates the packed program is just data. then the executable part of the program now is unpacker.
The unpacker reads the packed program decompress it decrypts it whenever it has to do. and then creates a running program and runs it in the memory very much like a windows loader.
The entry point is also hidden. when a program runs it has a entry point.(It has to know which is the first instructions it need to run) For the packer side that too.
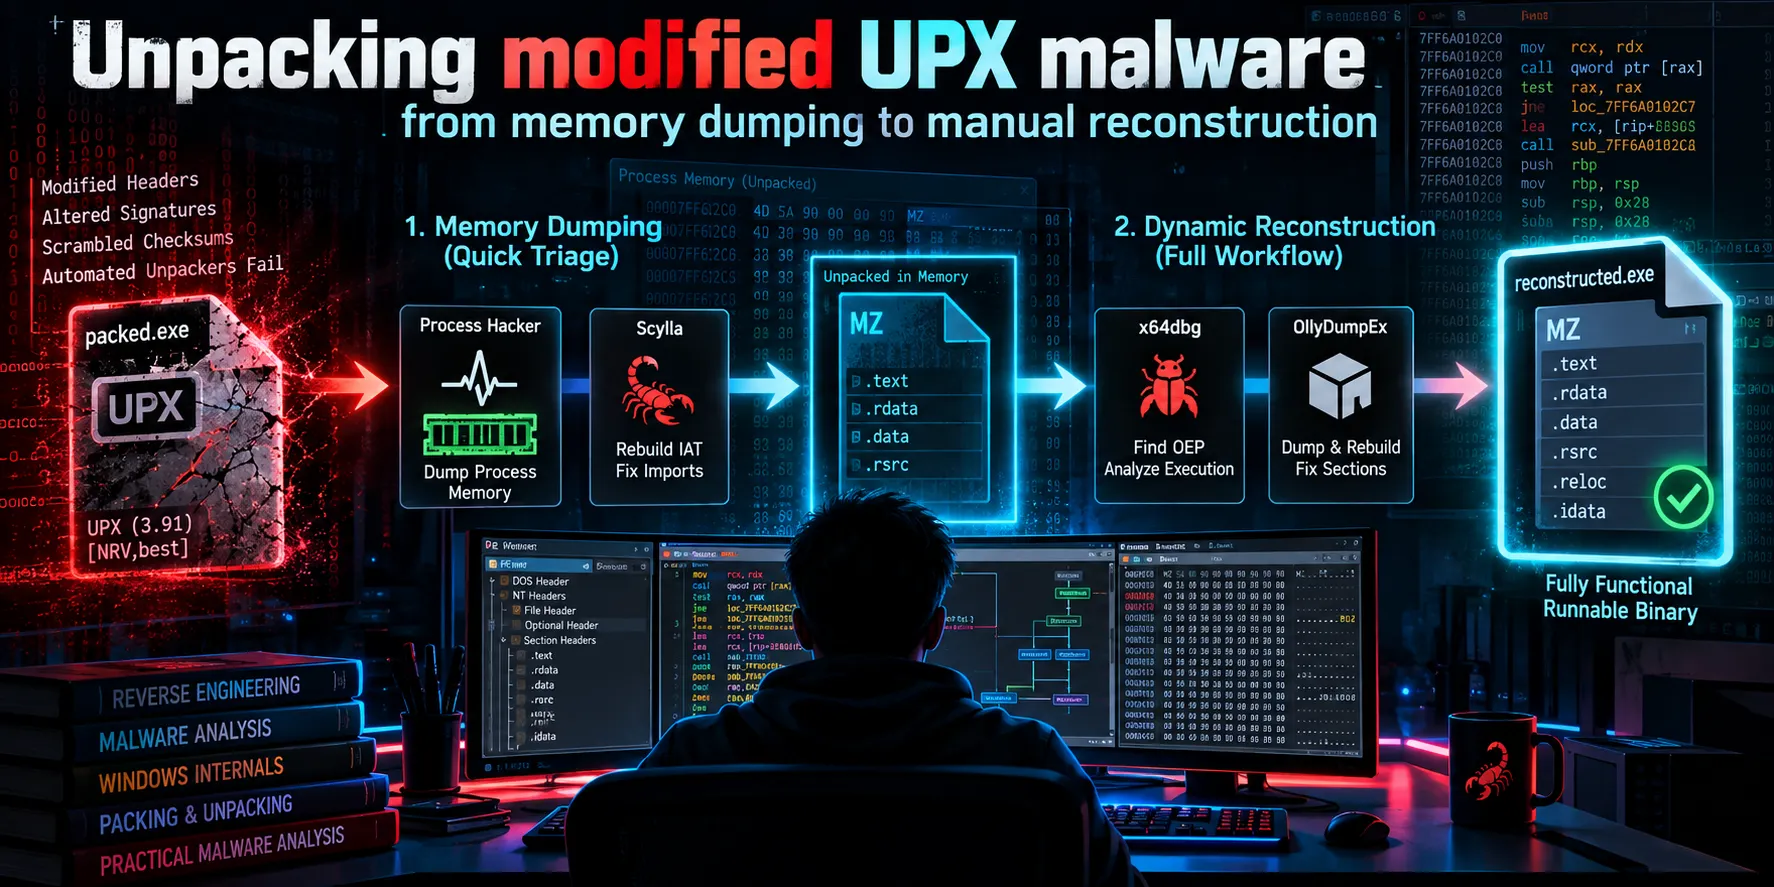
Packers conceal the original code and can hide some PE header values to further complicate the analysis.
Packers differ in techniques, sophistication, and the protection they provide.
UPX
Malware authors have many options for packing executables.
We'll analyse UPX packed sample, which is free and common. It's relatively simple to unpack.
Numerous other packers exist. They tend to be more complex than UPX.
Most packers don't include built-in unpacking capabilities.
How do you identify if the sample is packed
If possible, try to identify the packer to research it and look for unpacking tips.
You can tell that the executable might be packed if:
Several tools can check entropy and attempt to identify the packer by its signature.
Consider the packed version of brbbot named as packed.exe How would you be able to tell that it might be packed?
Let’s start our analysis
SAMPLE Metadata
| Property | Value |
|---|---|
| MD5 | c6a4535a37f6adeac107b22d9d1220ba |
| SHA-1 | fbcb05e331d91cdca0bd1410bead0d2e91c18e5d |
| SHA-256 | f9227a44ea25a7ee8148e2d0532b14bb640f6dc52cb5b22a9f4fa7fa037417fa |
| Vhash | 03403e0f7d1019z6nz11z11z17z |
| Authentihash | e5ca26d19aeac660396cc281326a3de15a327f850eec56c3a4407115d8f72b74 |
| Imphash | 49471bd8fd2a676bd59403175df5f7d9 |
| Rich PE Header Hash | fd91dc4cd503f43dc67277c081b15ccb |
| SSDEEP | 768:T/at+/UnTeesPcQaxXVphhygESmU/MdeupNpaursy:T6+8ncPgVphhwSmPeupD9rsy |
| TLSH | T1ABF2F176F5878F01CC1D637E63939FD192A93AE08205AB74560E120B3A96DA76CCA291 |
| File Type | Win32 EXE |
| Tags | executable, windows, win32, pe, peexe |
| Magic | PE32+ executable (GUI) x86-64, for MS Windows |
| TrID | Win16 NE executable (generic) (38.3%)<br>Windows Icons Library (generic) (15.6%)<br>OS/2 Executable (generic) (15.4%)<br>Generic Win/DOS Executable (15.2%)<br>DOS Executable (generic) (15.2%) |
| Detect It Easy (DIE) | PE64<br>Packer: UPX (3.91) [NRV,best]<br>Compiler: Microsoft Visual C/C++ (16.00.30319) [LTCG/C++]<br>Linker: Microsoft Linker (10.00.30319)<br>Tool: Visual Studio (2010) |
| Magika | PEBIN |
| File Size | 36.00 KB (36,864 bytes) |
PE studio
This packed sample reveals very few statically characteristics in PE studio.
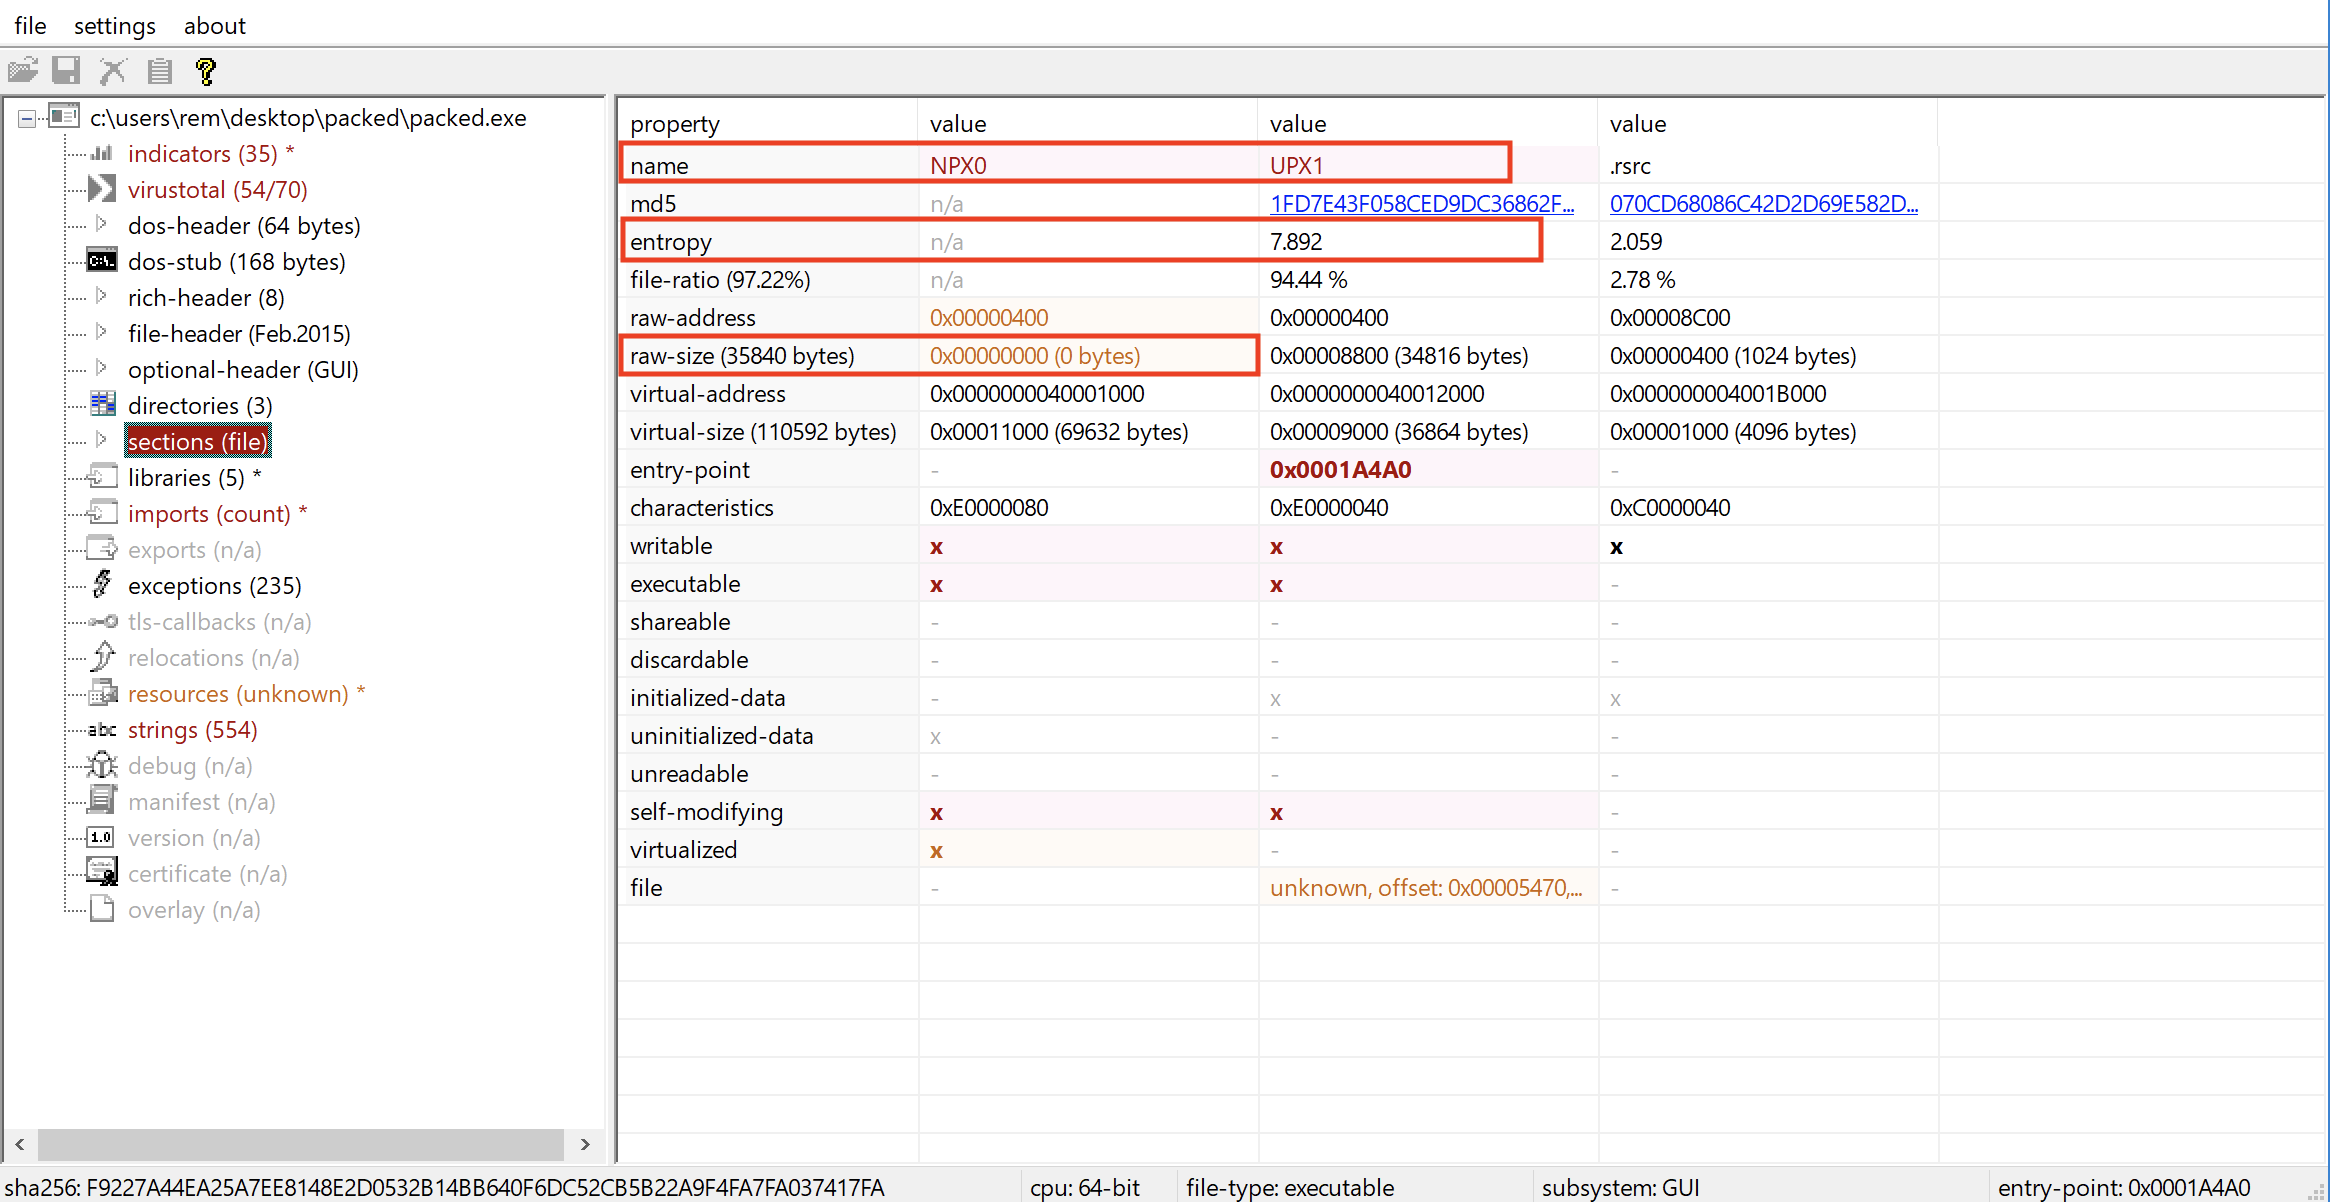
PE studio - sections
You maybe wondering why raw size is circled.
The raw size is the amount of space, that section takes on disk.
Virtual size is how much space it’s going to take in memory. in our case the virtual size is 0x00011000 (69632 bytes) . Then we have unusual names like NPX0, UPX1 .
Also there are very few imports in this sample.
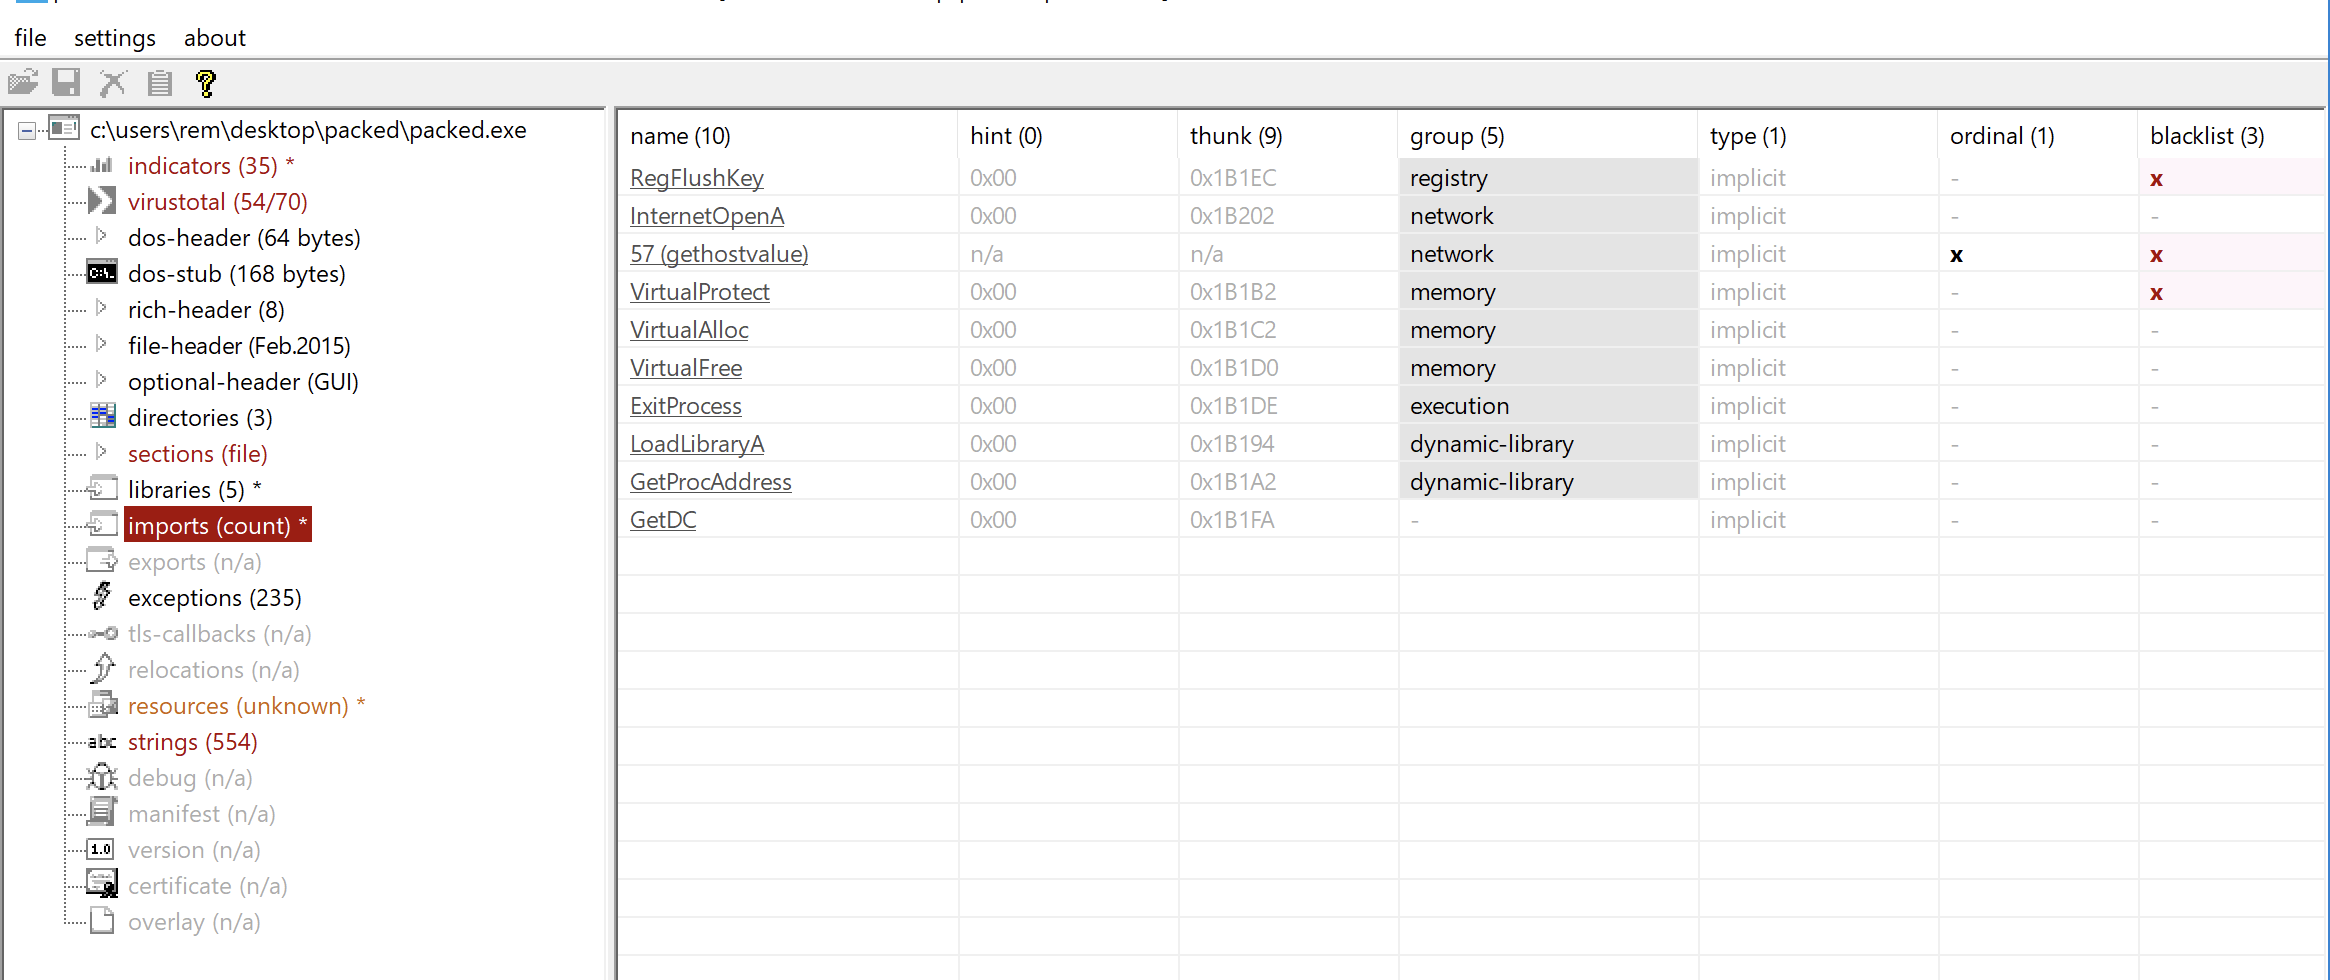
Pe studio - imports
Sample containing UPX strings.
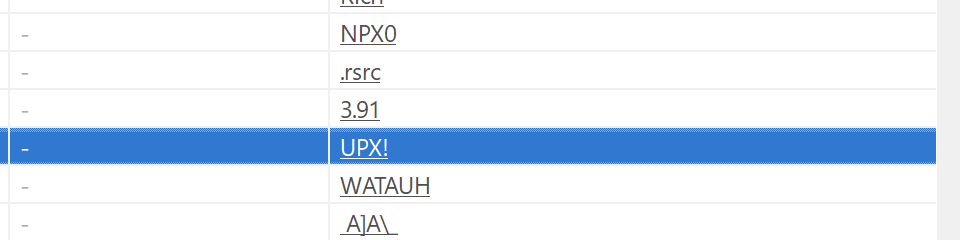
Pe studio UPX strings
There are couple of other tools to try like Detect it easy, EXEinfo and diec.
detect it easy identifying UPX packing for the sample.
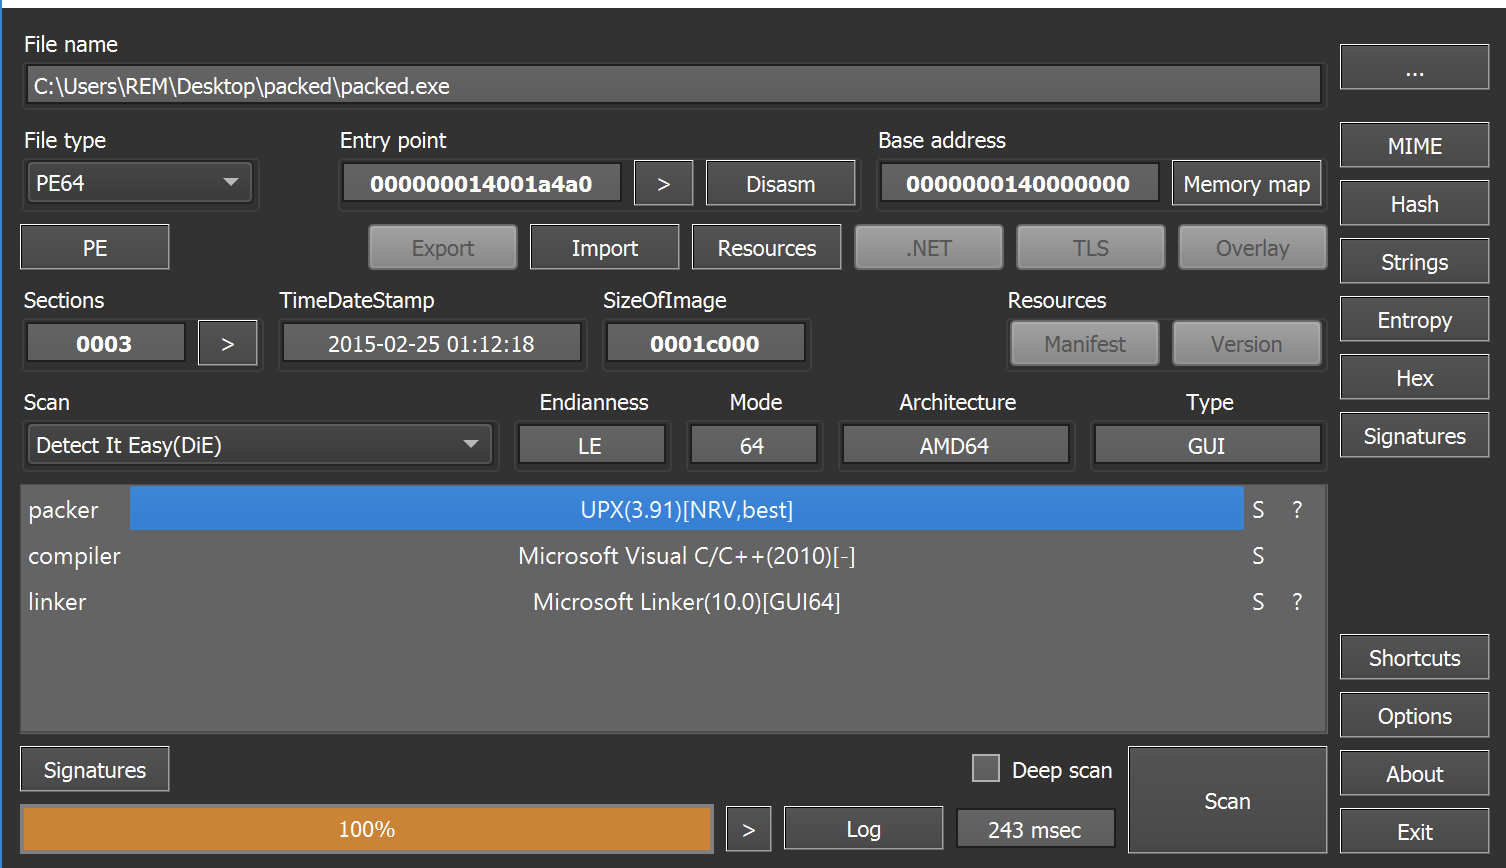
DIE
Detect it easy showing that the sample is packed with the entropy of 7
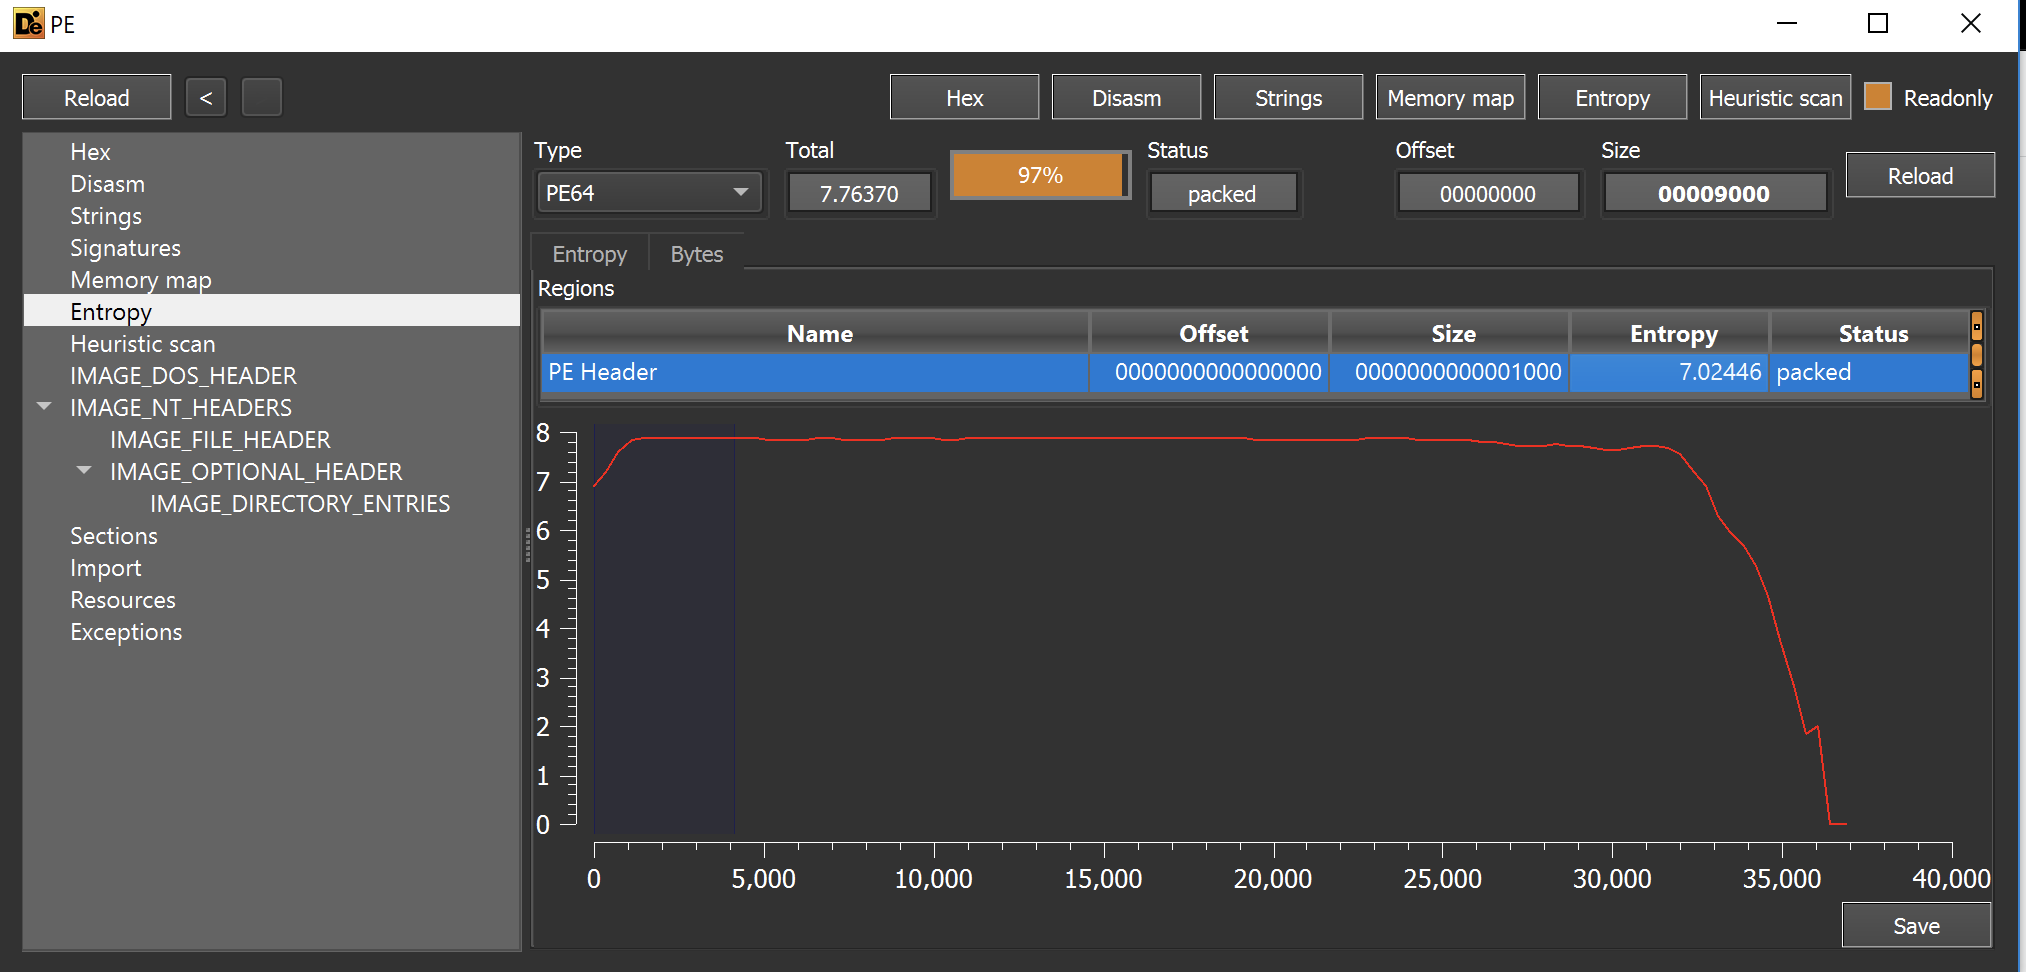
DIE - entropy showing
Add this to the list of thing before doing static analysis.
Usually, UPX can automatically unpack the file it generated, but the tool struggles with our sample.
here you can see when we tried to unpack the sample using upx it did failed to unpack it.
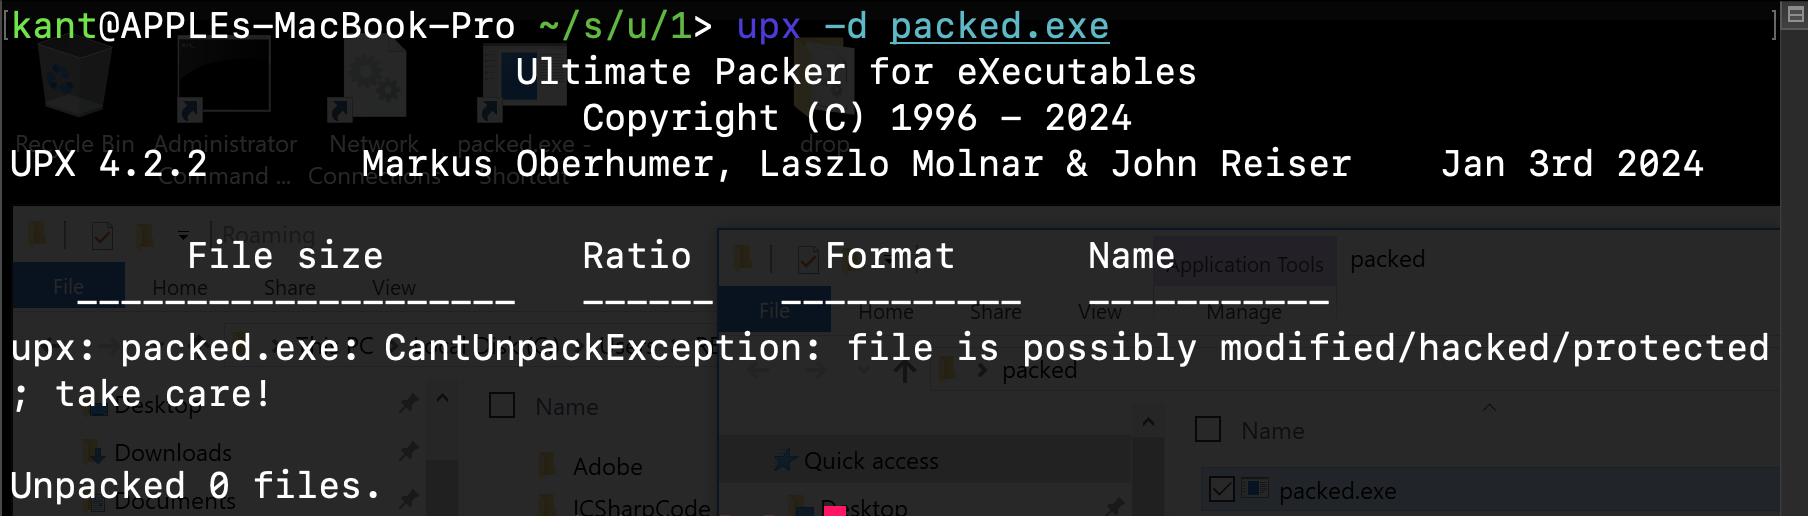
tried to unpack using upx but it failed.
So what can we do……
In a Windows Portable Executable (PE) file (.exe or .dll), the Image Base is the preferred virtual memory address where the Windows loader wants to load the executable.
Think of it as the program's preferred starting address in memory.
Our sample’s image base is 0x0000000140000000 .
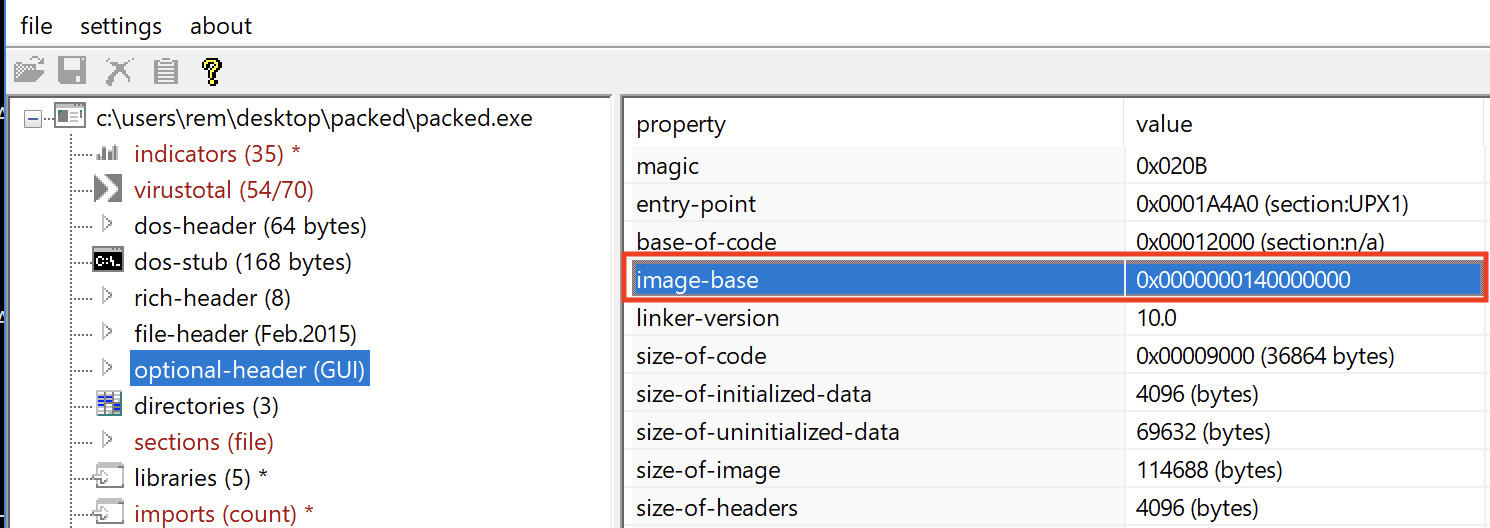
Image base in pestudio
Before trying to unpack the specimen, disable ASLR.
What is ASLR
ASLR (Address Space Layout Randomization) is a security feature in Windows (and other operating systems) that randomizes where a program and its components are loaded into memory each time they run.
Its goal is to make it much harder for attackers or malware exploits to predict memory addresses.
You can disable ASLR on a per-file basis:
You can use a PE editor such as CFF Explorer to do this.
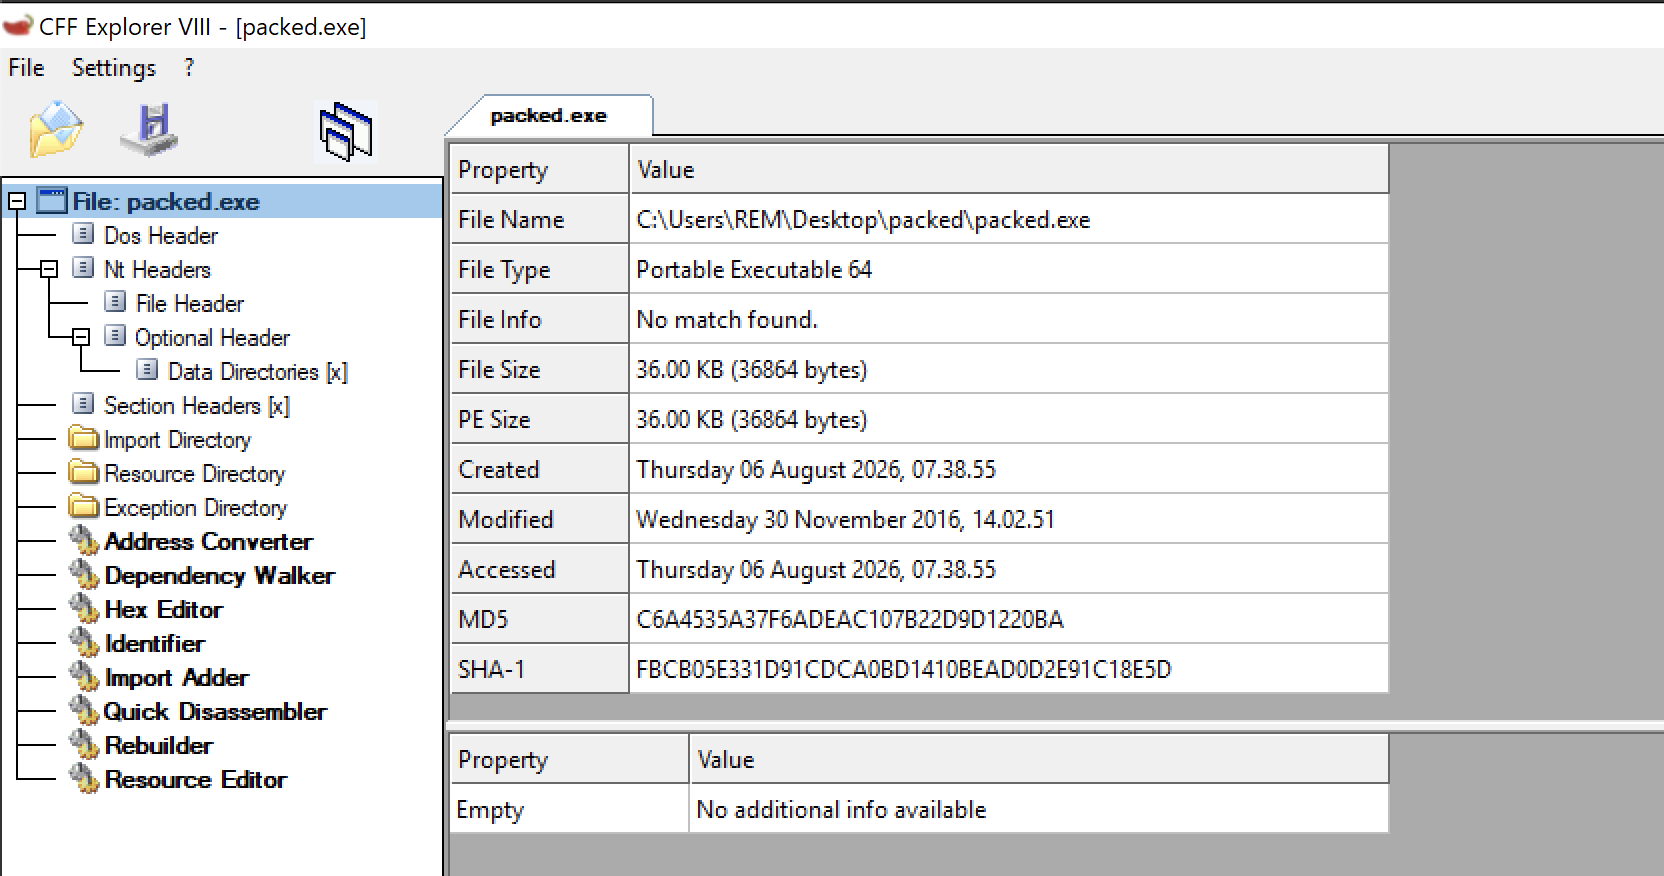
sample loaded in CFF explorer
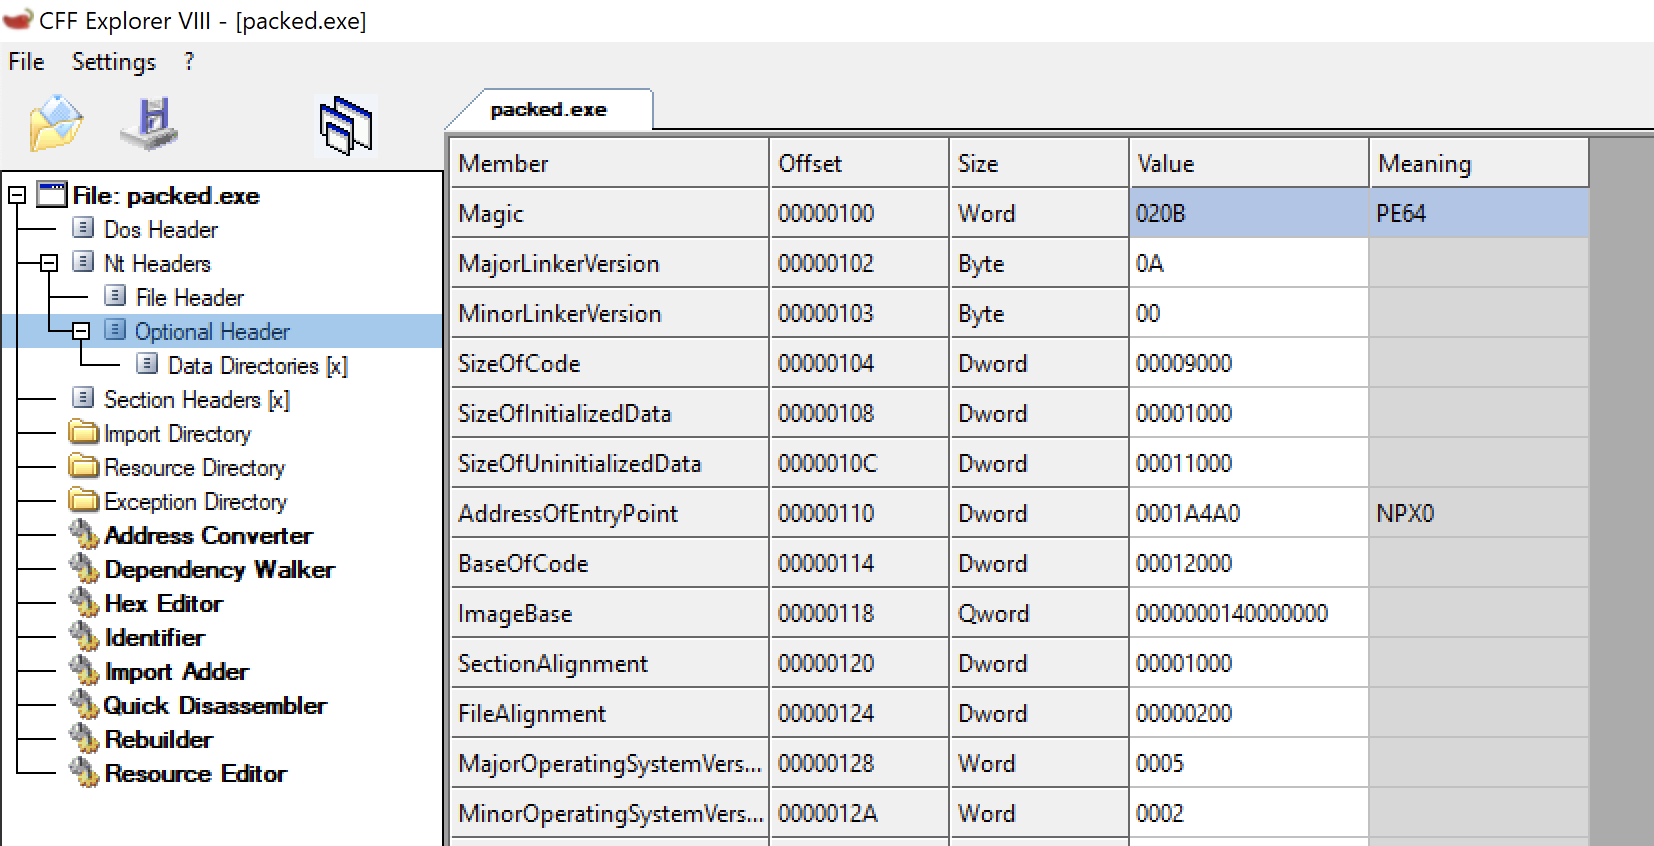
Optional Header
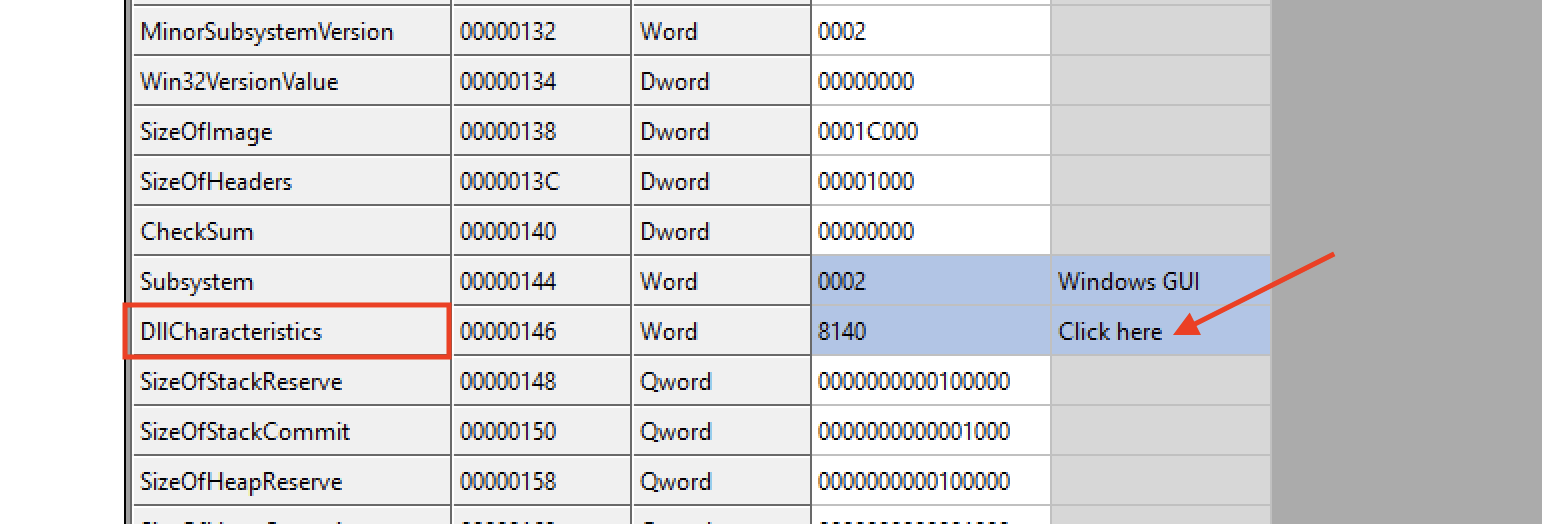
DLLCharactersitcs - Click here
It’s DLLCharactertics that’s because Originally dll’s would have ASLR, Executable would have not. And then microsoft changes so both could have it.
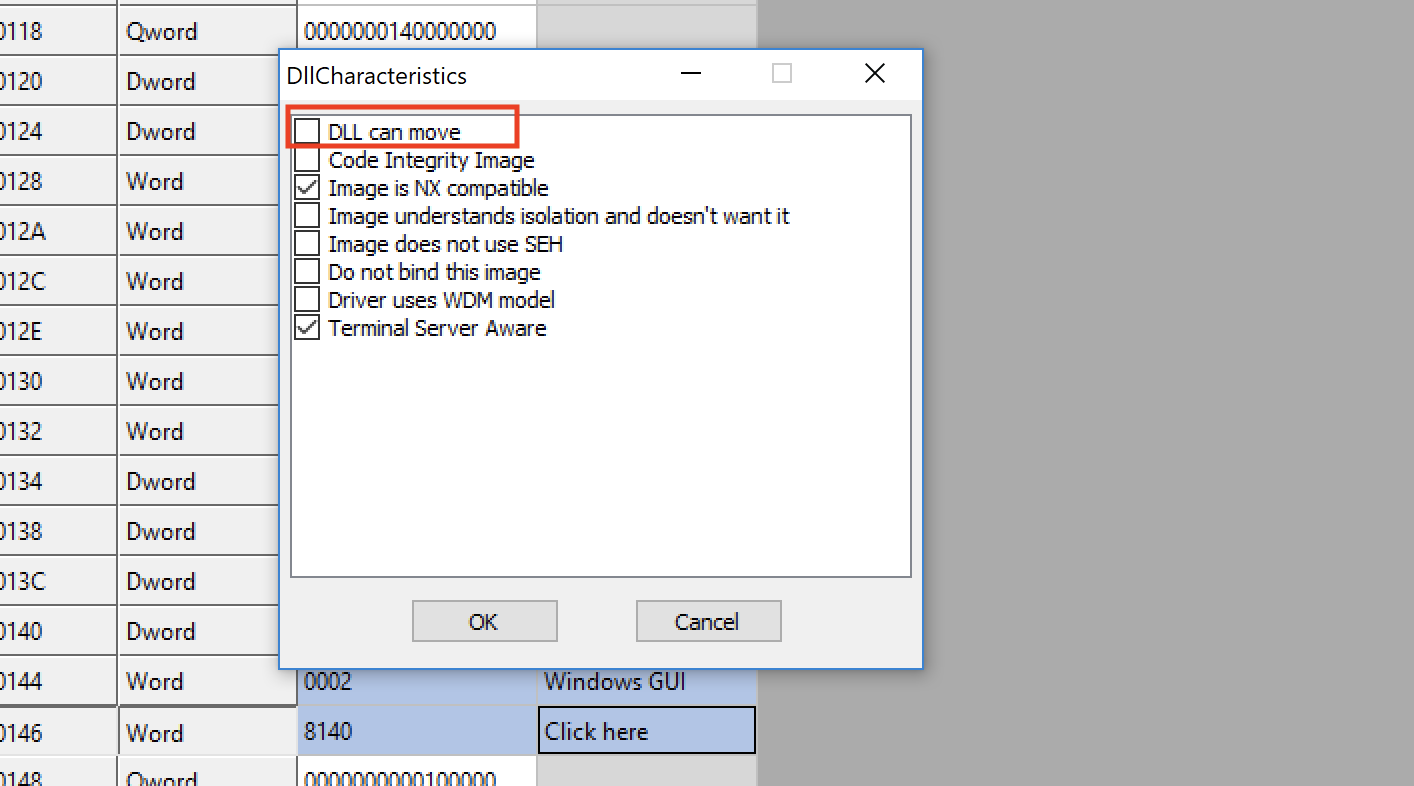
Uncheck DLL can move
That’s only change you need to make changing one bit
An alternative is to use the command
setdllcharacteristics -dNow we are going to run the sample this going to seem weird but open up process hacker first. and run the sample.
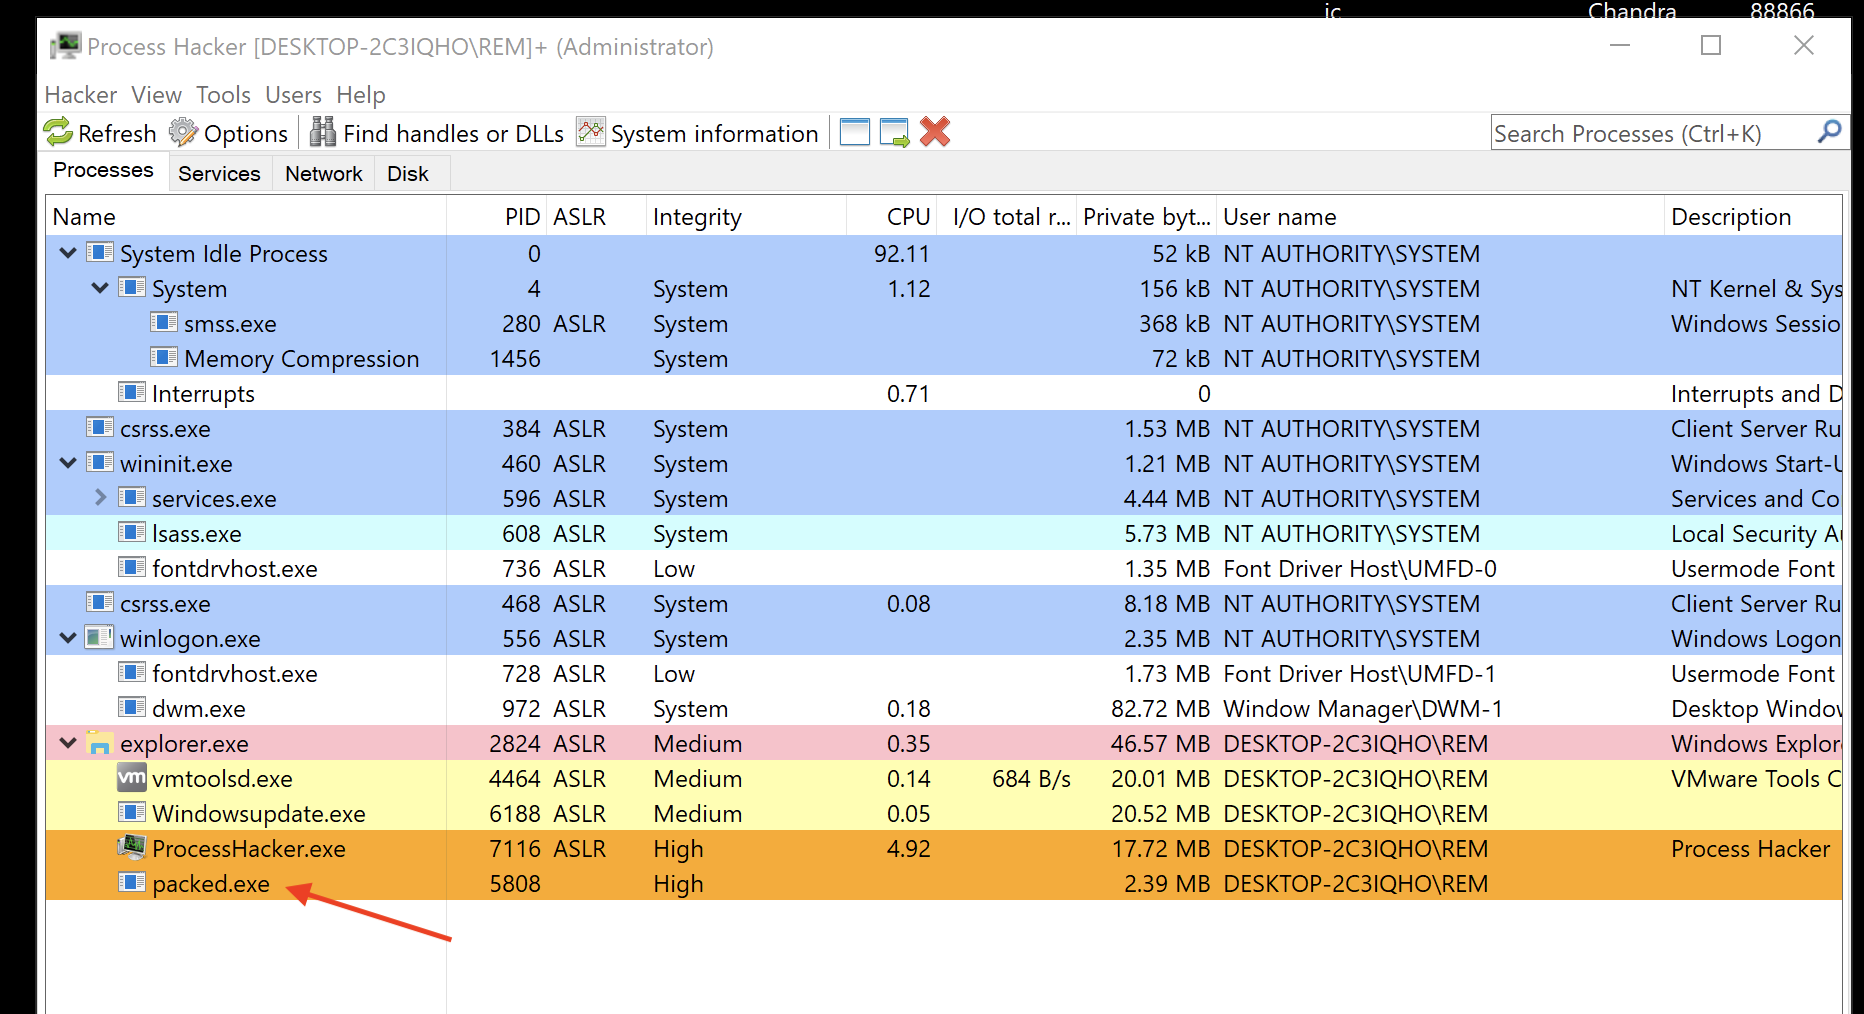
Process hacker - packed.exe running
The theory is because it’s running it had to be unpacked already. Cannot be running in a packed form.
Double click on the process of the sample in process hacker.
How can we confirm if something is unpacked What do we look for?
we look for strings.
Click on the memory tab then strings.
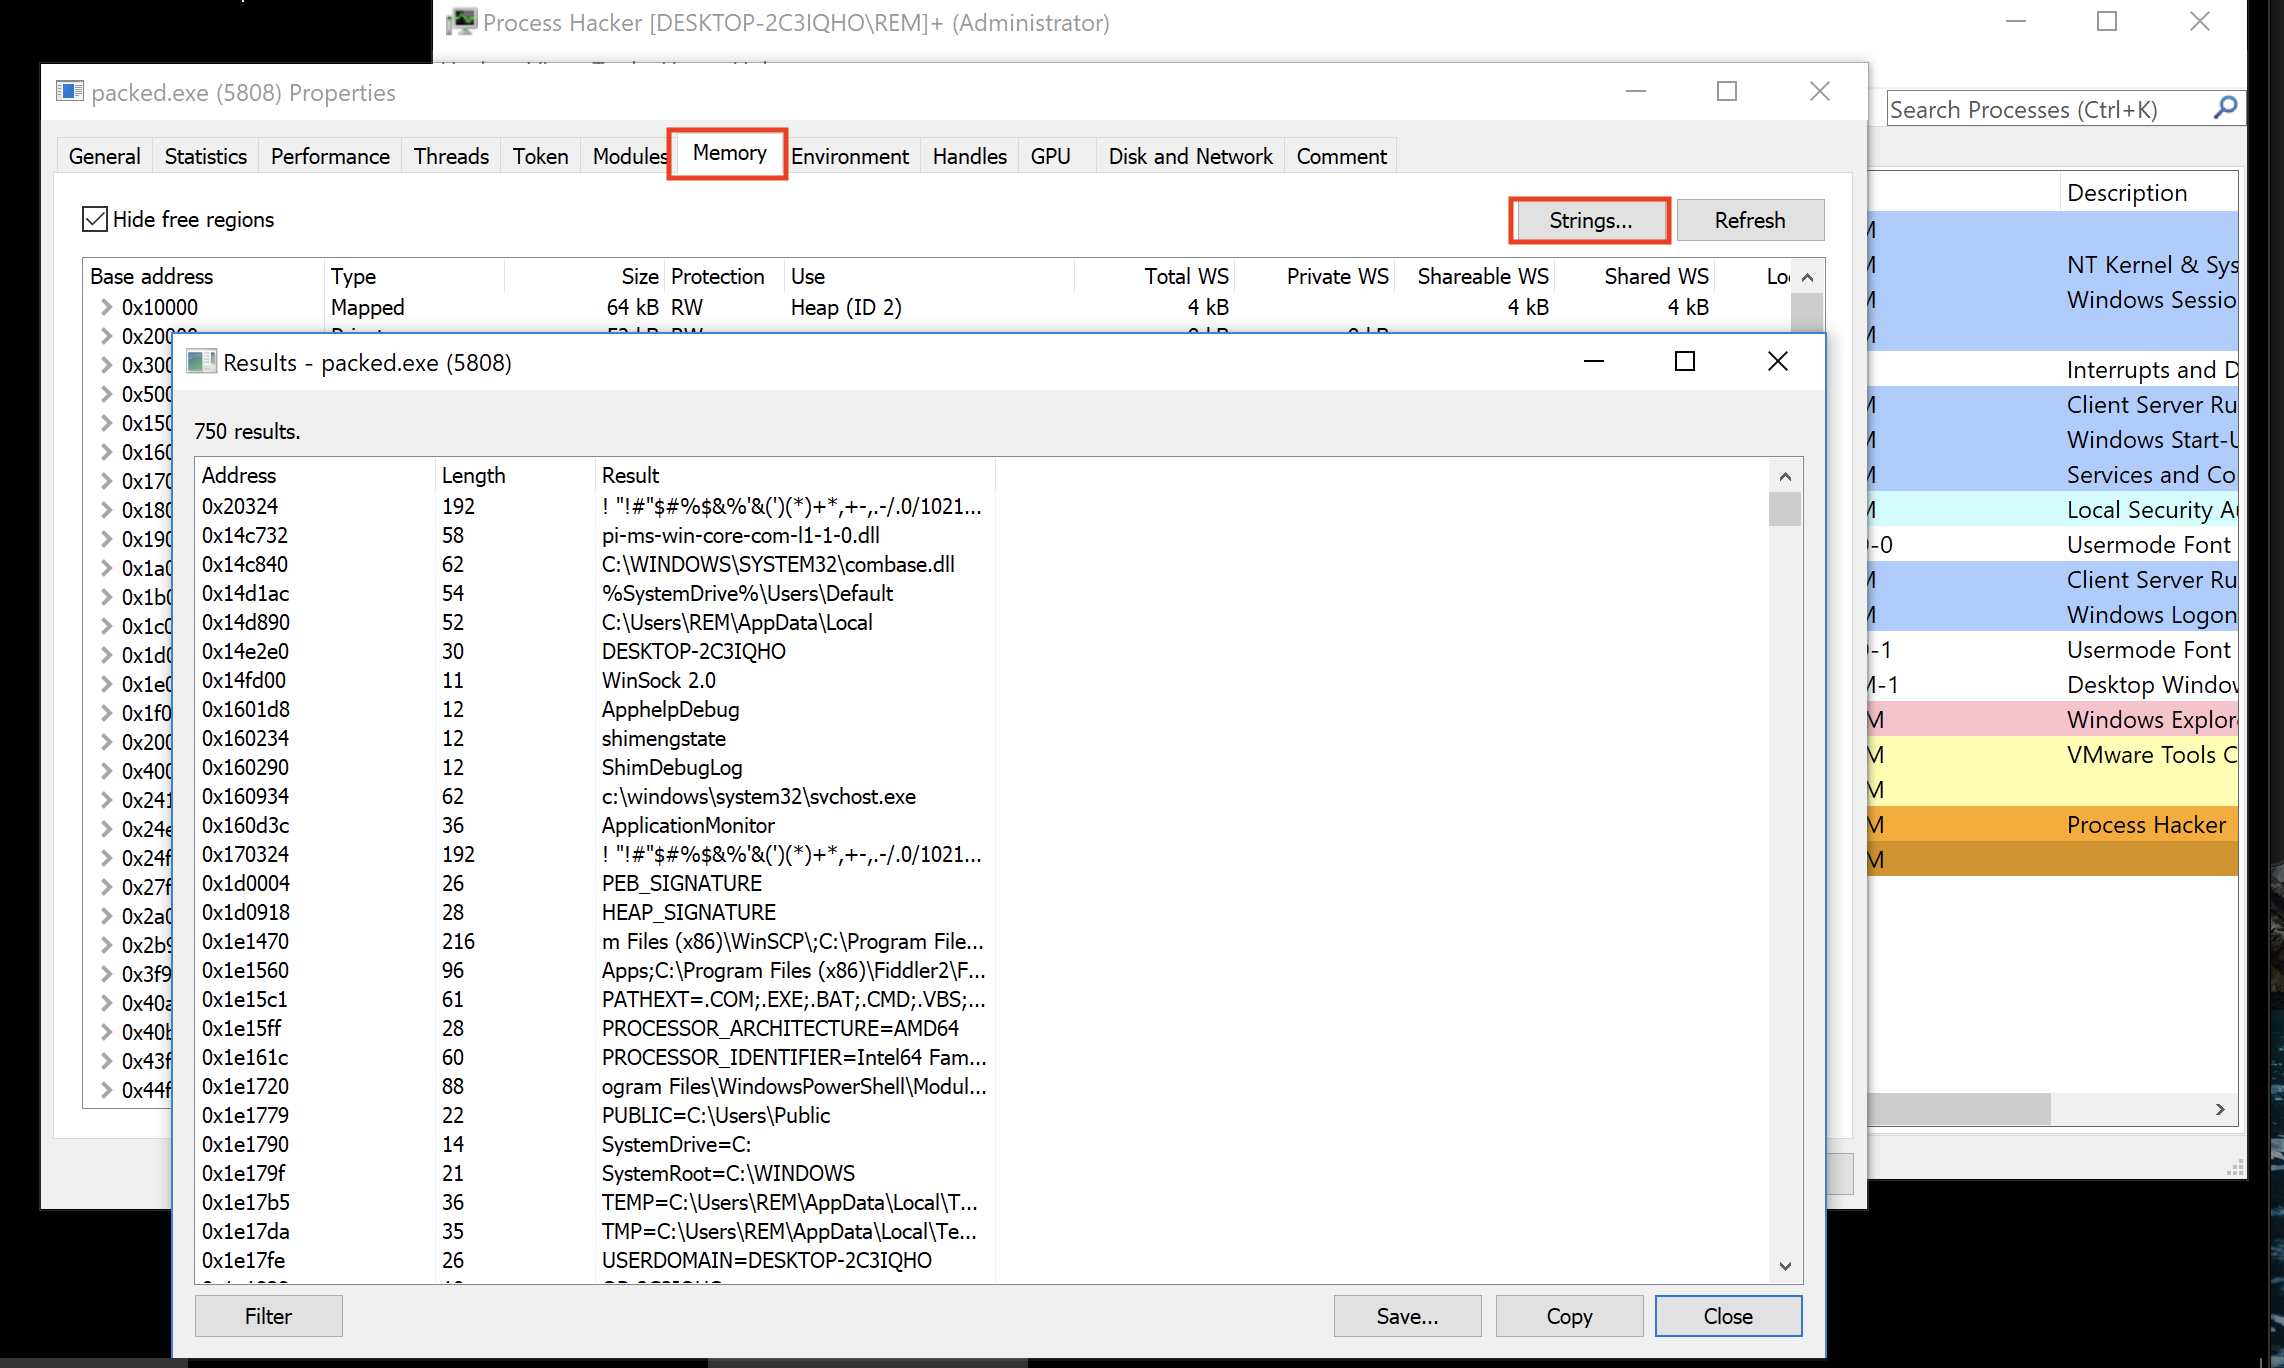
Strings
There’s lot more strings than we use to see because these are loaded in dynamically. They are from the environment.
Scroll down to the bottom you will find a domain brb.3dtuts.by .
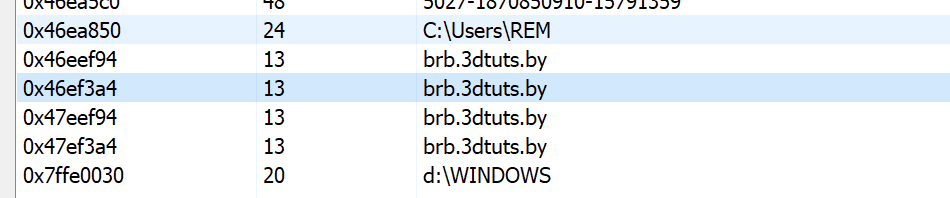
Strings containing a domain.
There are lot of strings which are disperse but it is proof that it was unpacked.
So if it’s memory and not packed how can we dump it out of memory.
Couple of things you need to know
When a program is loaded into memory, It puts into different parts of the memory because on disk disk have 512 byte sector memory is 4k pages(4096-byte) so it had to do some maneuvering so the executable run.
Though there are program that helps us to take out of memory and put it on disk in disk format. the program we are going to use is Scylla.
this is sample is 64 bit so we will use Scylla x64.
Let’s do it ………
Open Scylla and attach the sample process in scylla. even though the program is running.
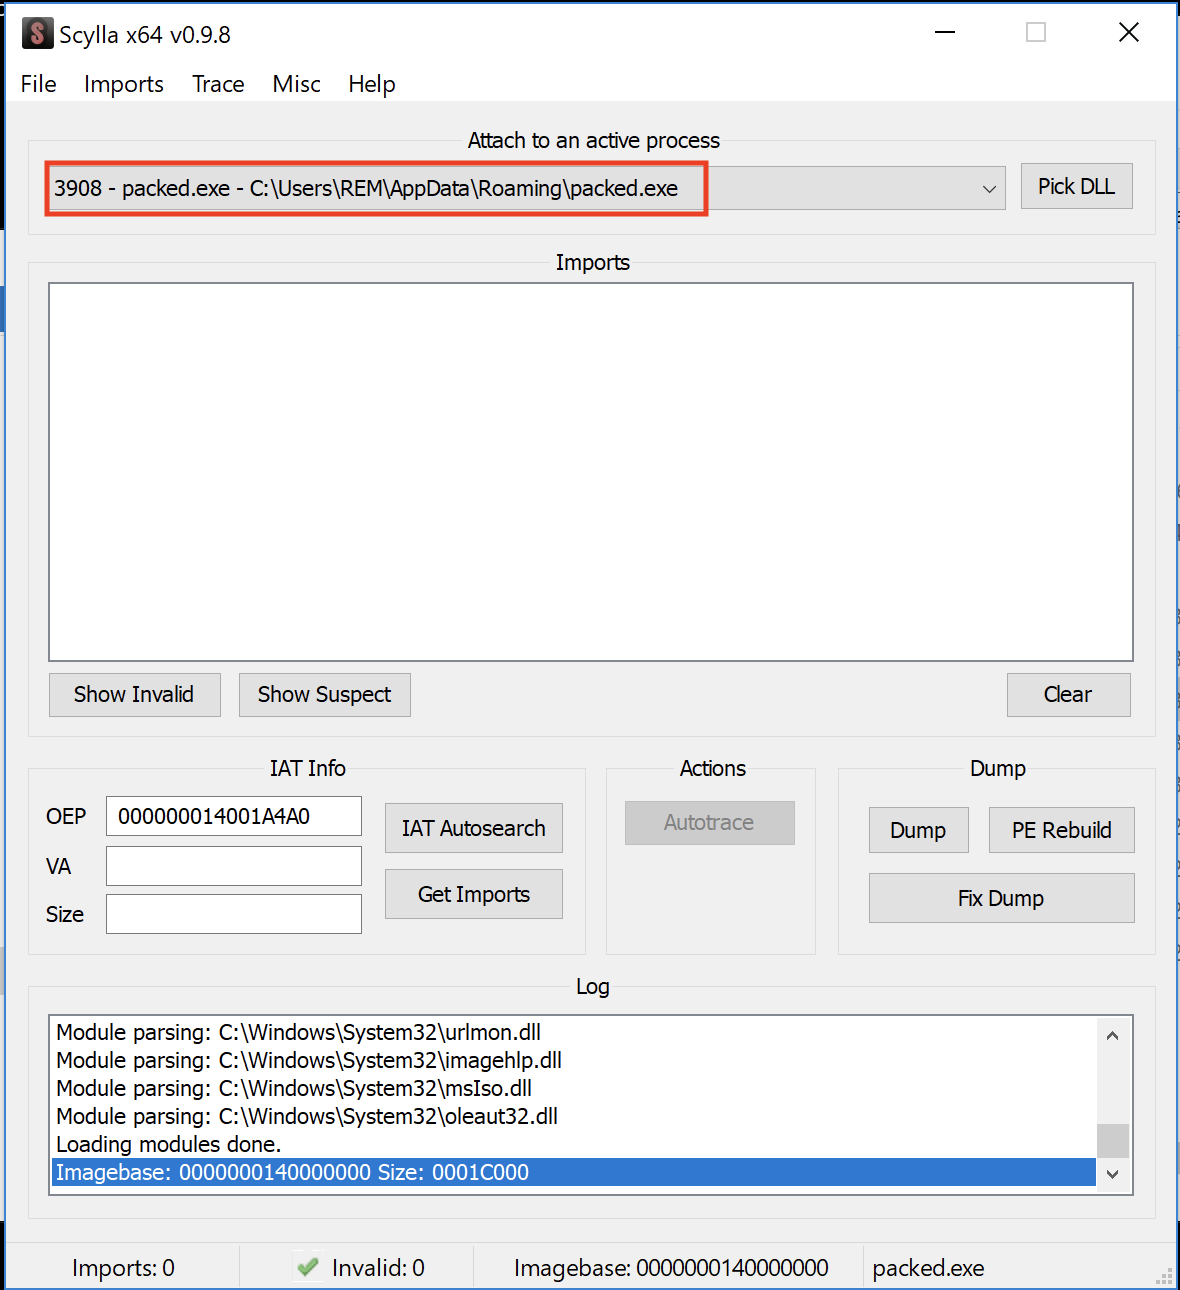
Attaching the sample process in scylla.
Once attached the sample process In the bottom we’ll see a log window.
Now we need to click on IAT Autosearch . The Import address stored differently on disk than memory. then we have click imports to get those imports and then we have to fix the dump Fix Dump . But we don’t have any dump yet. we need to dump it in the disk first.
So Dump will be the first step then well do the rest of the steps.
Click on dump. it automatically names the file packed_dump.exe now click save.
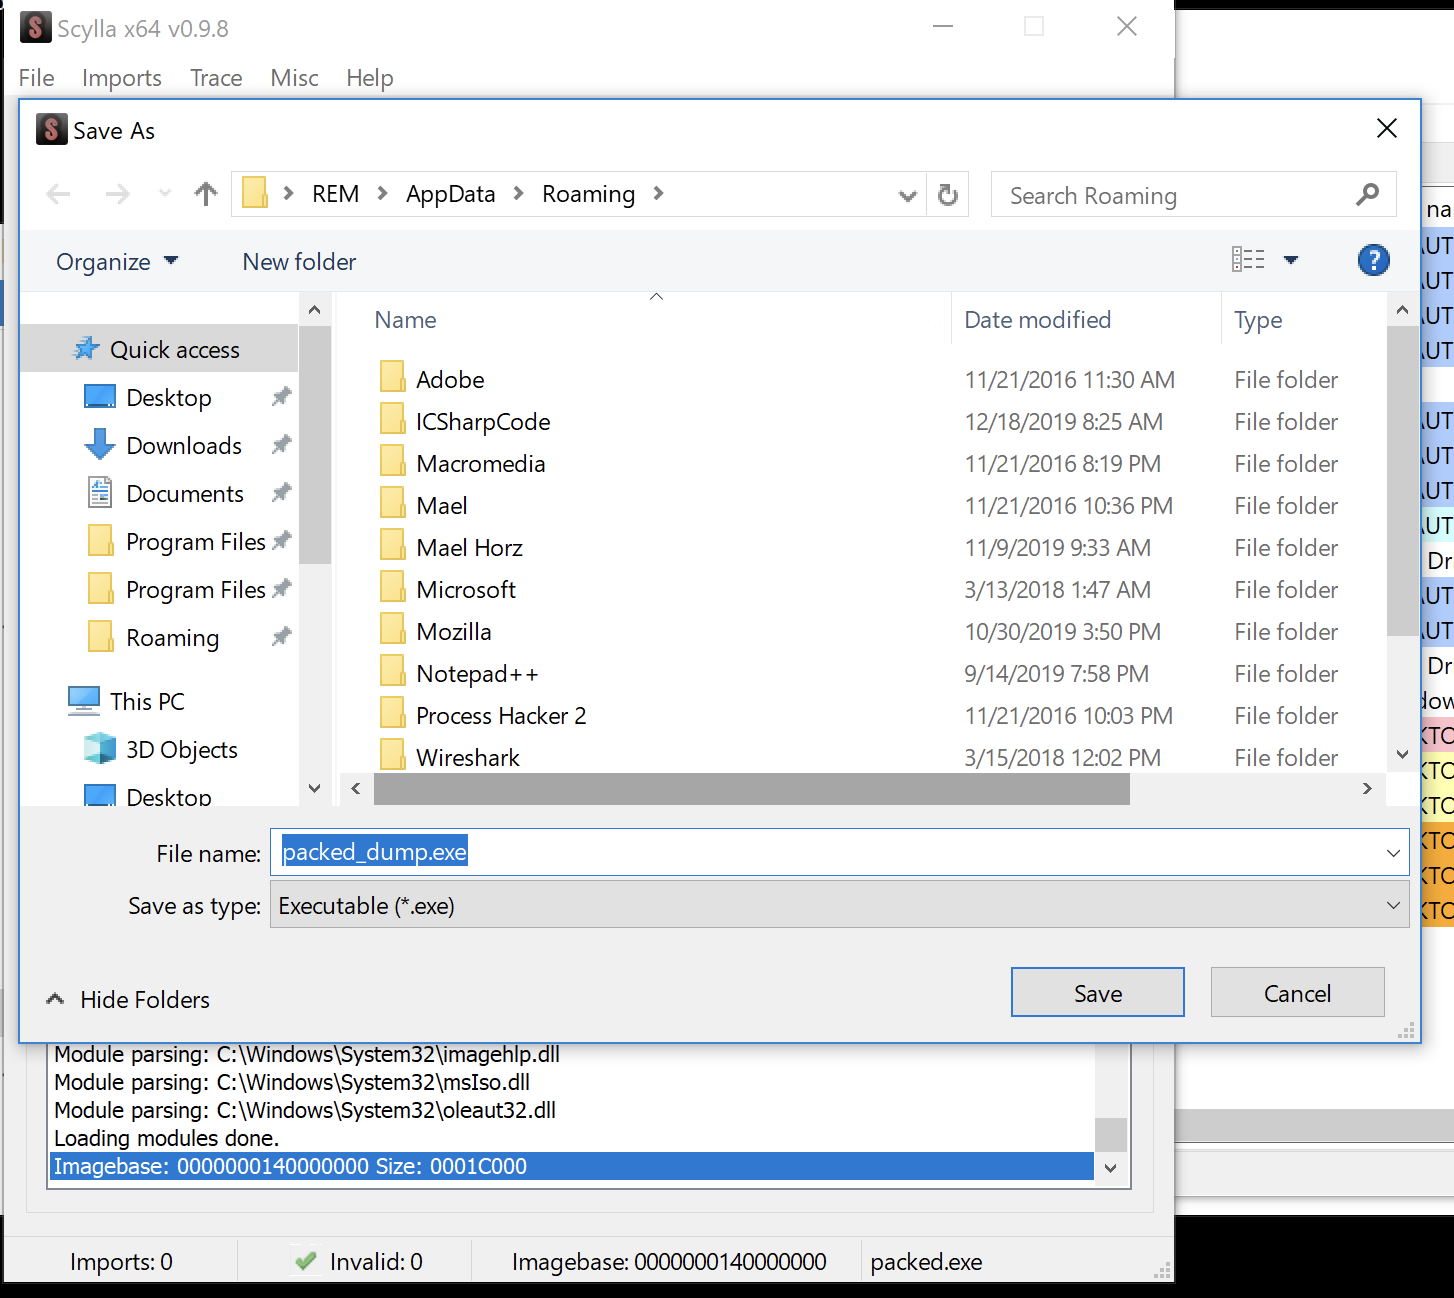
click in dump and saving it to the disk.
We don’t have any dedicated button to do this in one go we need to follow the steps.
now let’s do IAT Auto search . it does found it click ok.
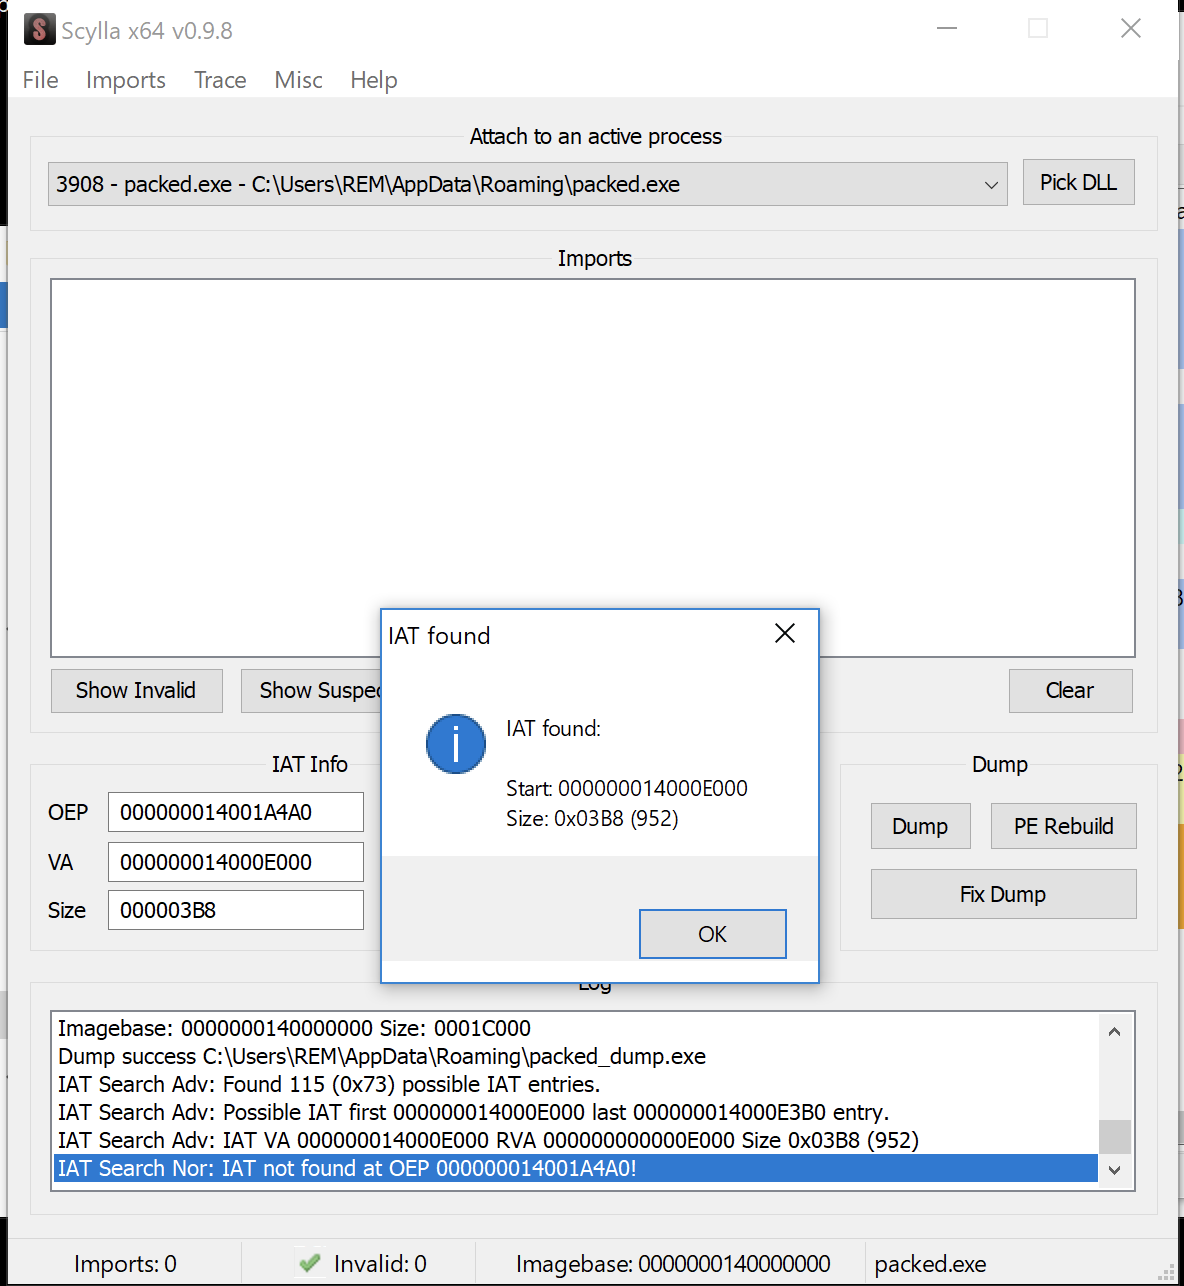
IAT auto search
Now click get the imports. we’ll see some green check marks
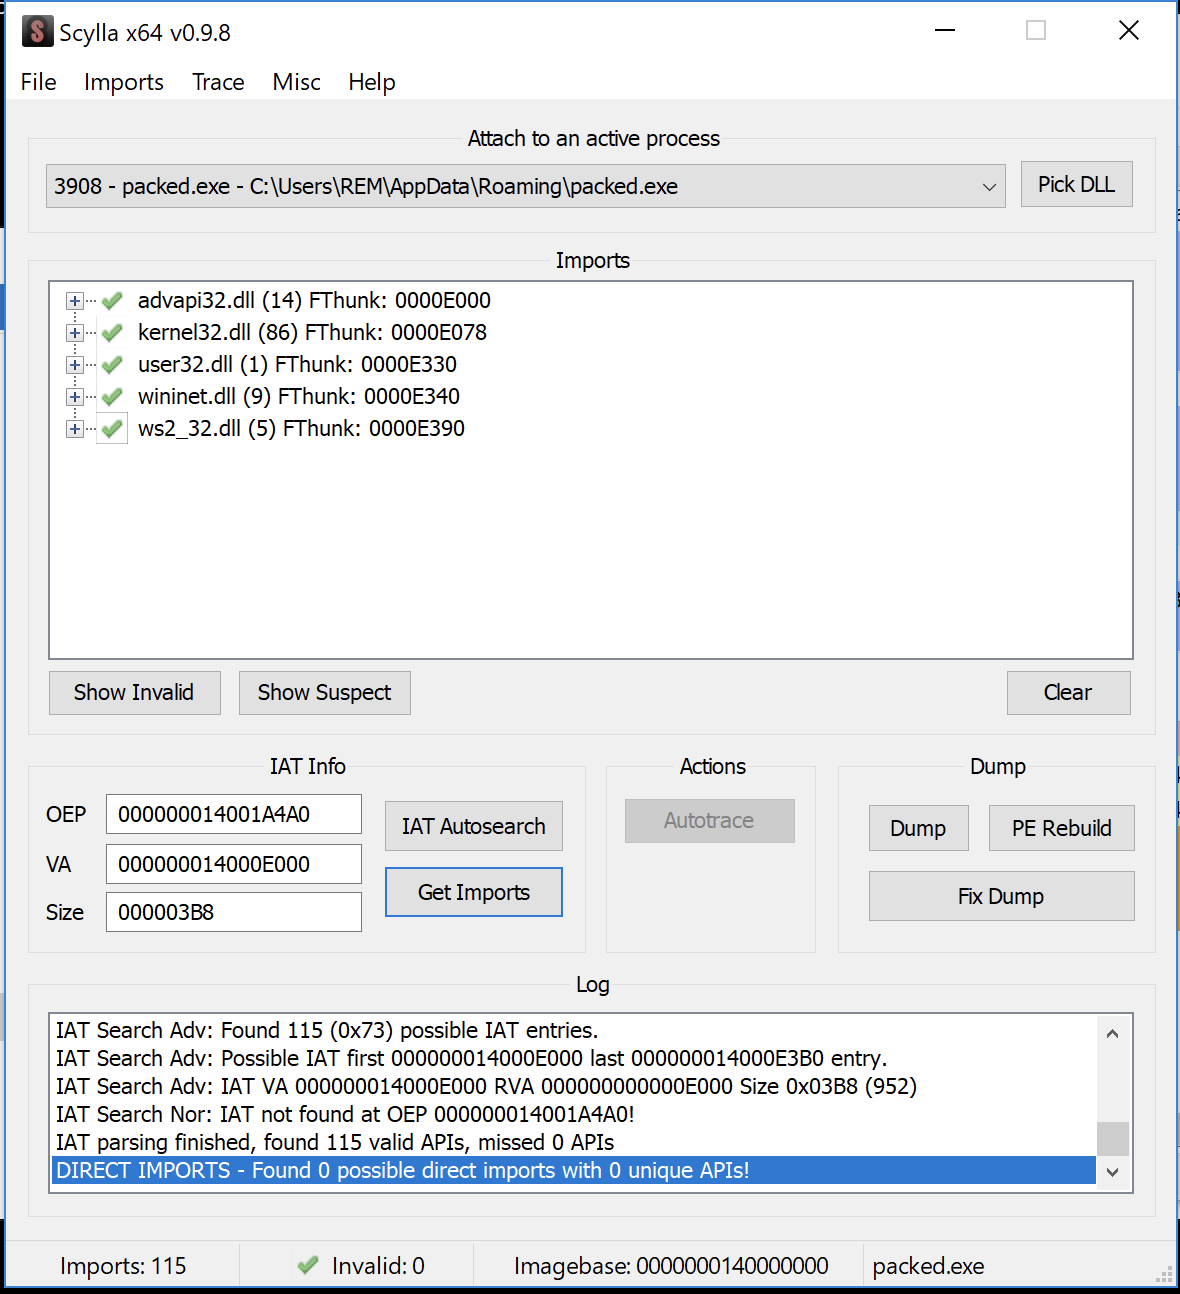
get the imports
Now we have to fix the dump. In another words we are going to fix the program that is on the disk because it not runnable.
SO we fix the dump and pick the dumped program packed_dump.exe not the original the dumped one we have to fixed the dumped program.
click on Fix dump then select the dumped program.
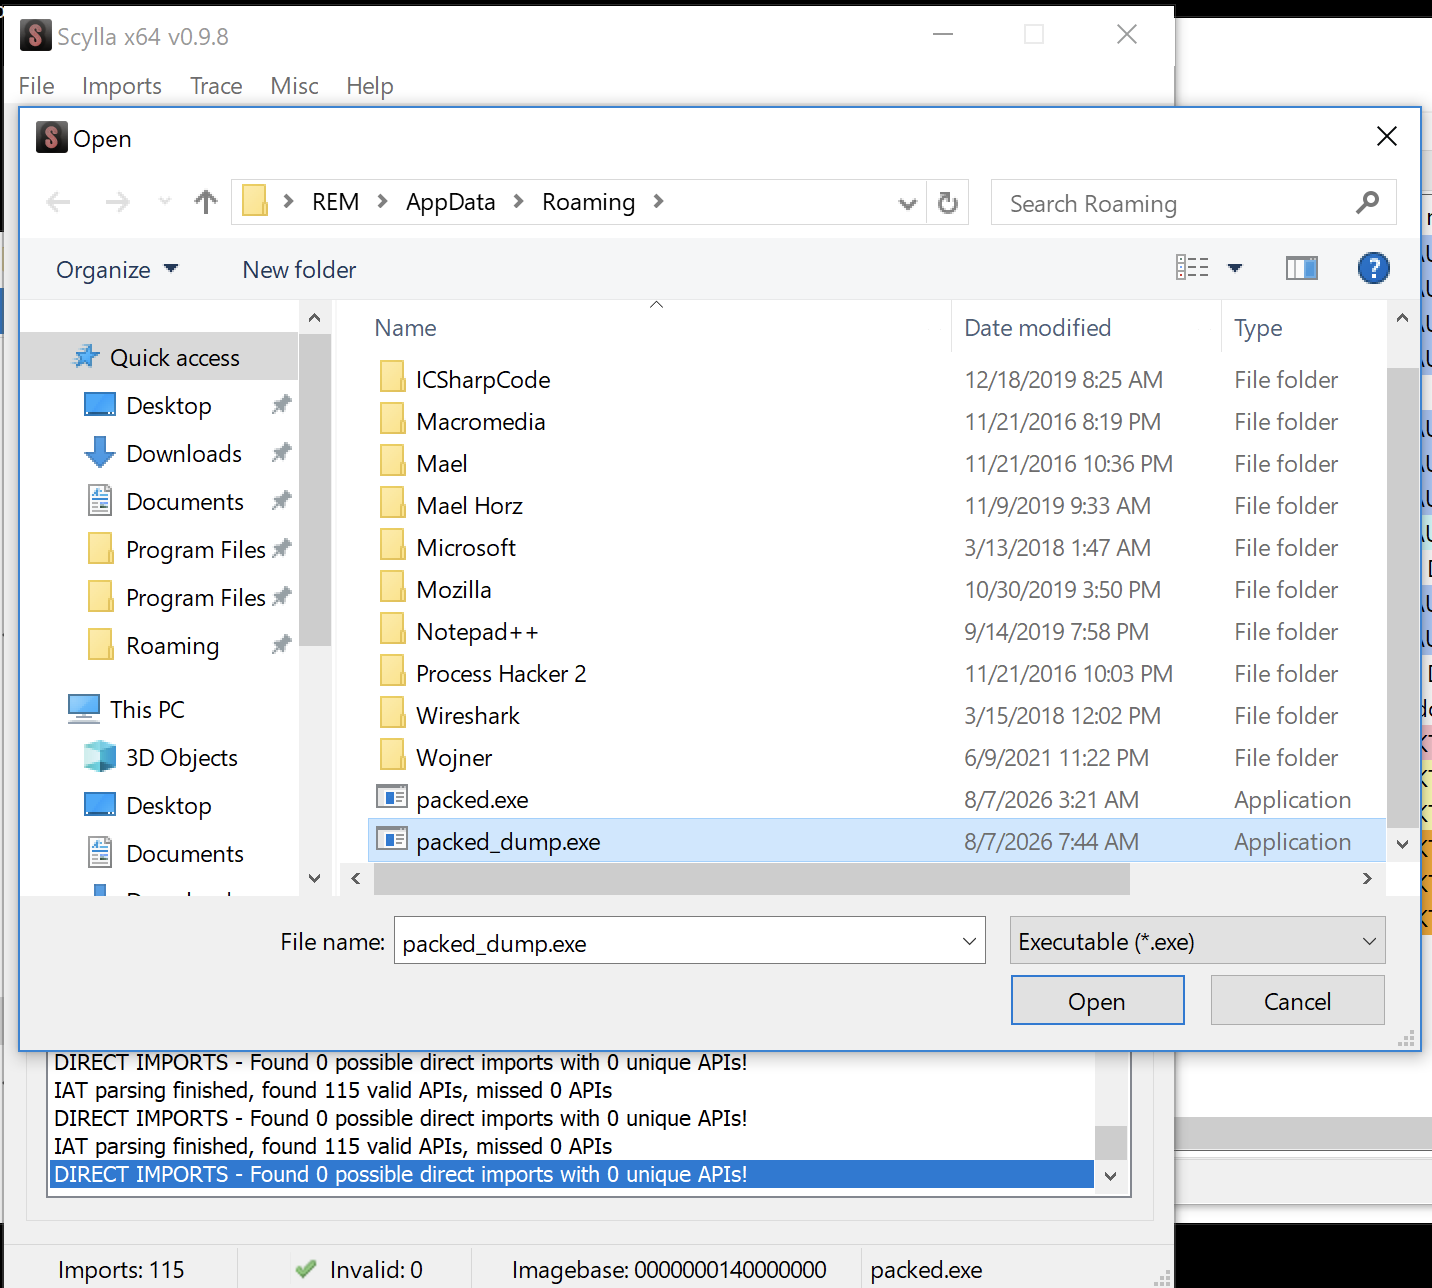
selecting the packed_dump.exe program to fix the dump.
Now click open. It will look like nothing happend. but now in you log window it will show Import rebuild success. with the new file created named as packed_dump_SCY.exe
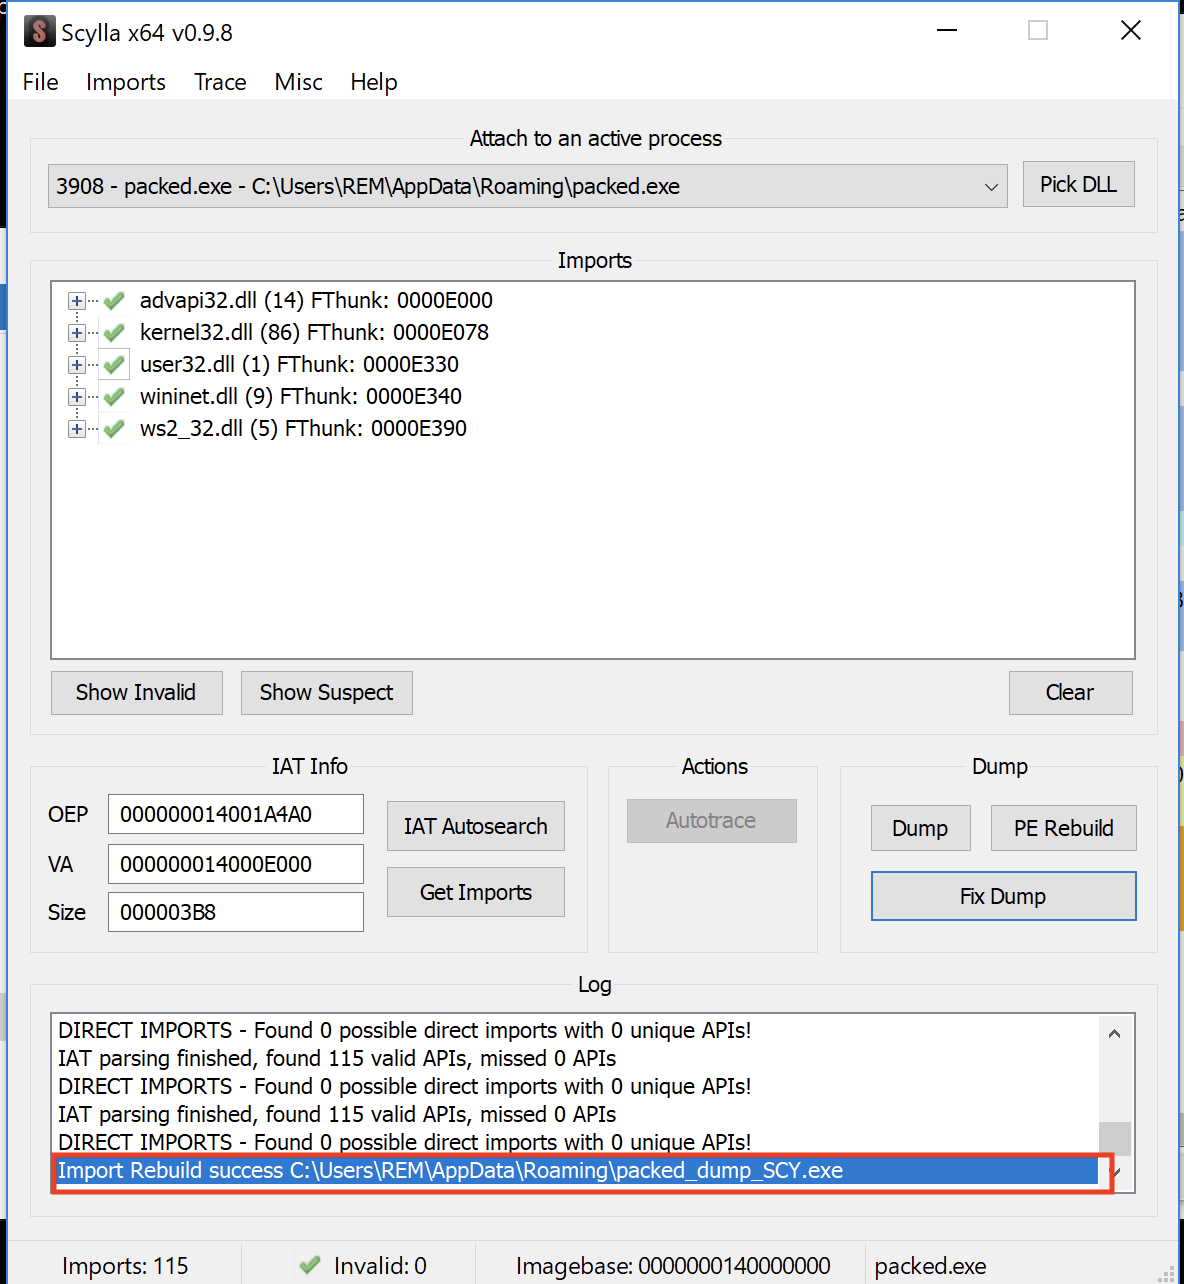
Import Rebuild success log
There’s still one thing that doesn’t work it’s because if we try running it. it try to run the unpacked stuff. Because the entry point is still pointing to the unpacking code which is now trying to unpacking something which is already unpacked.
We could perform static analysis on the dumped file; however, it is not runnable, probably because of the Entry Point field.
Now we can see the raw-size is no longer zero it’s now 0x0000FE00 (65024 bytes) .
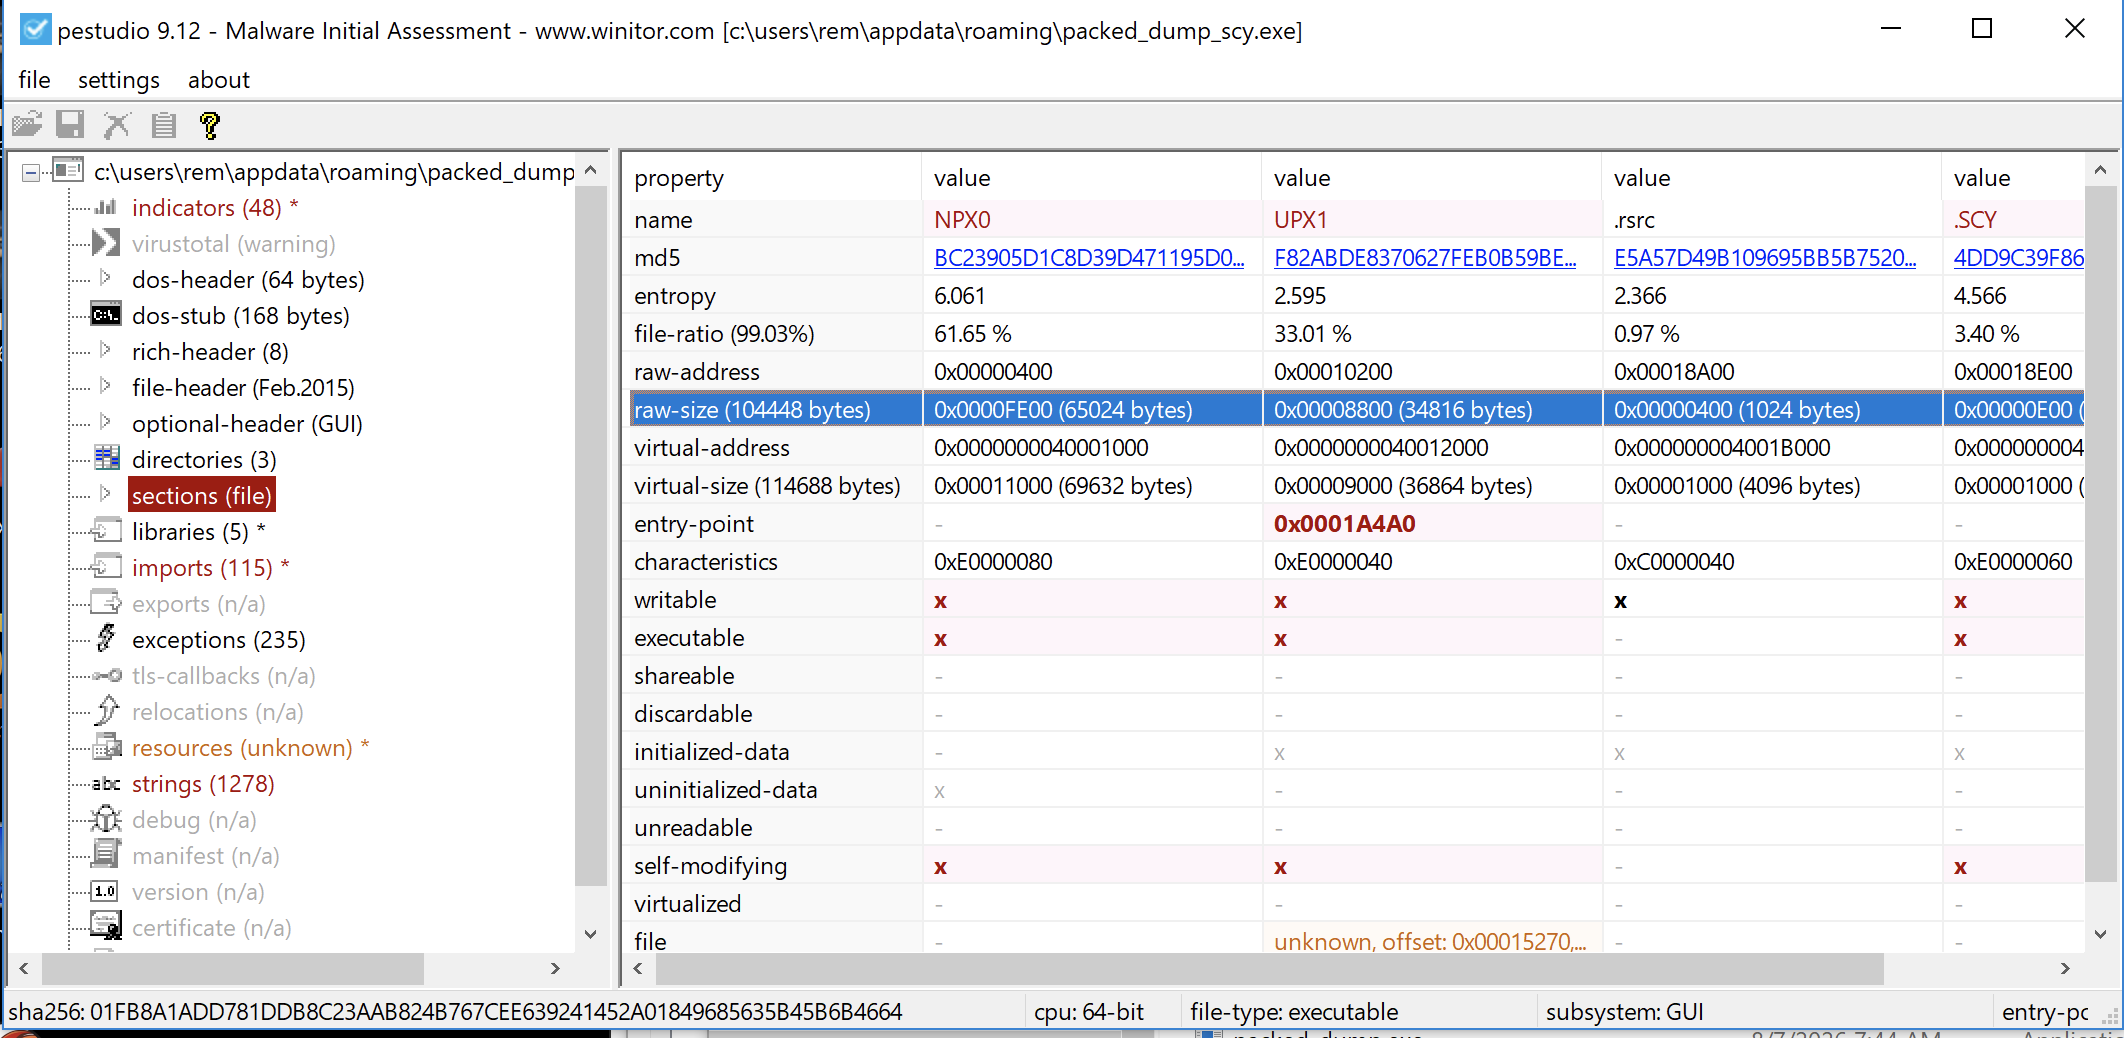
packed_dump_SCY.exe in pestudio showing the raw size is 0x0000FE00 (65024 bytes)
Then why did we do this approach in the first place well how long did it take.
dump → IAT Auto search → Get Import → Fix dump.
That’s it.
Dumping the process offers a fast way of unpacking the specimen.
wrong Entry Point value and additional PE header problems.Now we will patch it on the fly while it’s running to change it’s behaviour so it won’t stop immediately id it see something it didn’t like.
Using a Debugger to dump it
Use a debugger for a more controlled approach to unpacking.
What we need to follow
let’s open the packed sample make sure you load the packed sample in x64dbg.
after opening the sample in x64dbg the next thing is to scroll and find where the code changes some places where the code is changing. where cide liiks little bit odd or different.
scrolling down we’ll see a lot of random stuff. try to find where the code changes.
I did found the area where the code changes like this.
All of a sudden we got this instead of the repeative instructions and all are zero’s.
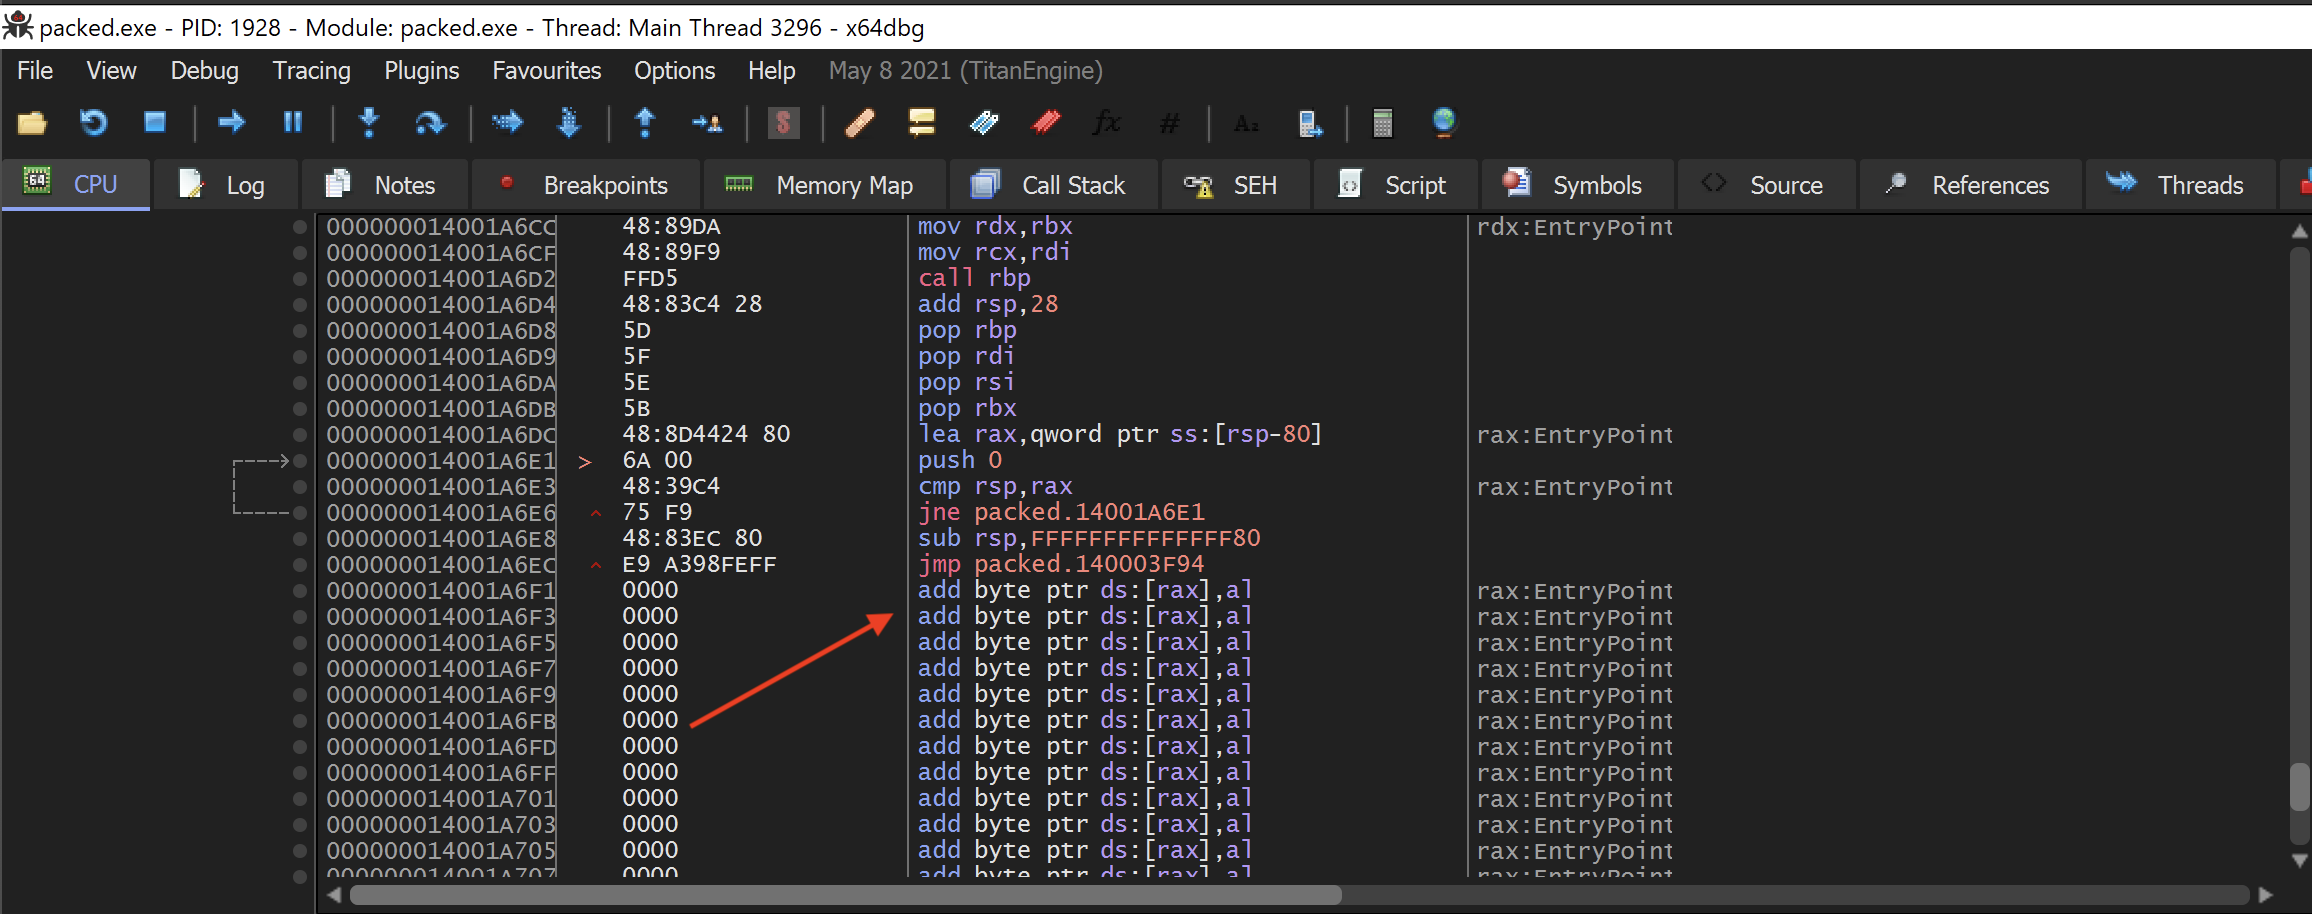
place where the code is changing in x64 dbg.
There’s a bunch of zeros’s that means we probably find the end of the unpacker.
we also have a jump:
000000014001A6EC | E9 A398FEFF | jmp packed.140003F94 |This is common for unpacker to do a jump at the end of the unpacking process to where the code starts.
highlight this jump instruction the click Debug then Run until selection.
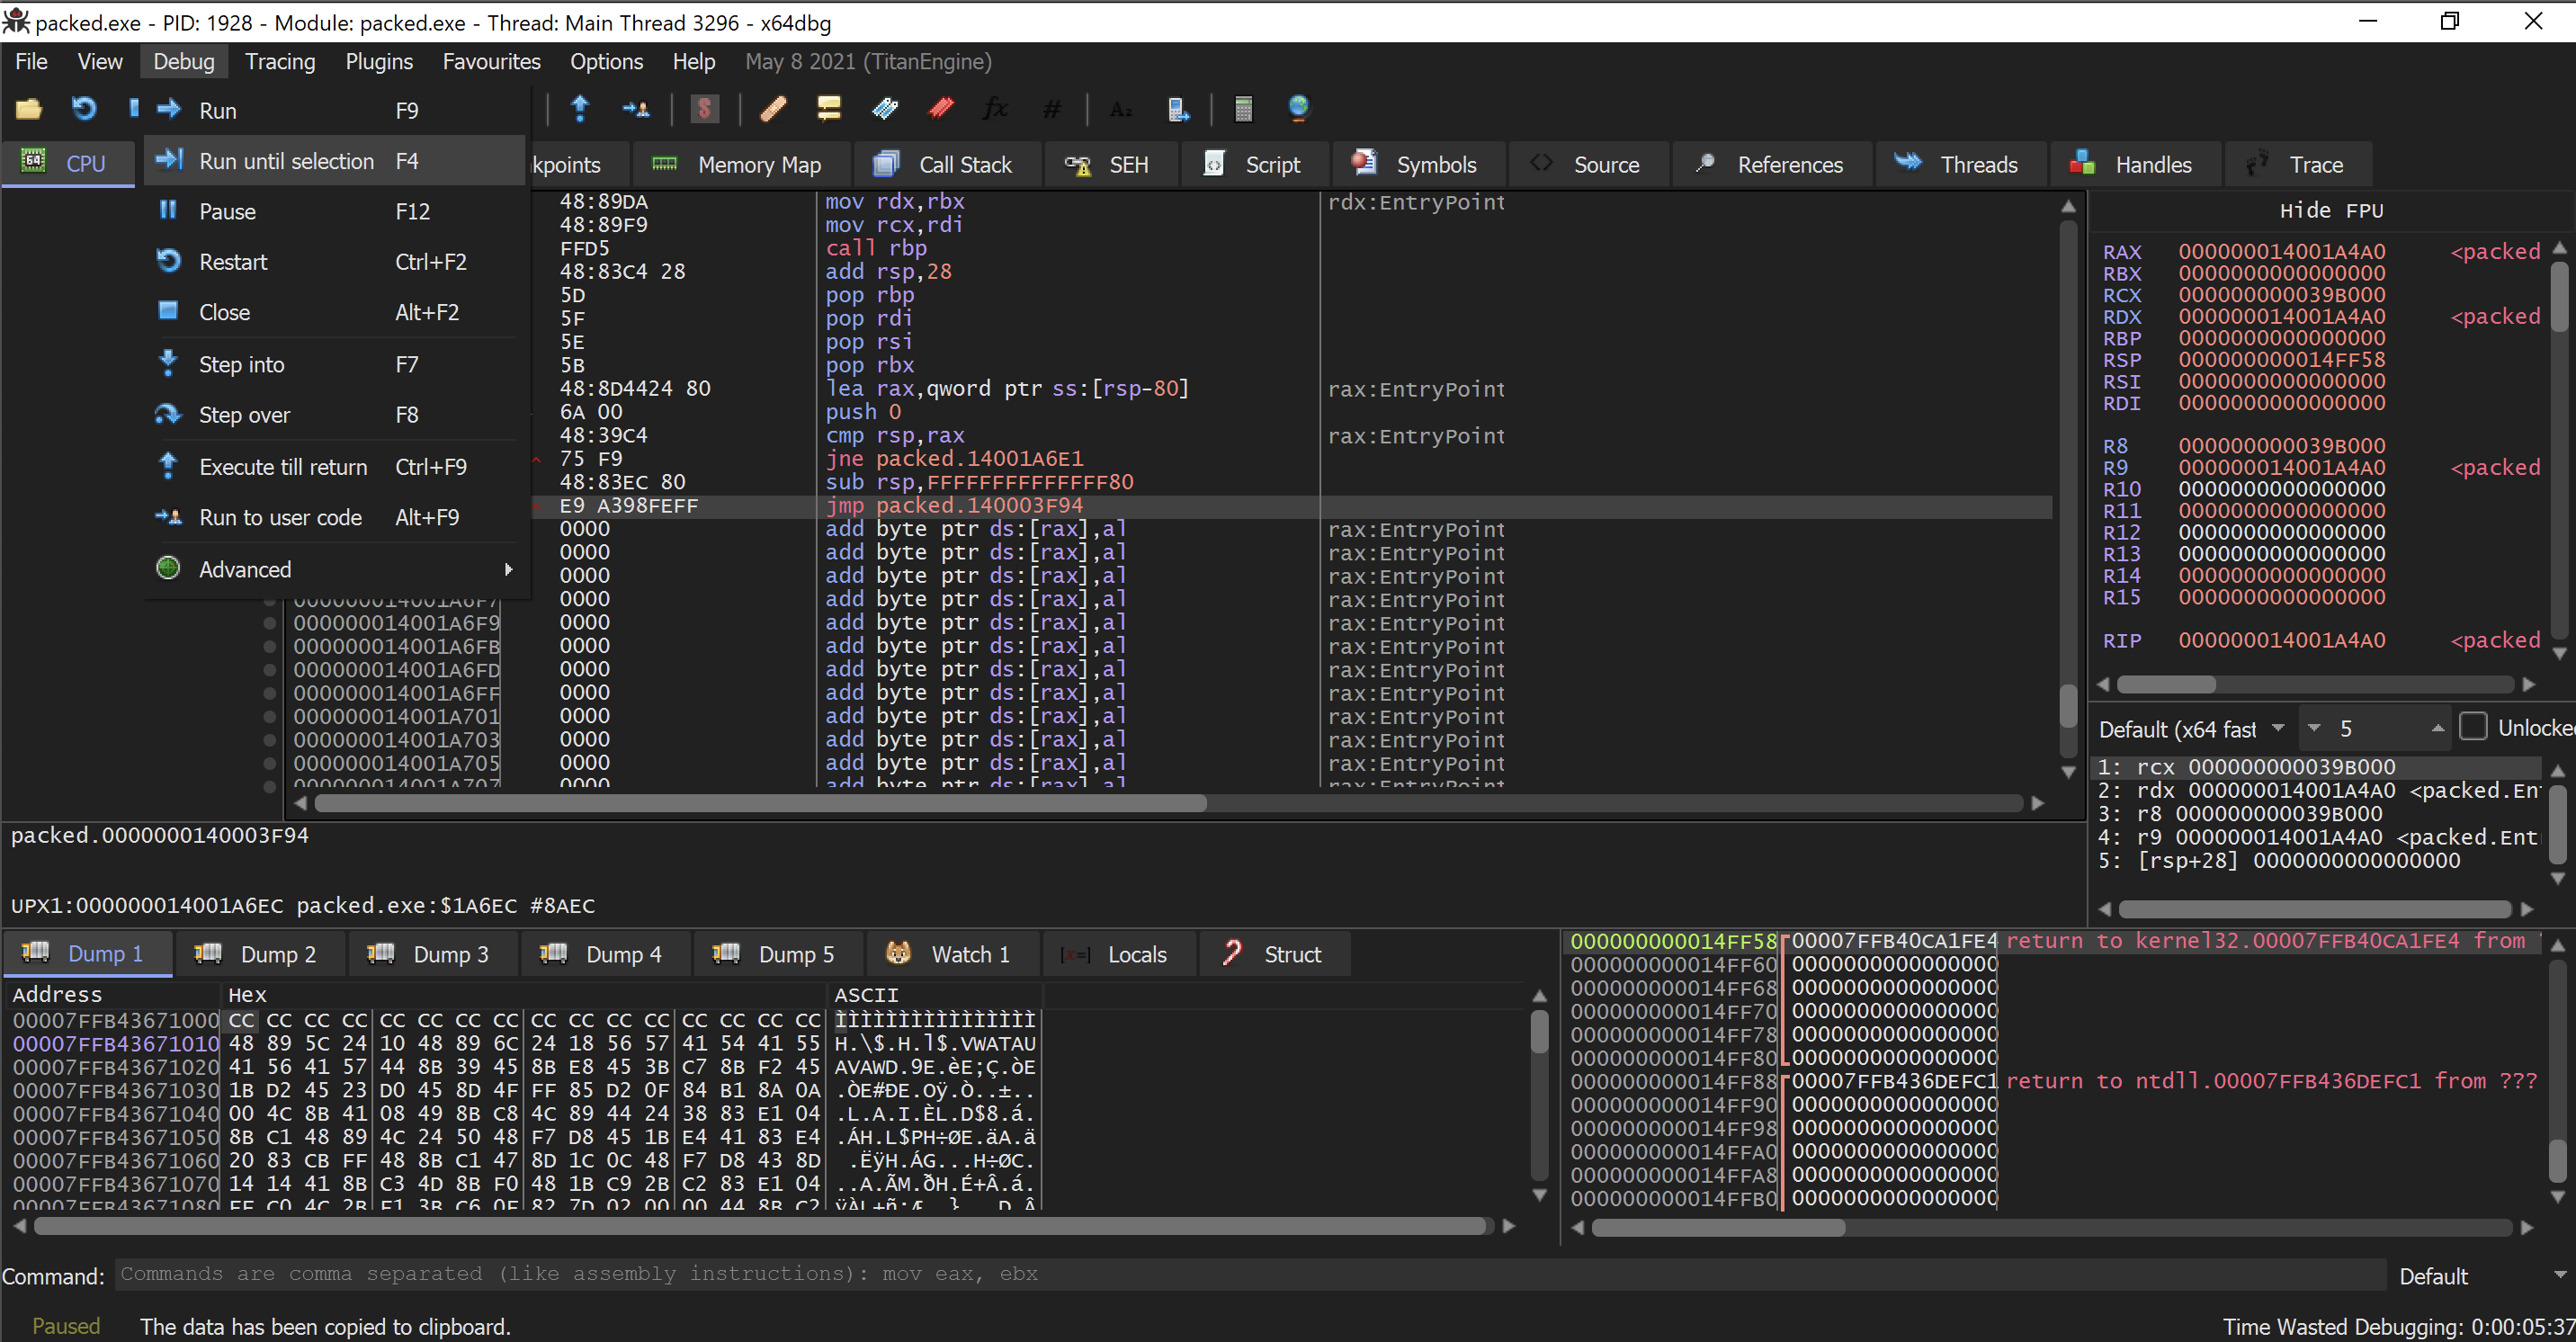
Highlighting the jump instruction then debug the select run until selection.
Now the RIP is at the jump instruction
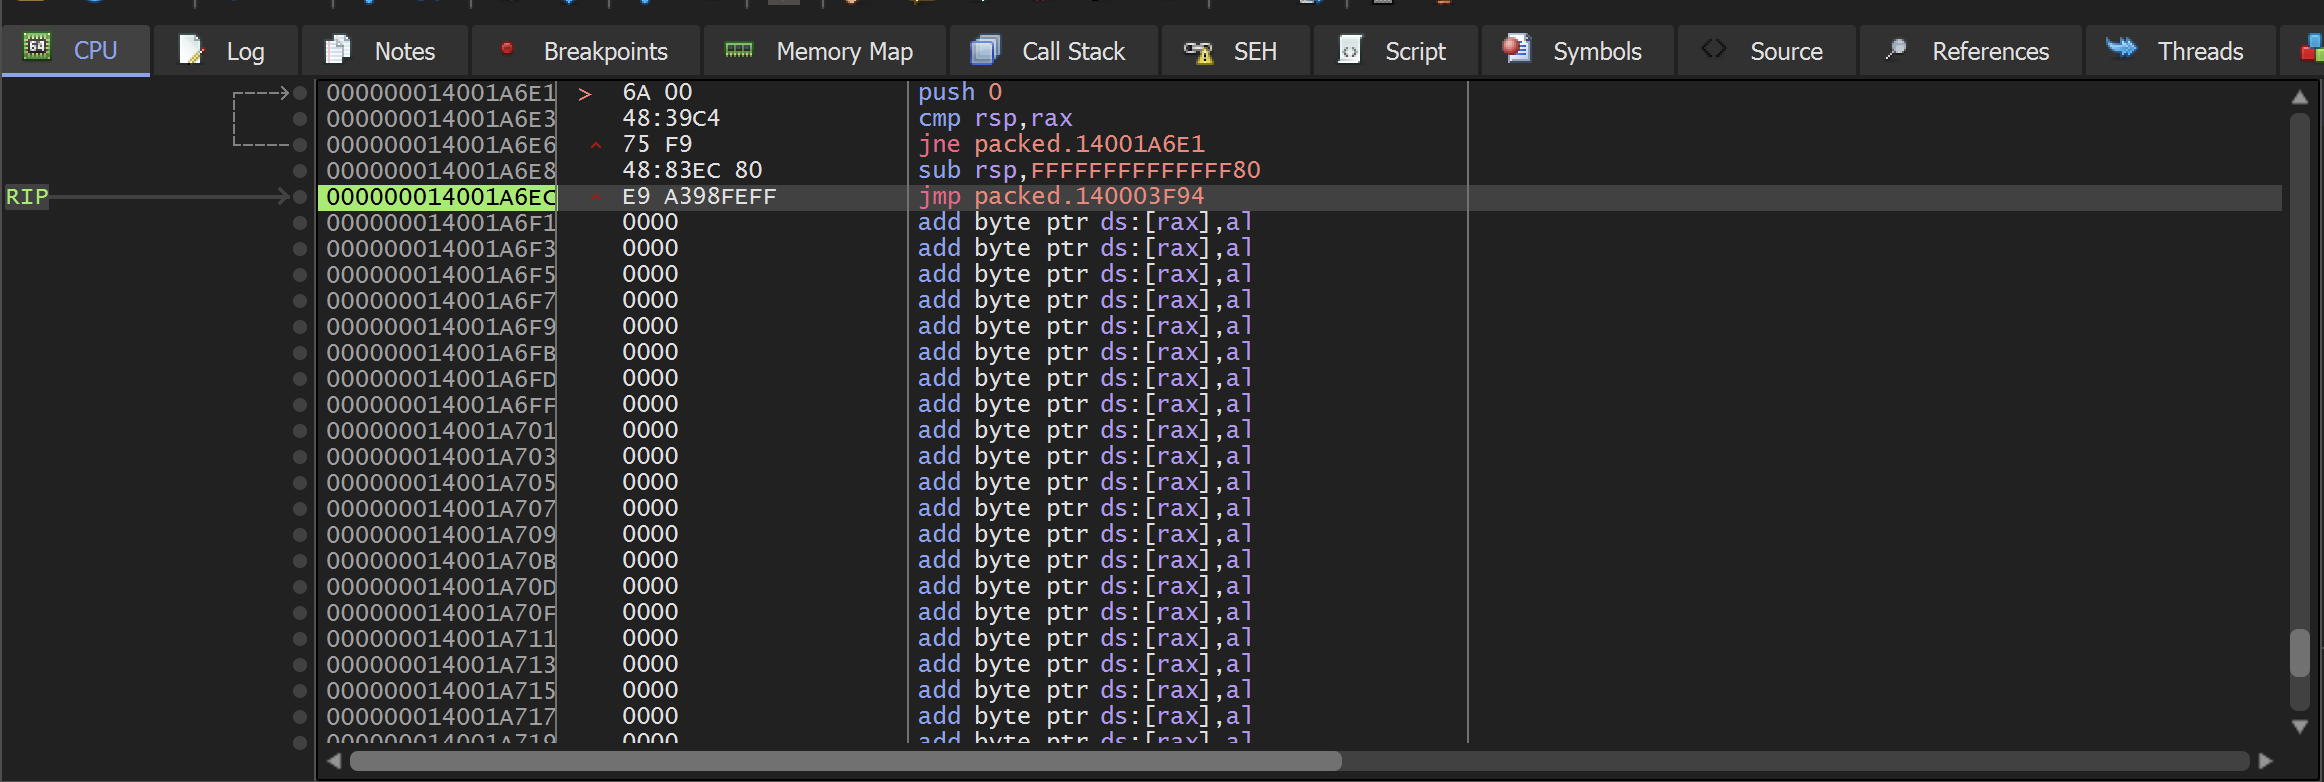
RIP at the jump instruction jmp packed.140003F94
Now do a step over.
we are at the address:
0000000140003F94 | 48:83EC 28 | sub rsp,28 |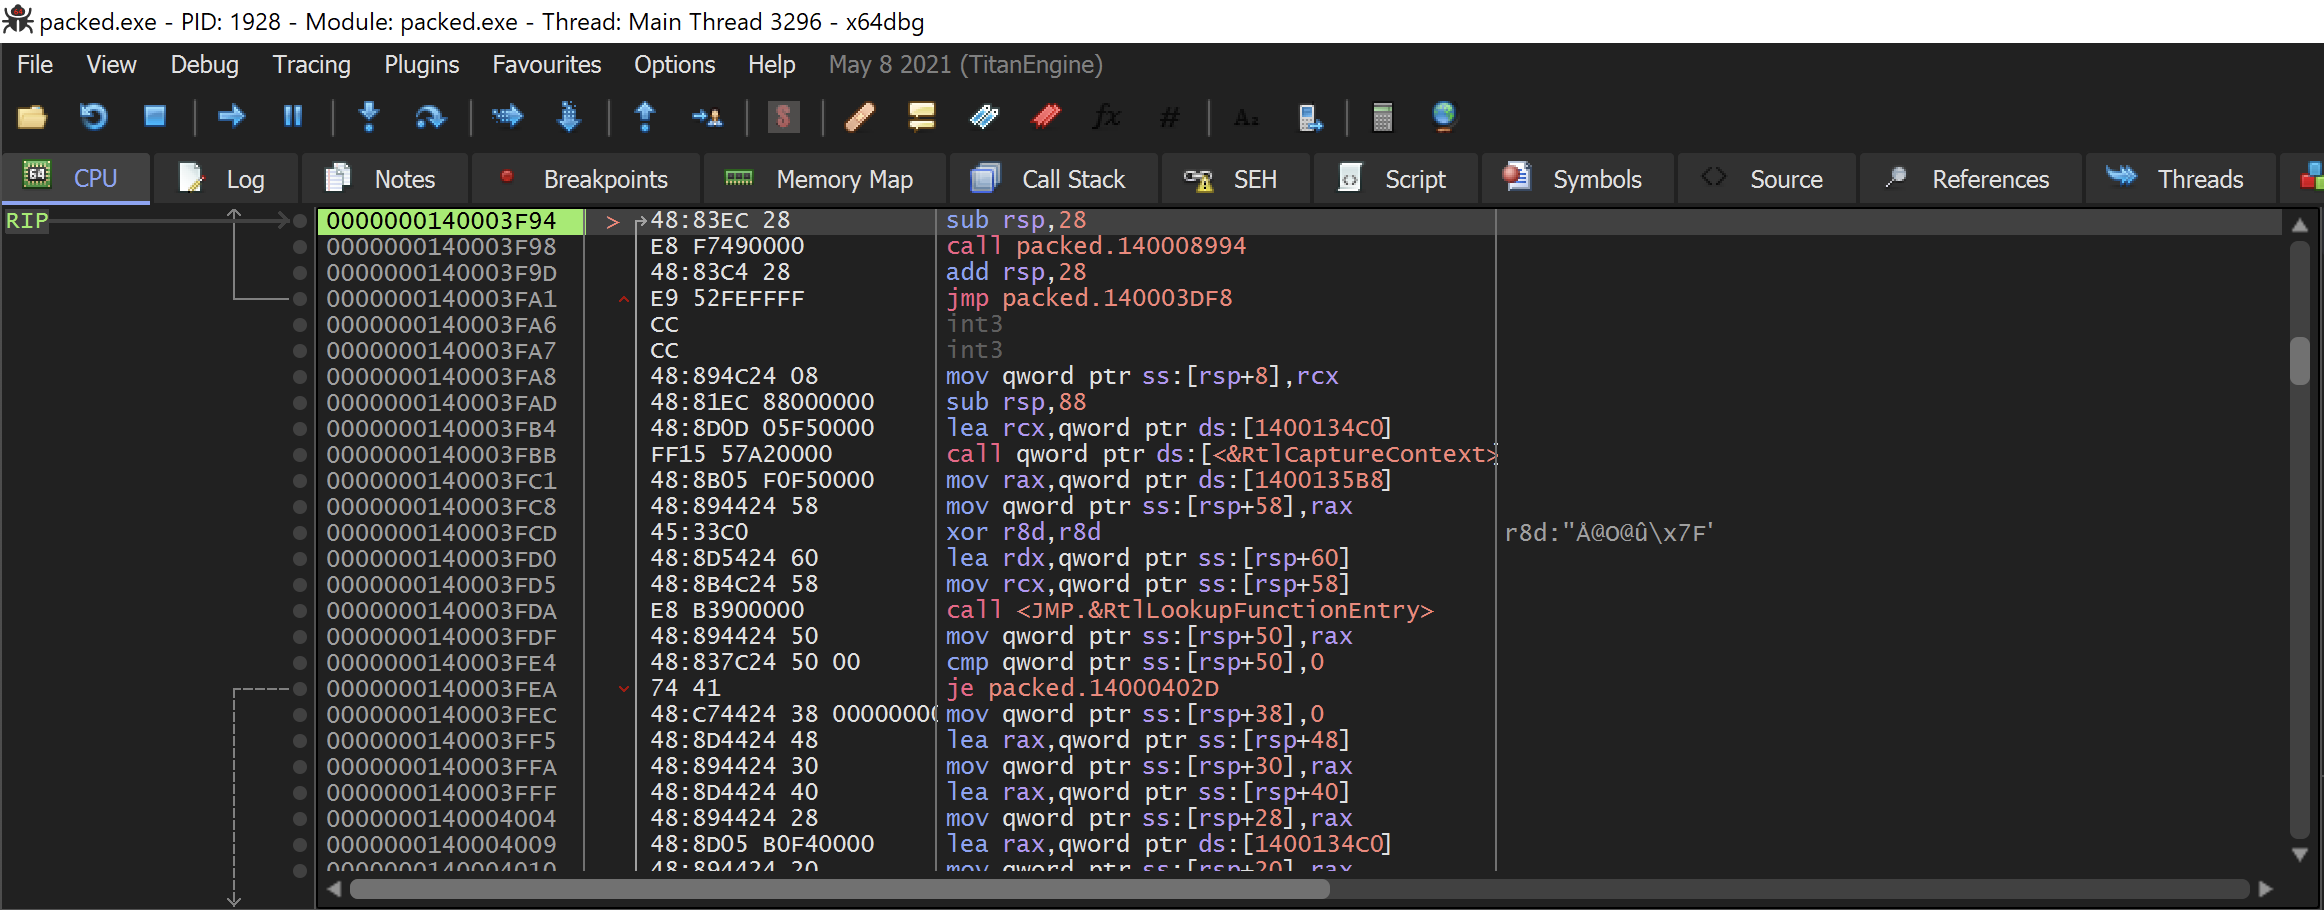
after step over we are the address: 0000000140003F94
Ok now we have to prove that the sample is unpacked.
right click on the blank area on the left then search for → Current region → String references
like this
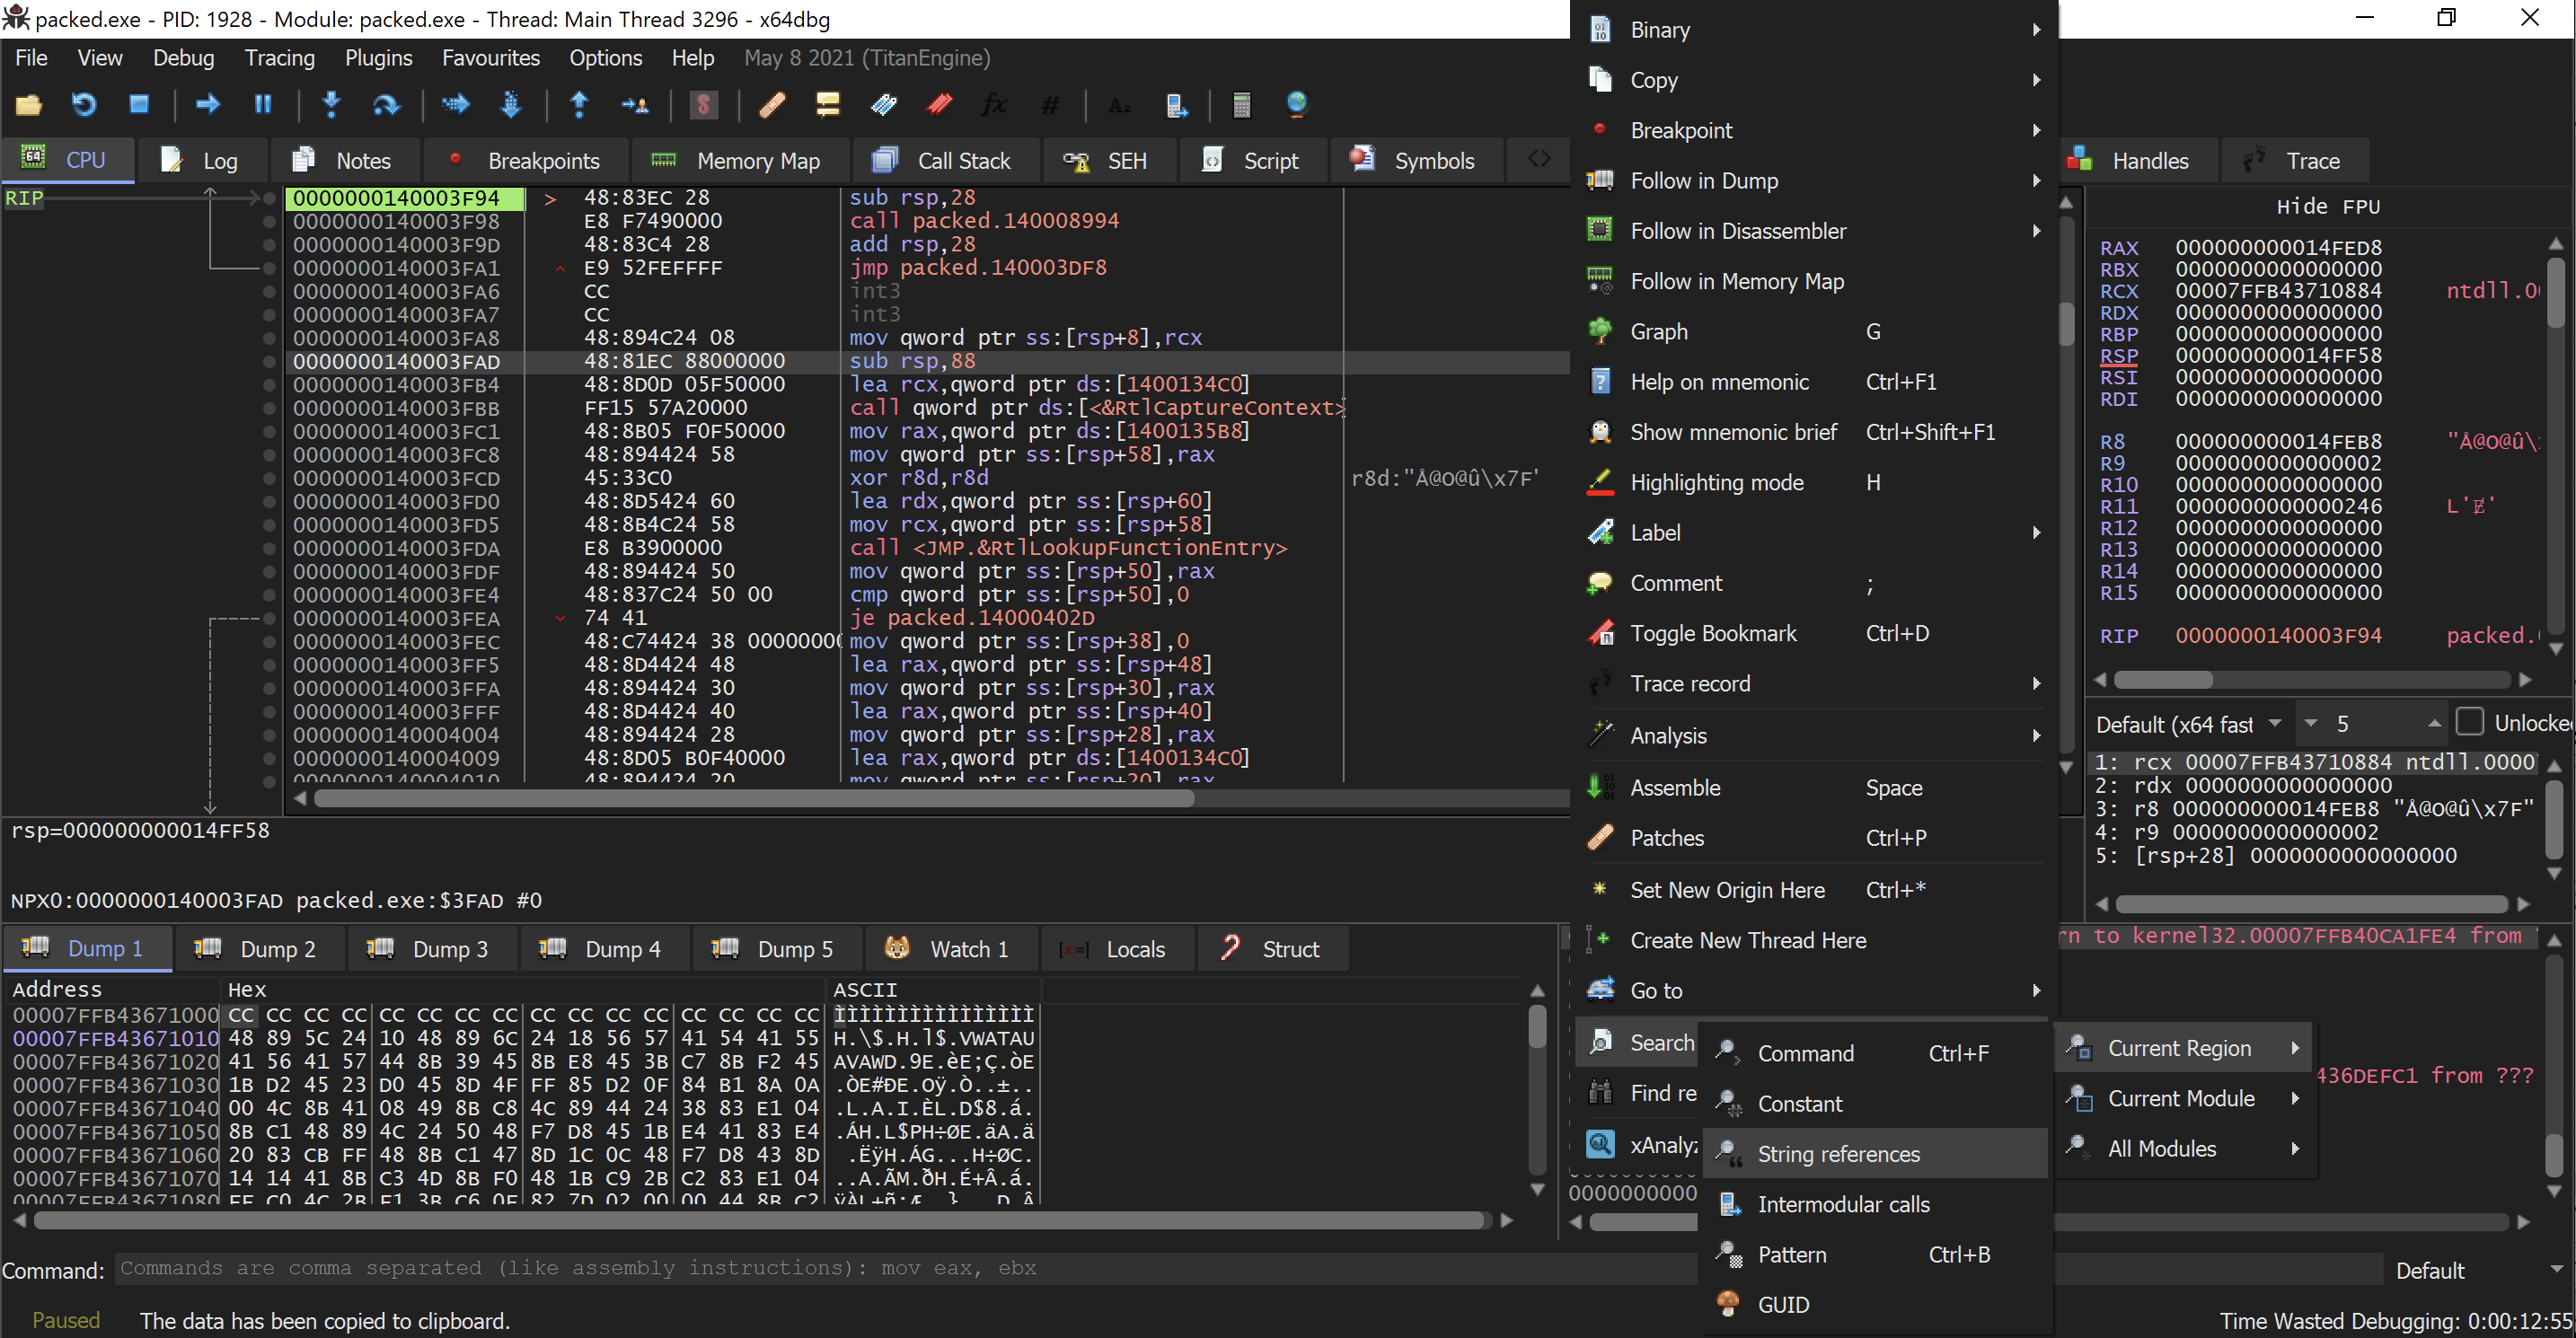
clicking String references
you will move to a new tab called References Now these strings will look different from the process hacker strings we saw earlier.
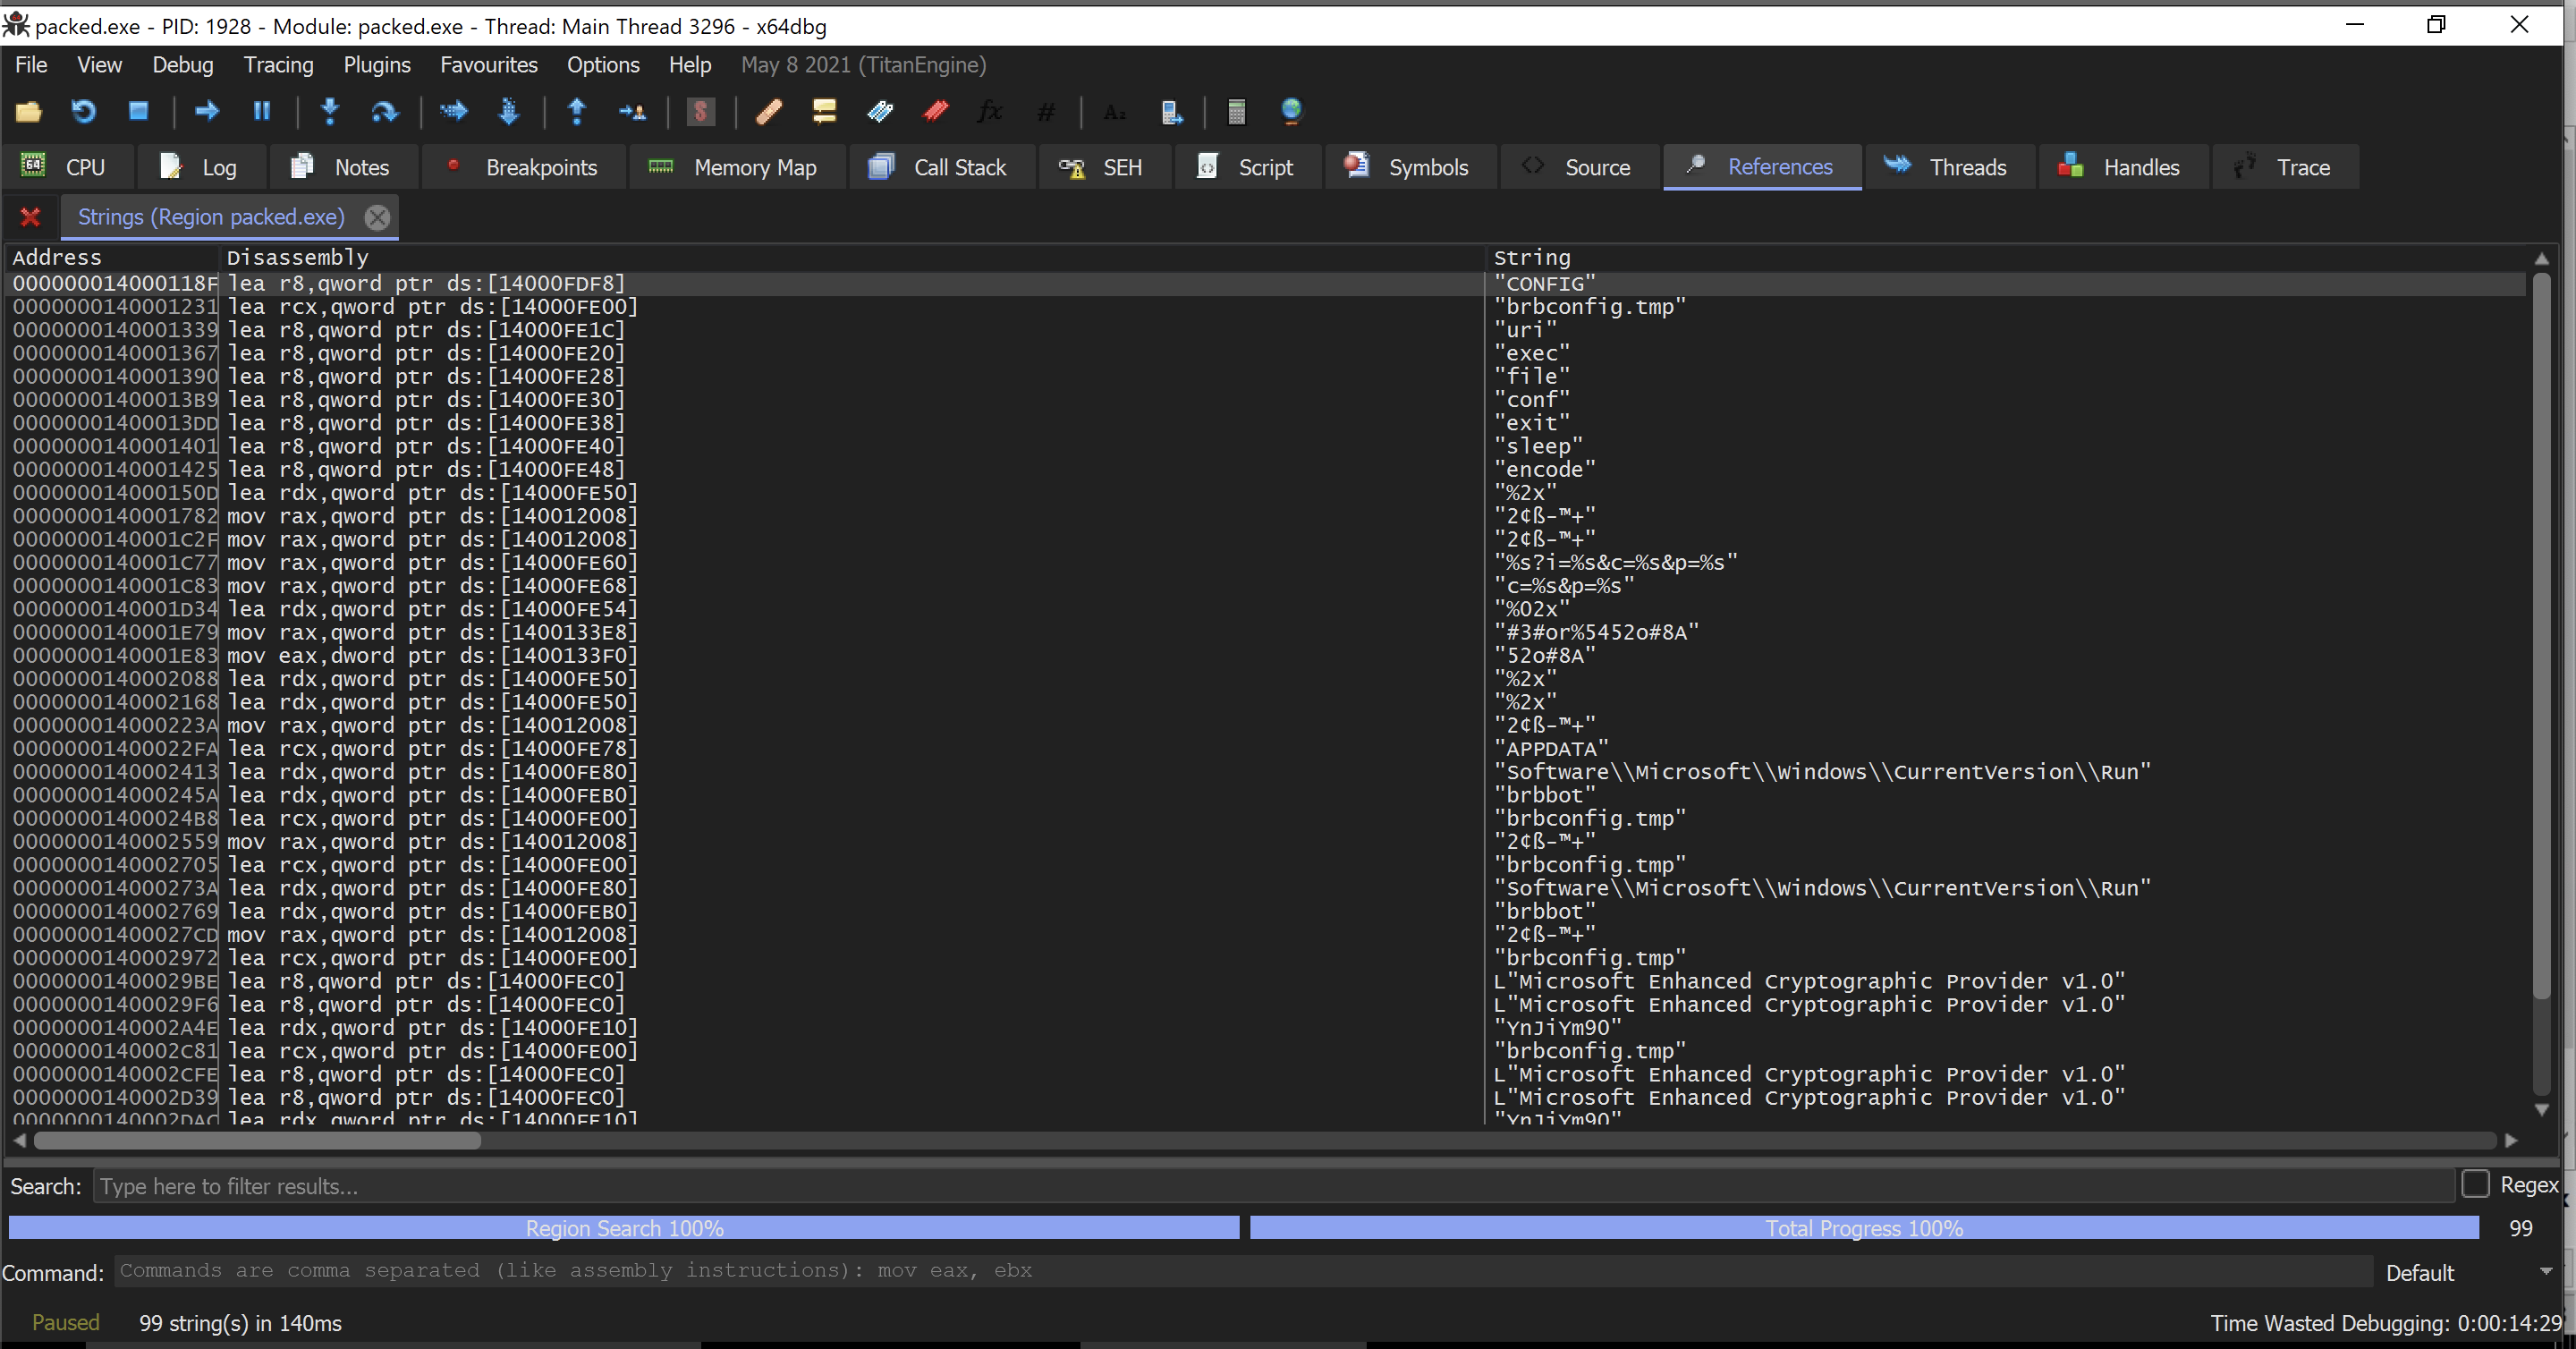
String References window in x64dbg.
You will find more meaningfull strings and now we know this thing is working……
We are pretty sure that it’s unpacked now.
Click the CPU tab to go back.
Dumping
Now let’s dump it…
Under plugins click OllyDumpEx → Dump Process
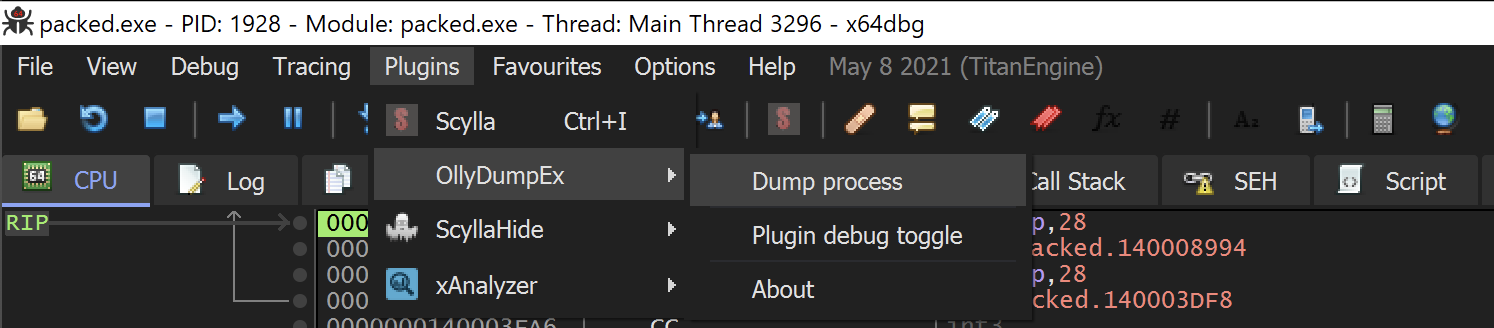
Plugins → OllyDumpEx → Dump Process
A new window OllyDumpEx will pop up like this
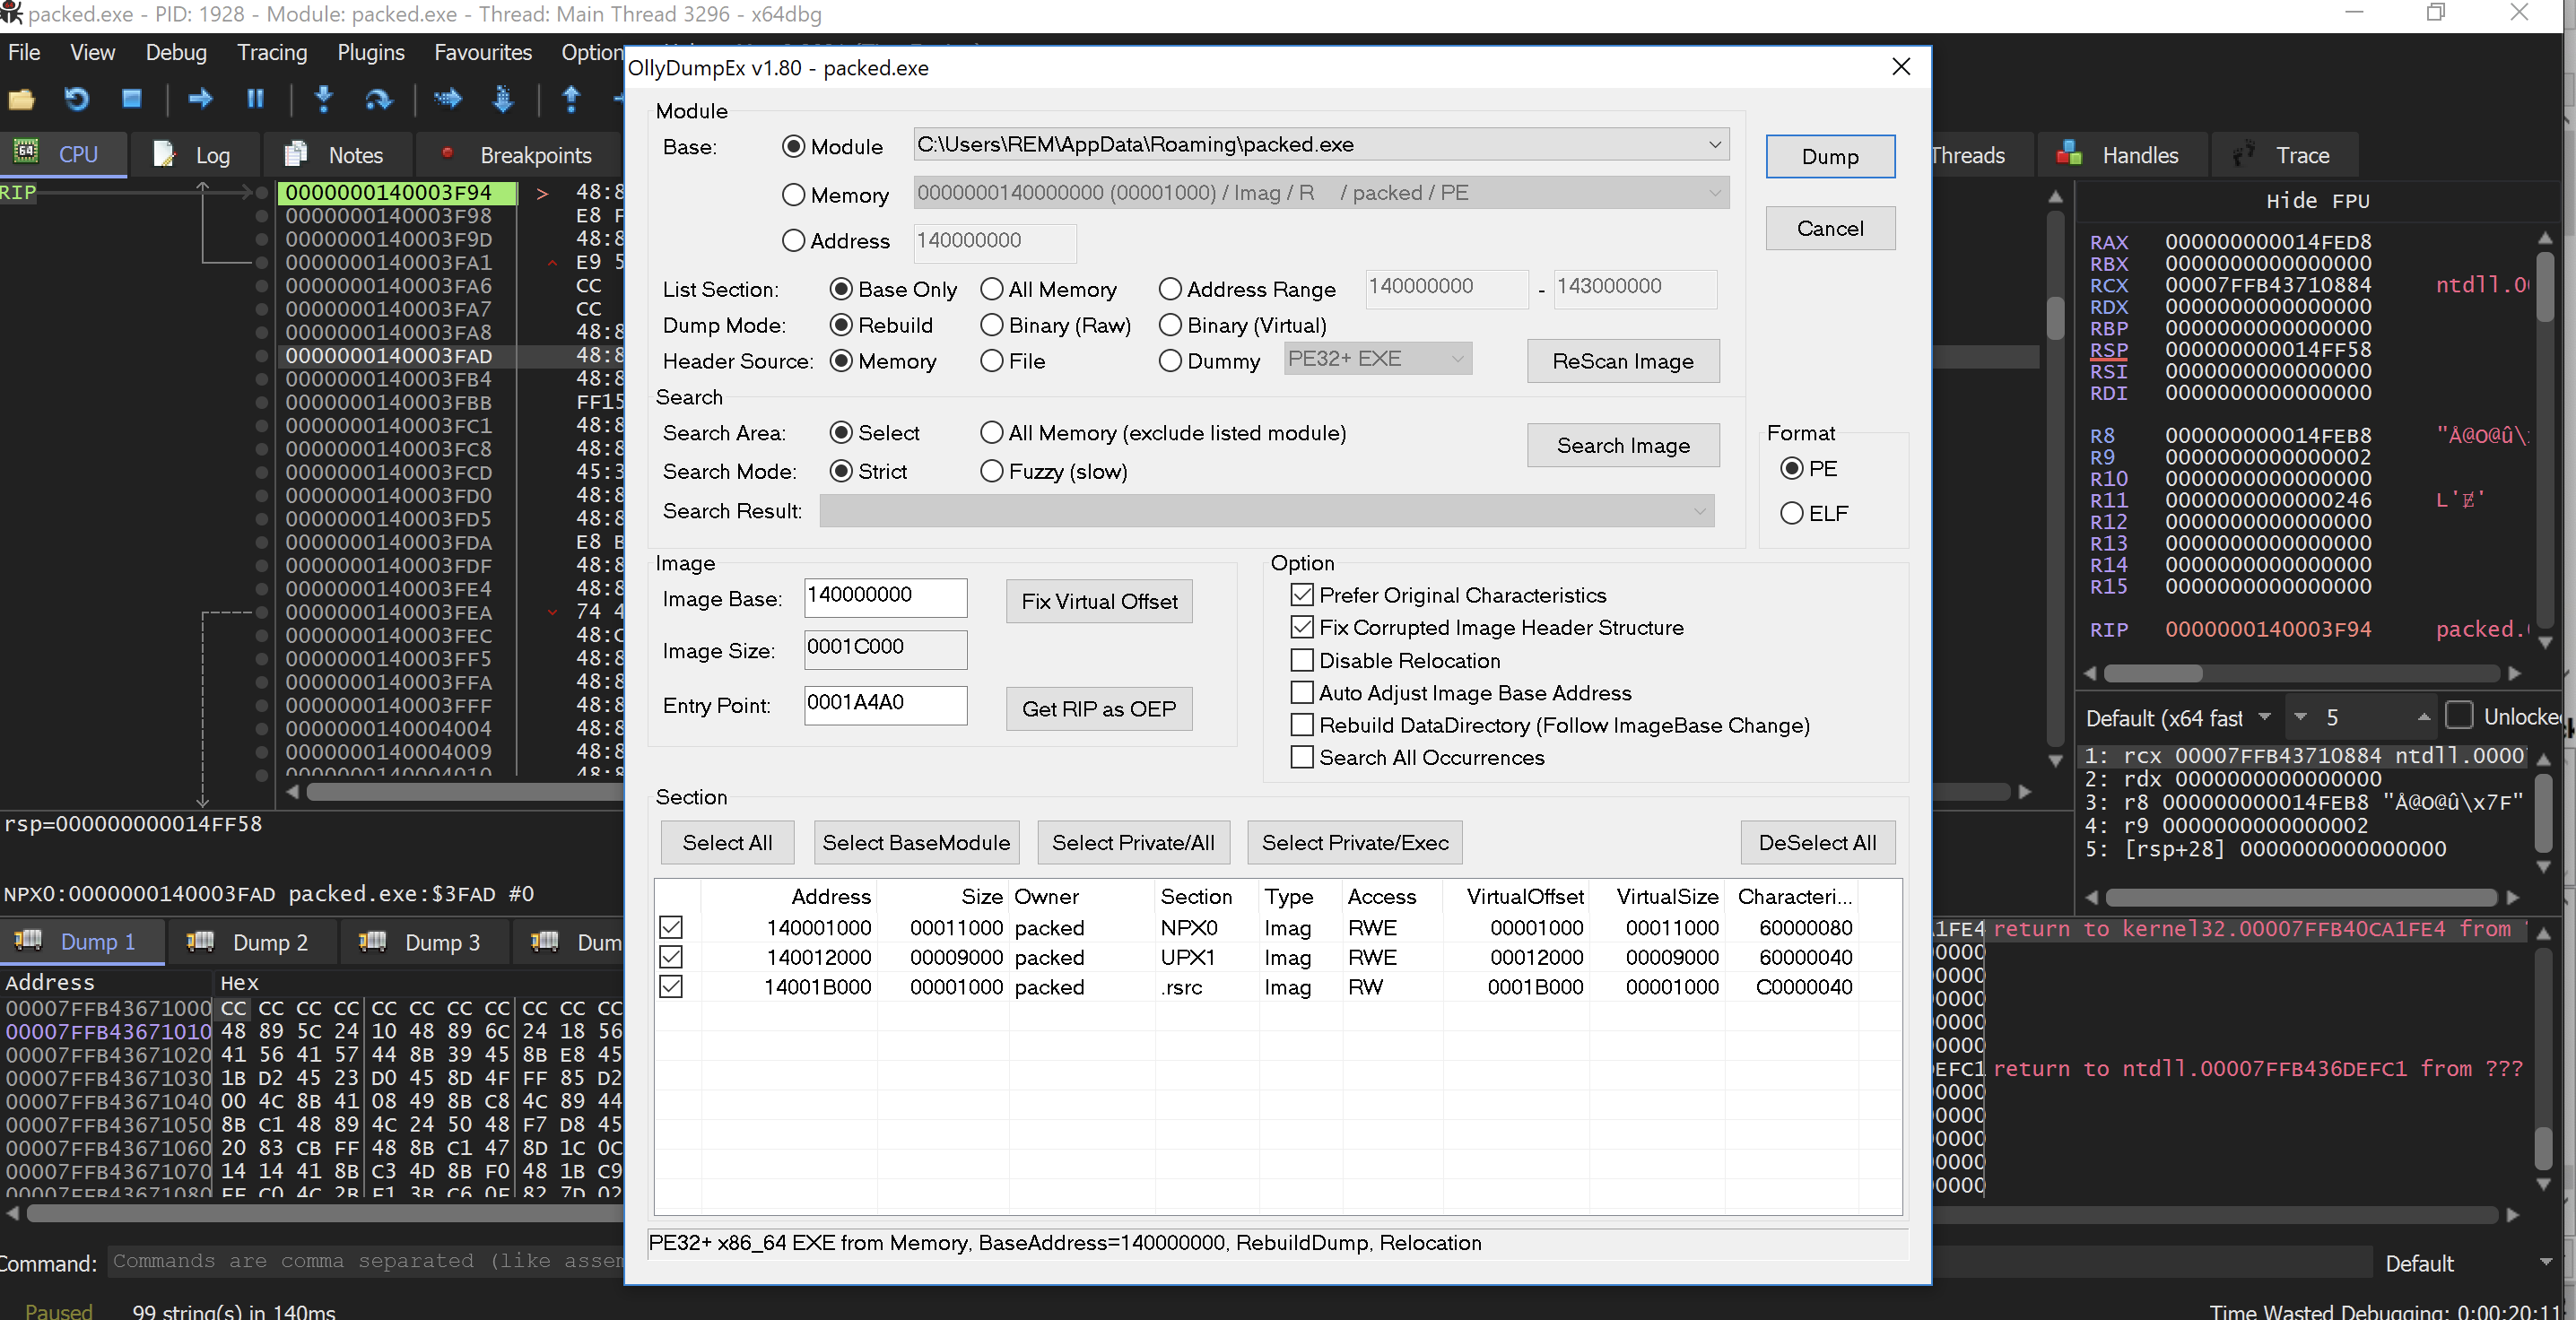
OllyDumpEx window
There’s a couple of things we need to fix.
first one is Get RIP as OEP because RIP is pointing to the original entry point
next we need to double click section below the UPX1 .this one
click Get RIP as OEP it will change to 00003F94
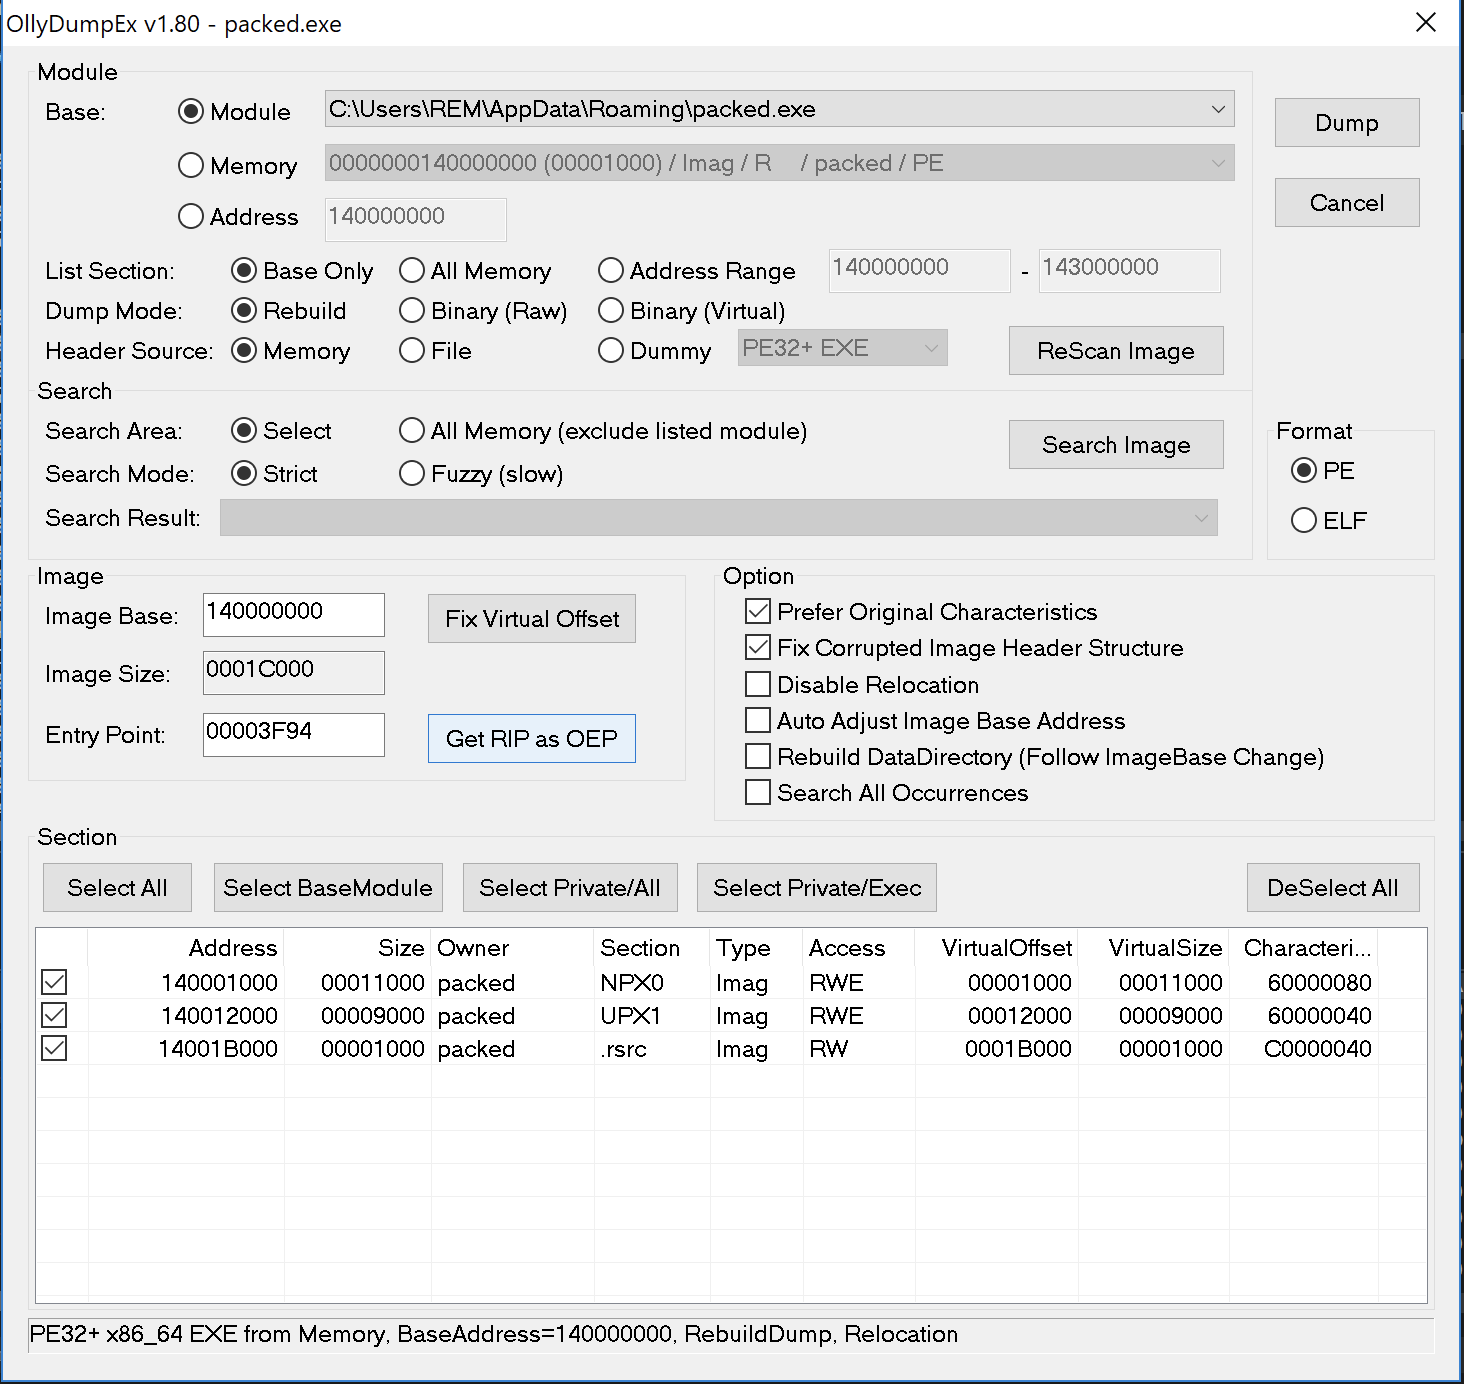
clicked Get RIP as OEP changed to 00003F94
Now double click on the second entry of the below section. this one.
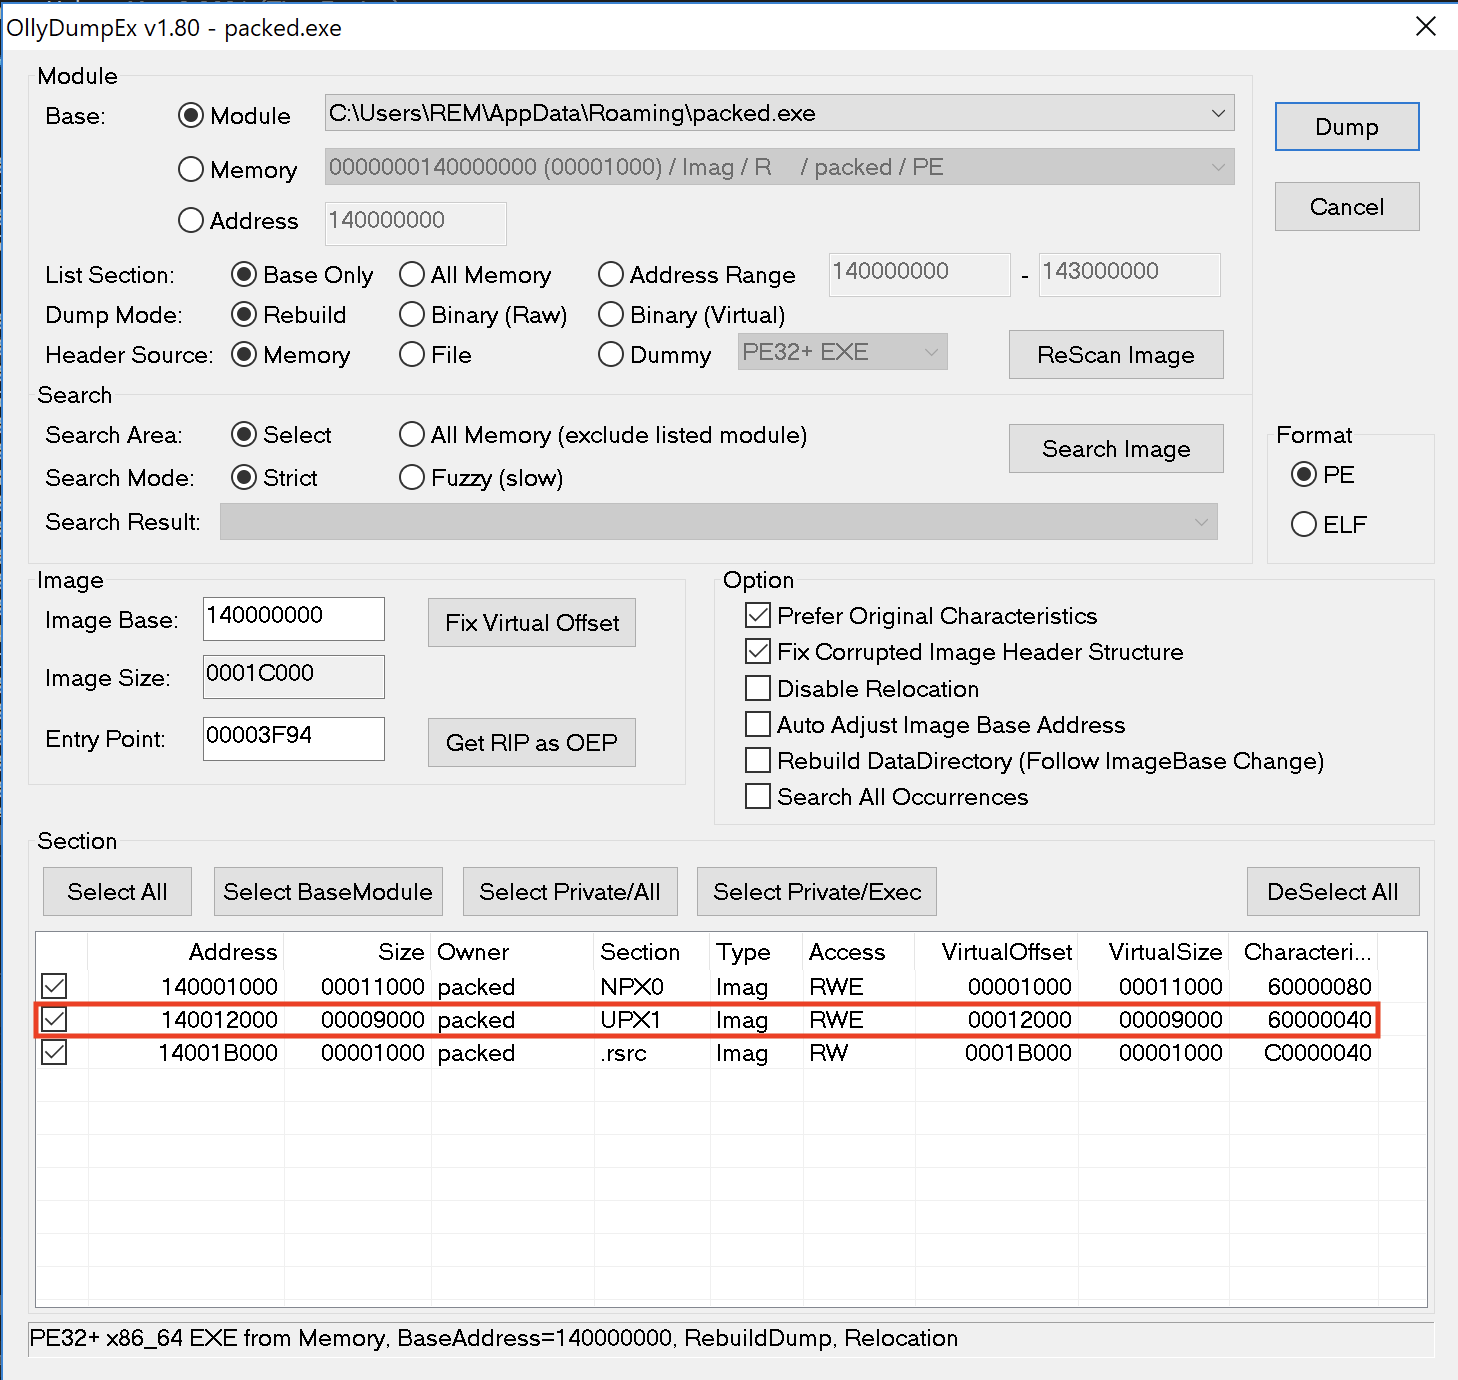
second entry of the below section UPX1
after double clicking the second section UPX1 we’ll get this window Edit section .
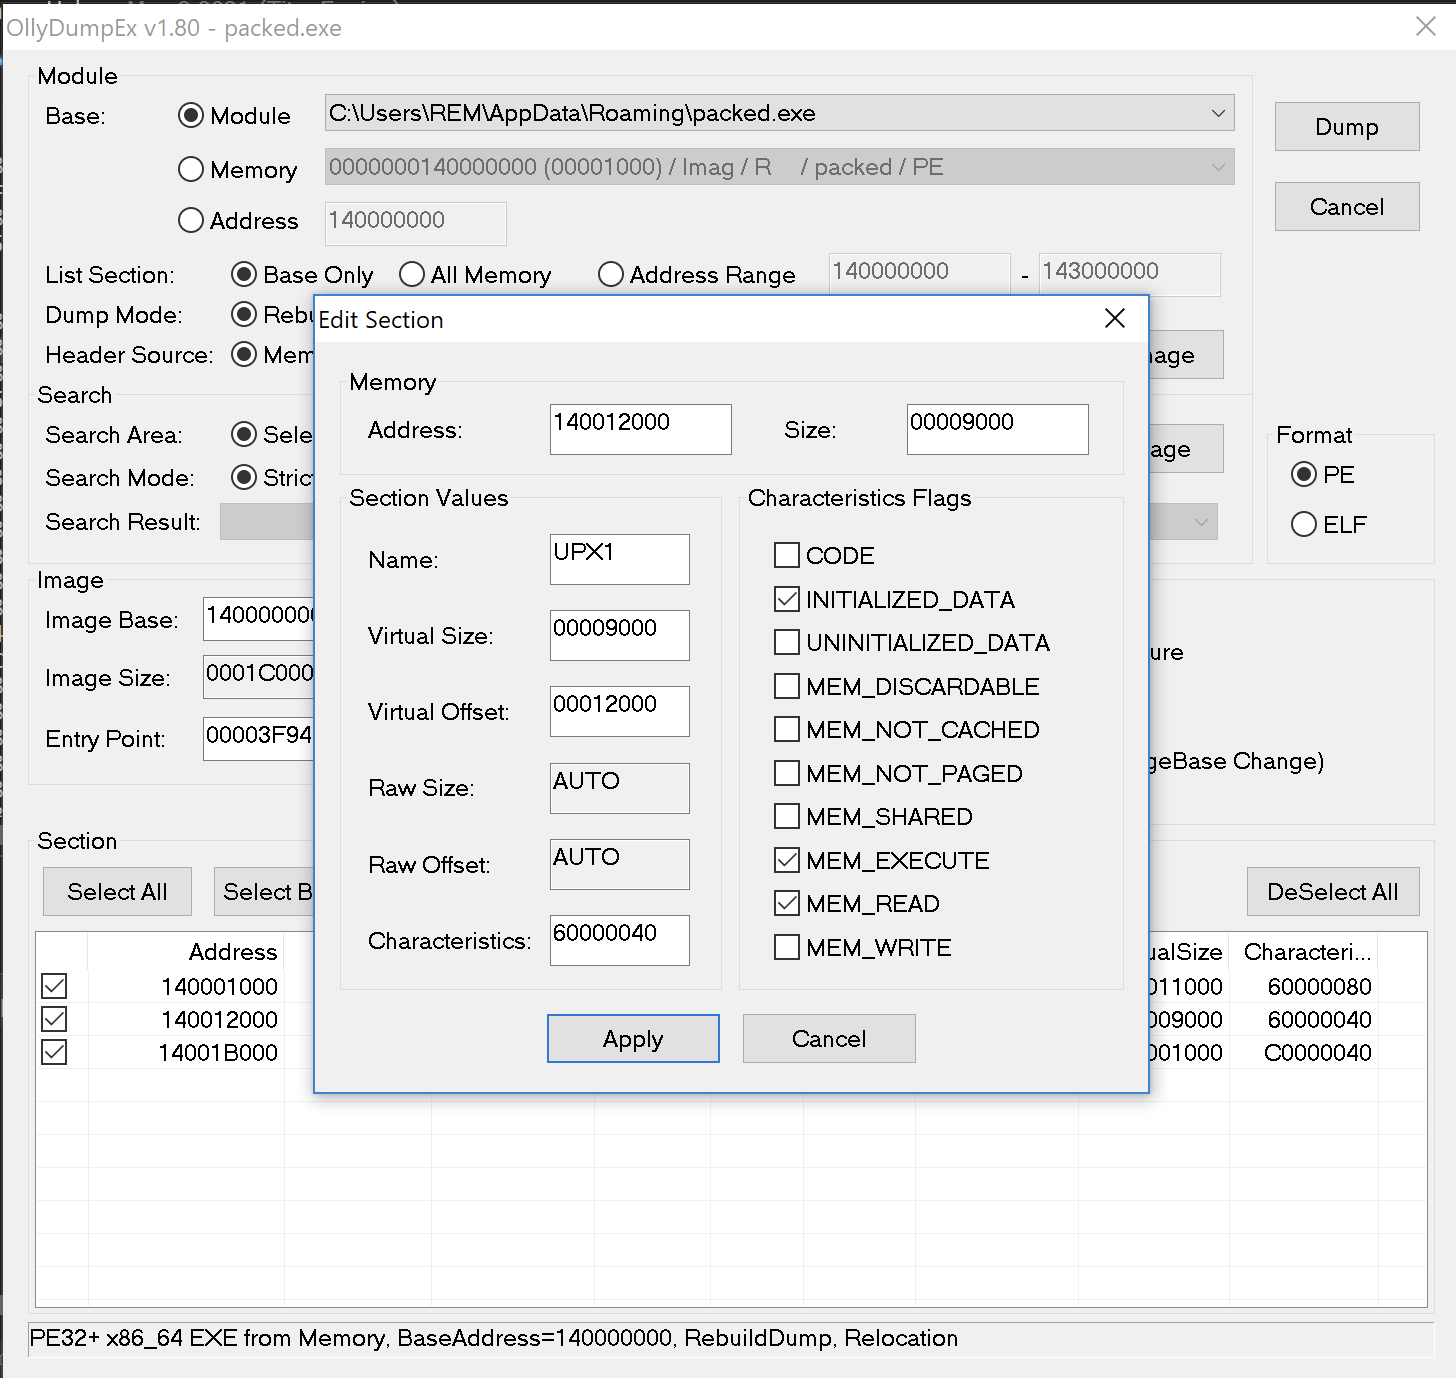
Edit Section window
we need to check MEM_WRITE the last entry on the right hand side like this and click Apply.
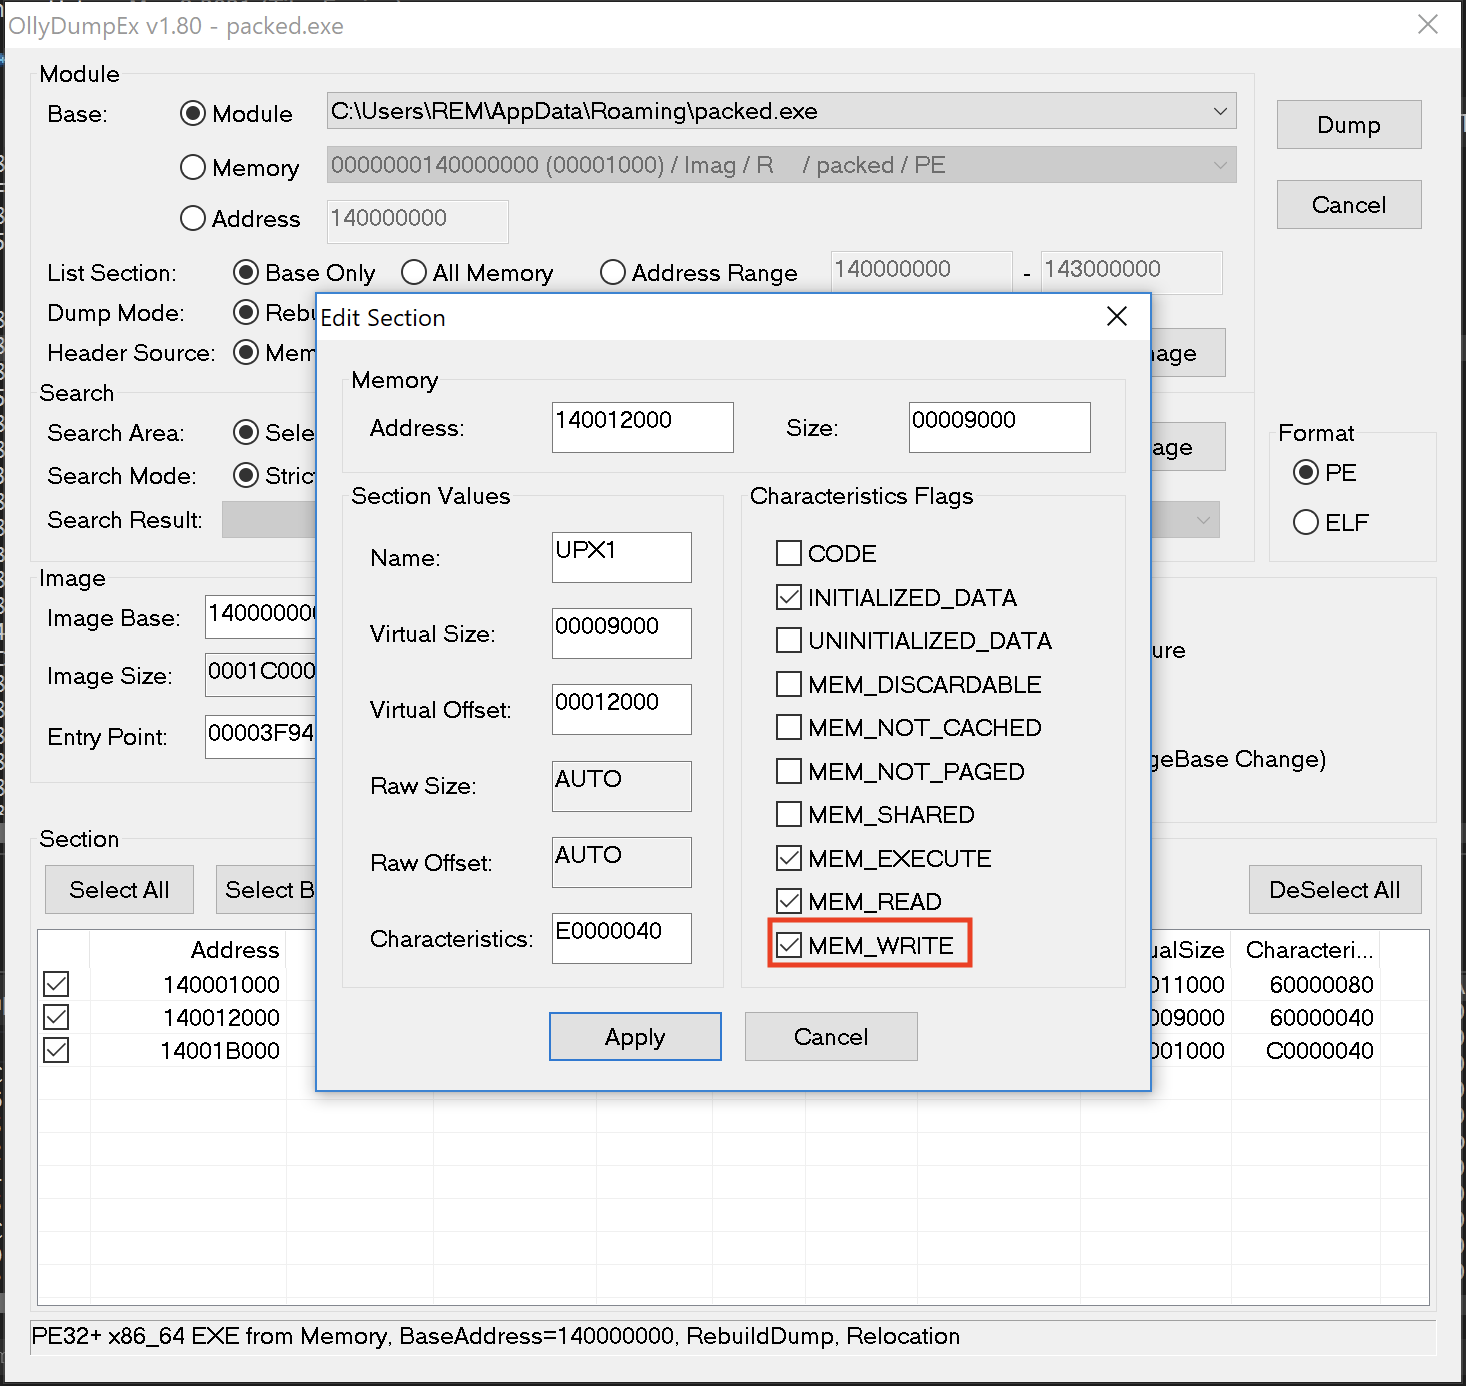
Checked MEM_WRITE
Those are the 2 changes you need to make before clicking Dump .
Get RIP as OEPNow click Dump and it already supplied a name packed_dump_64.exe. go ahead and click save.
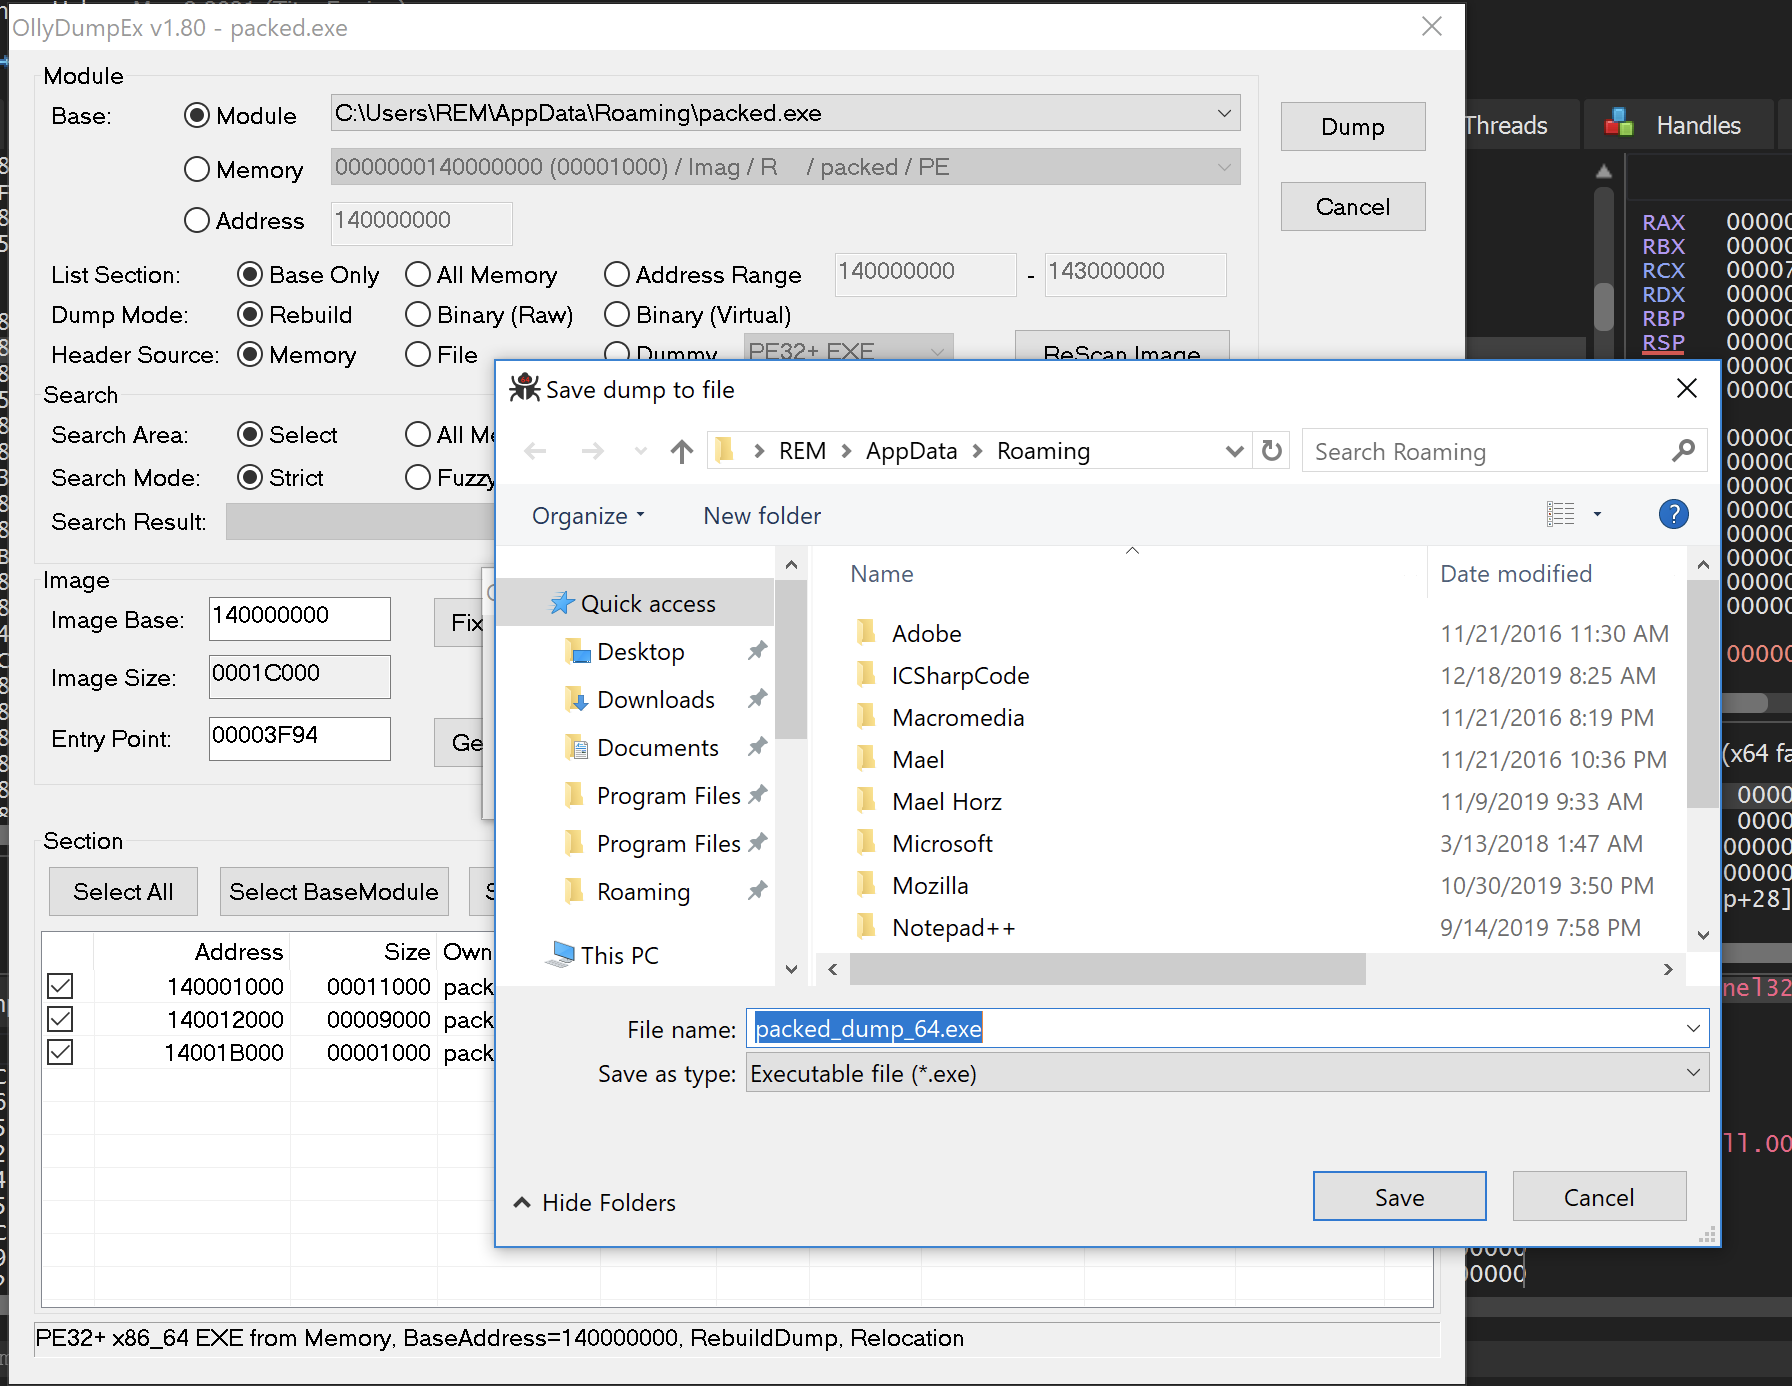
Dumping and saving the file named: packed_dump_64.exe
you will see dump ok window click finish.
Now we have a dumped program well it will still not run. Because OllyDumpEx even though it fixed the original entry point for us and it saved it in a disk format. It didn’t fixed the IAT Import Address Table. So we still need to fix the IAT.
Fixing the Import Address Table - IAT
For that we will use another plugin and that is Scylla . do not use the scylla that’s on your system. we are going to use the plugin because the plugin interacts with the debugger and understand what’s in the memory a little bit better.
Let’s run the Scylla plugin in X64dbg.
It automatically attached the program we are debugging so we don’t have to do it manually.
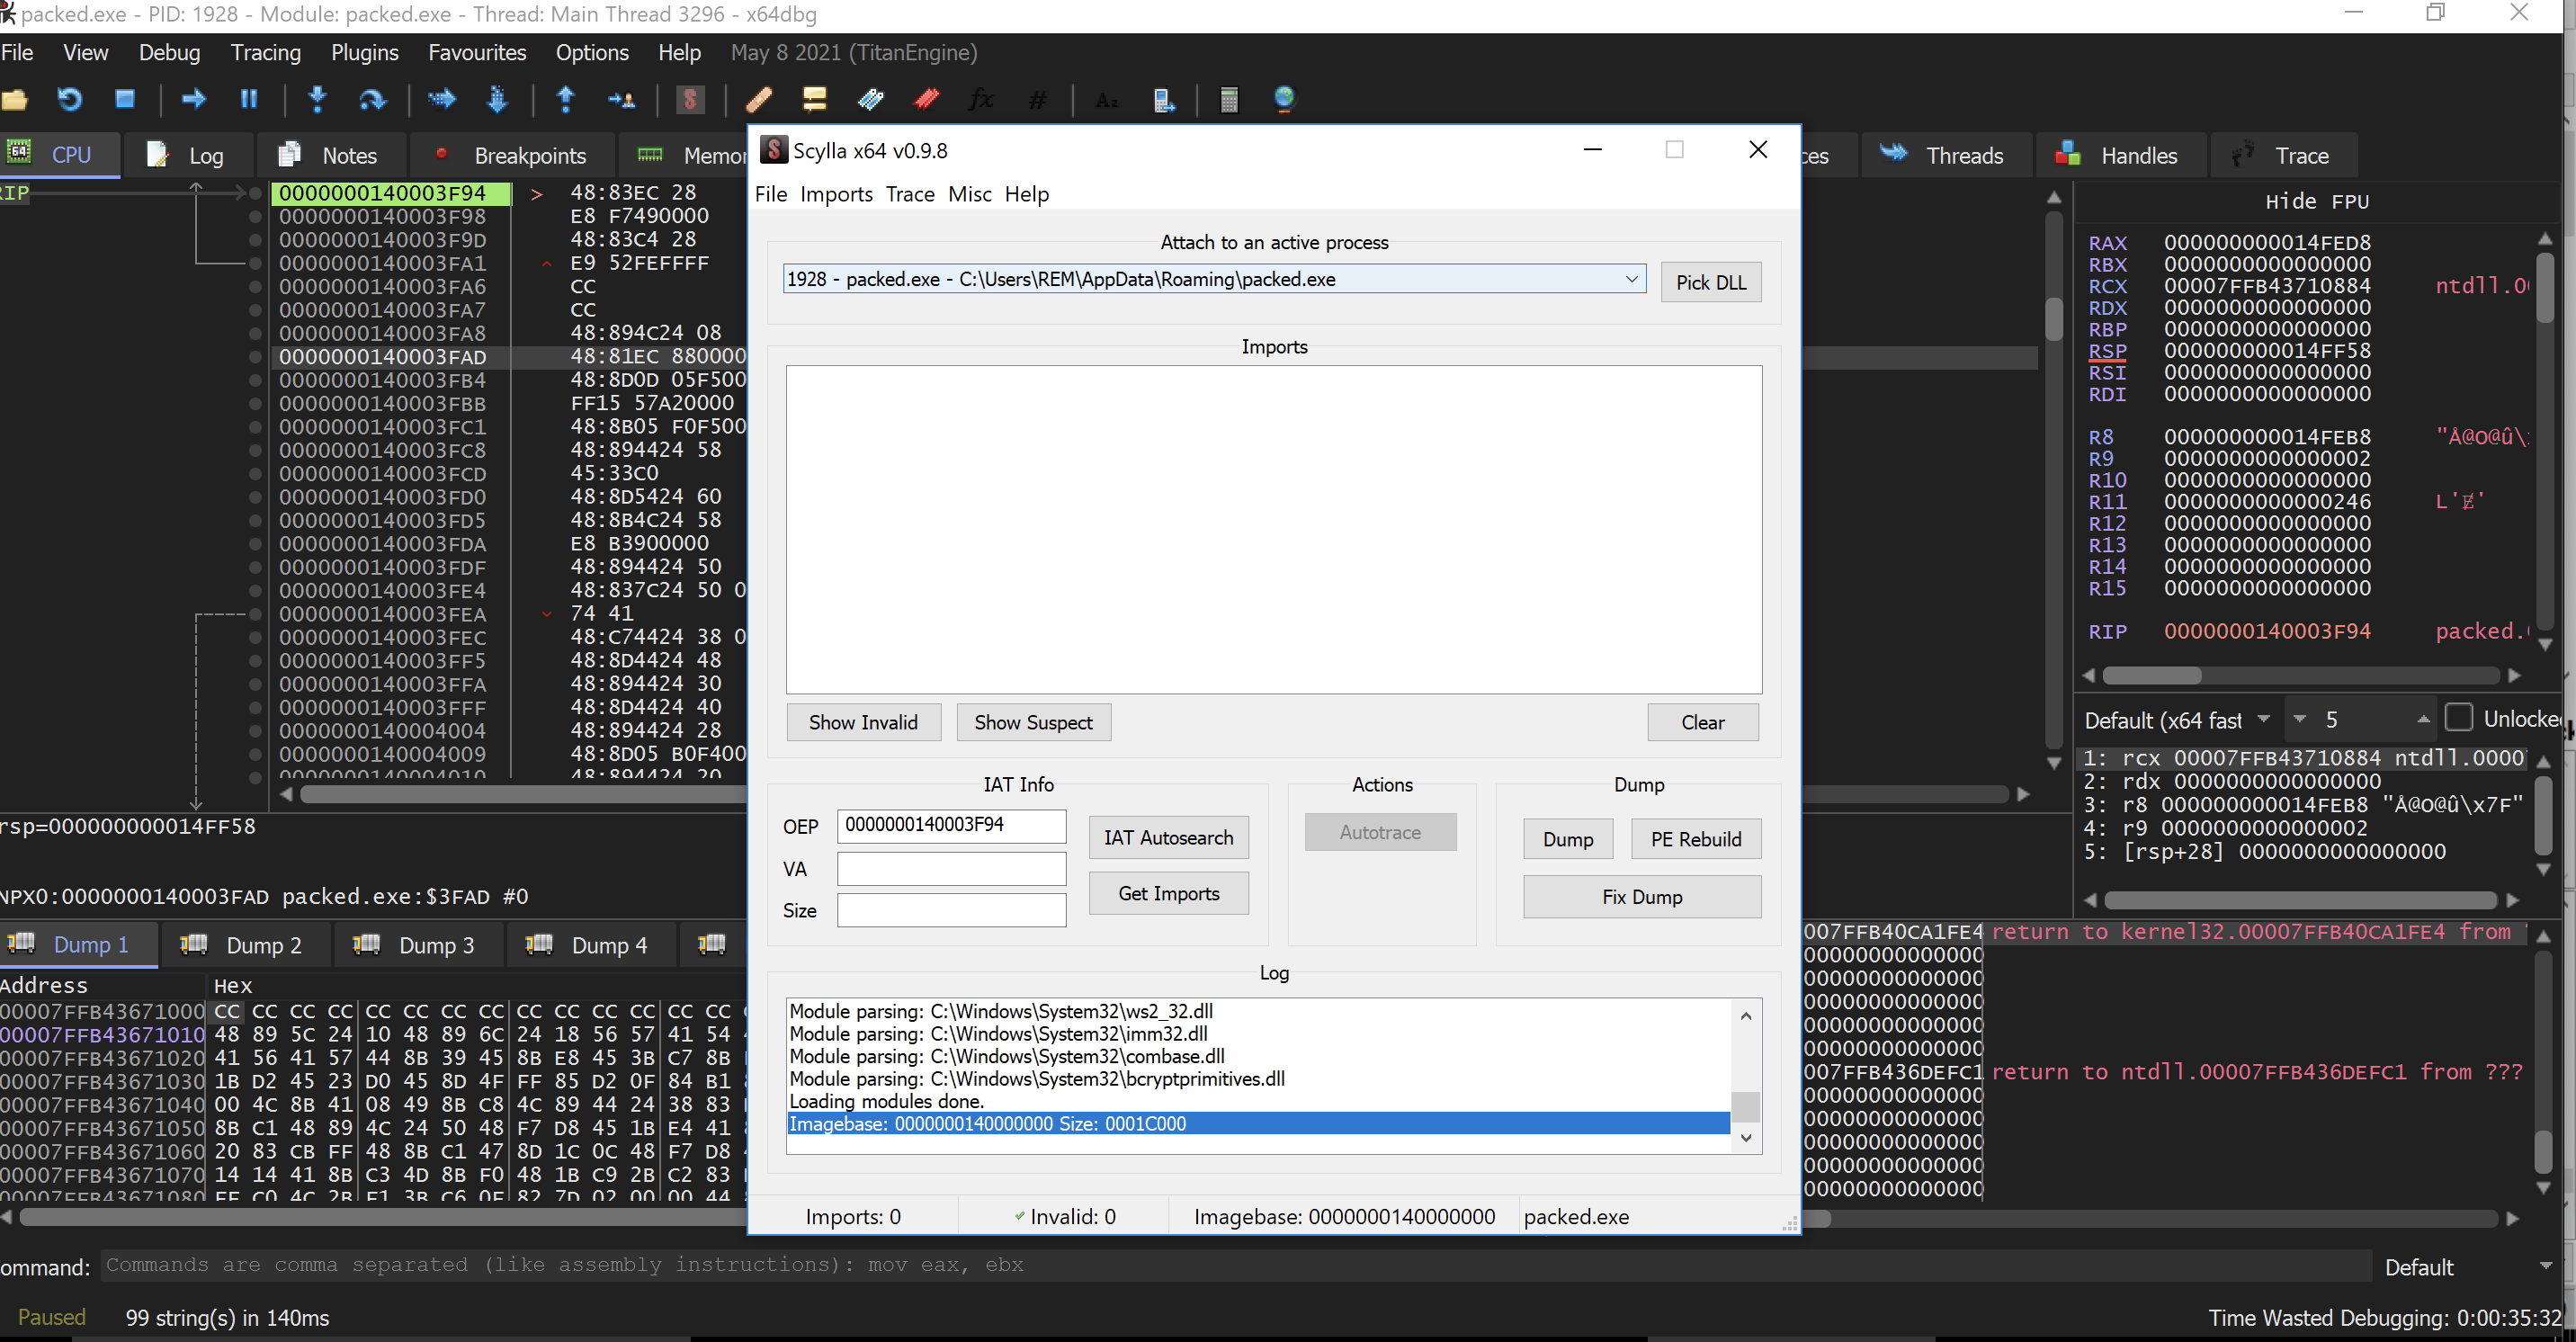
Scylla Plugin automatically attached the program we are debugging.
We also do not click dump.
we click IAT Auto search → Get Imports → Fix Dump in this order.
Click IAT Auto search click Yes to Advanced result. Now it did find IAT
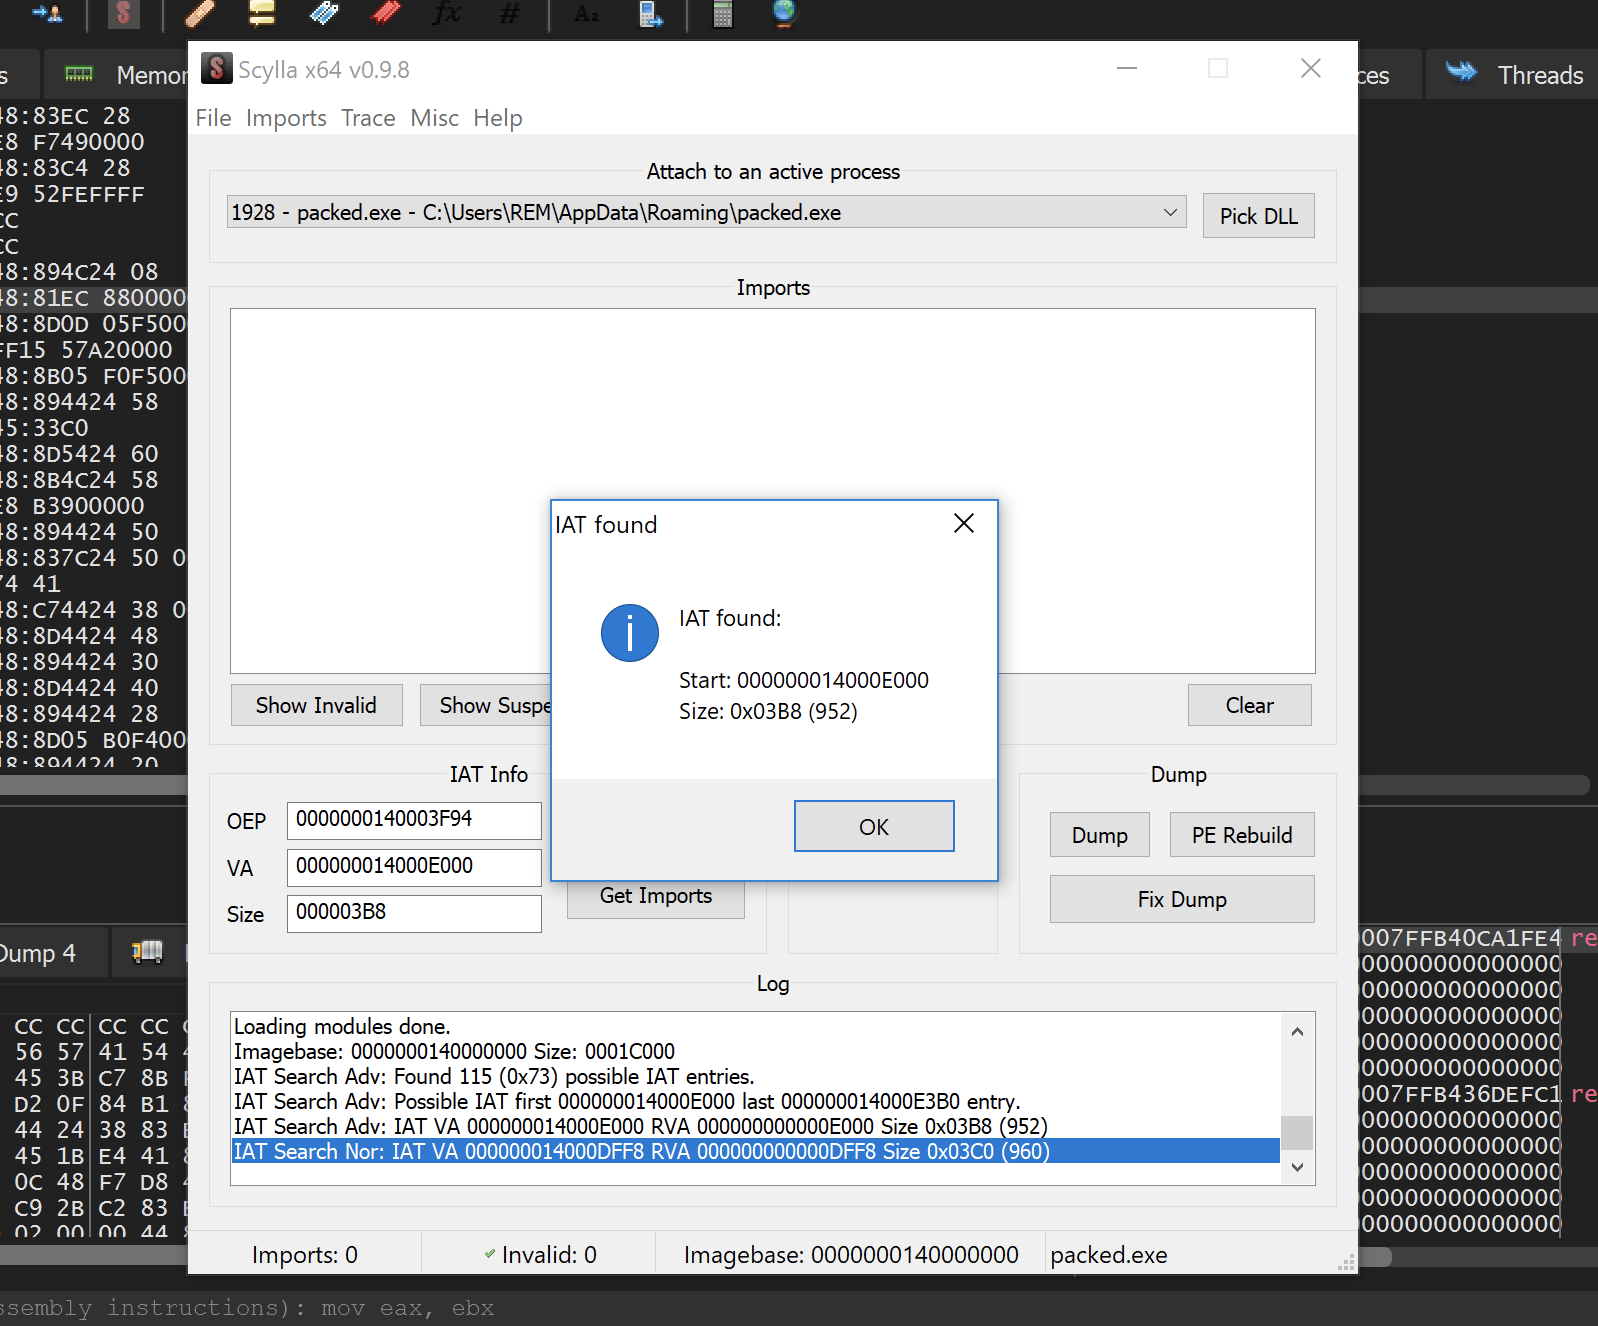
IAT Auto search found:
Now click on Get Imports . all the imports are green.
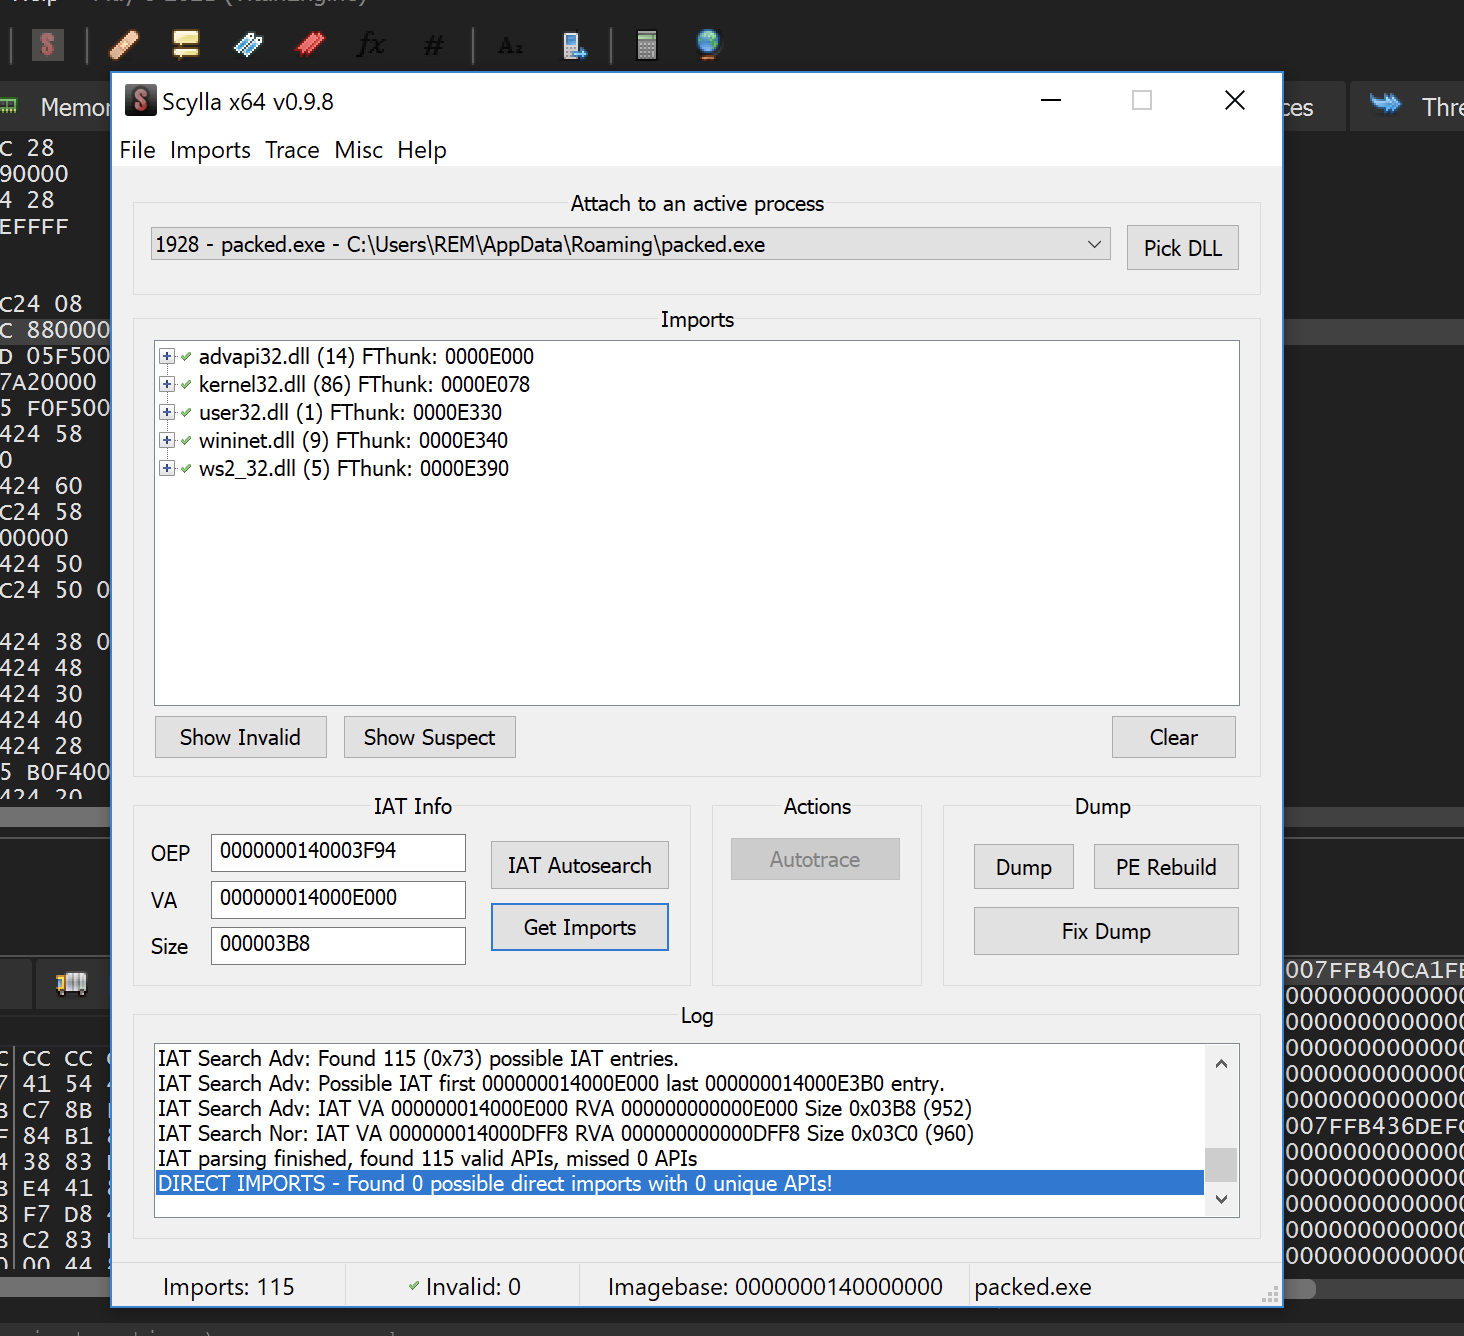
Get Imports: all the imports are green
Now click Fix dump and make sure to select the program that was dumped by OllyDumpEx which is packed_dump_64.exe and click open.
At the bottom it will say Import Rebuild success with a file named packed_dump_64_SCY.exe in the log window.
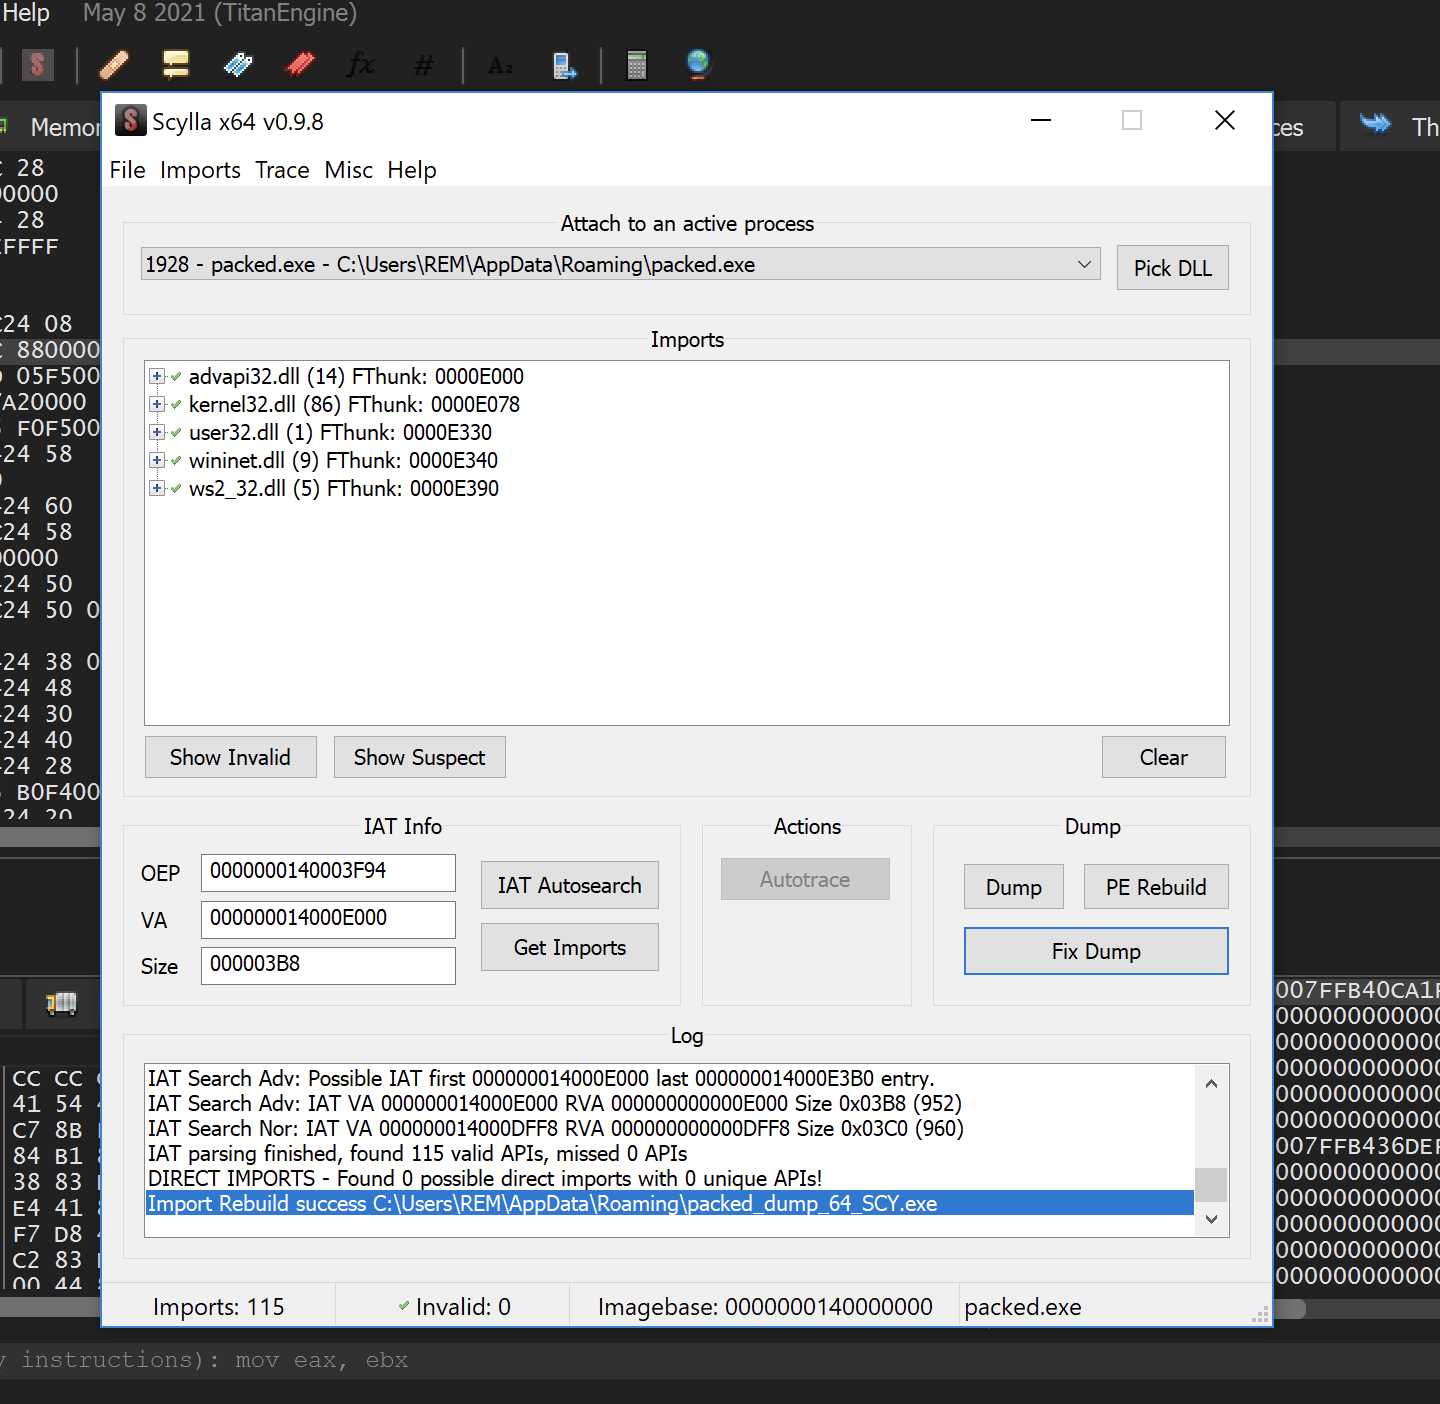
If you get to this point you can close the debugger, and make sure the sample is not running.
Now we have the file packed_dump_64_SCY.exe run it and see if it’s run……
and here in the process hacker we can see it sure enough it’s running.
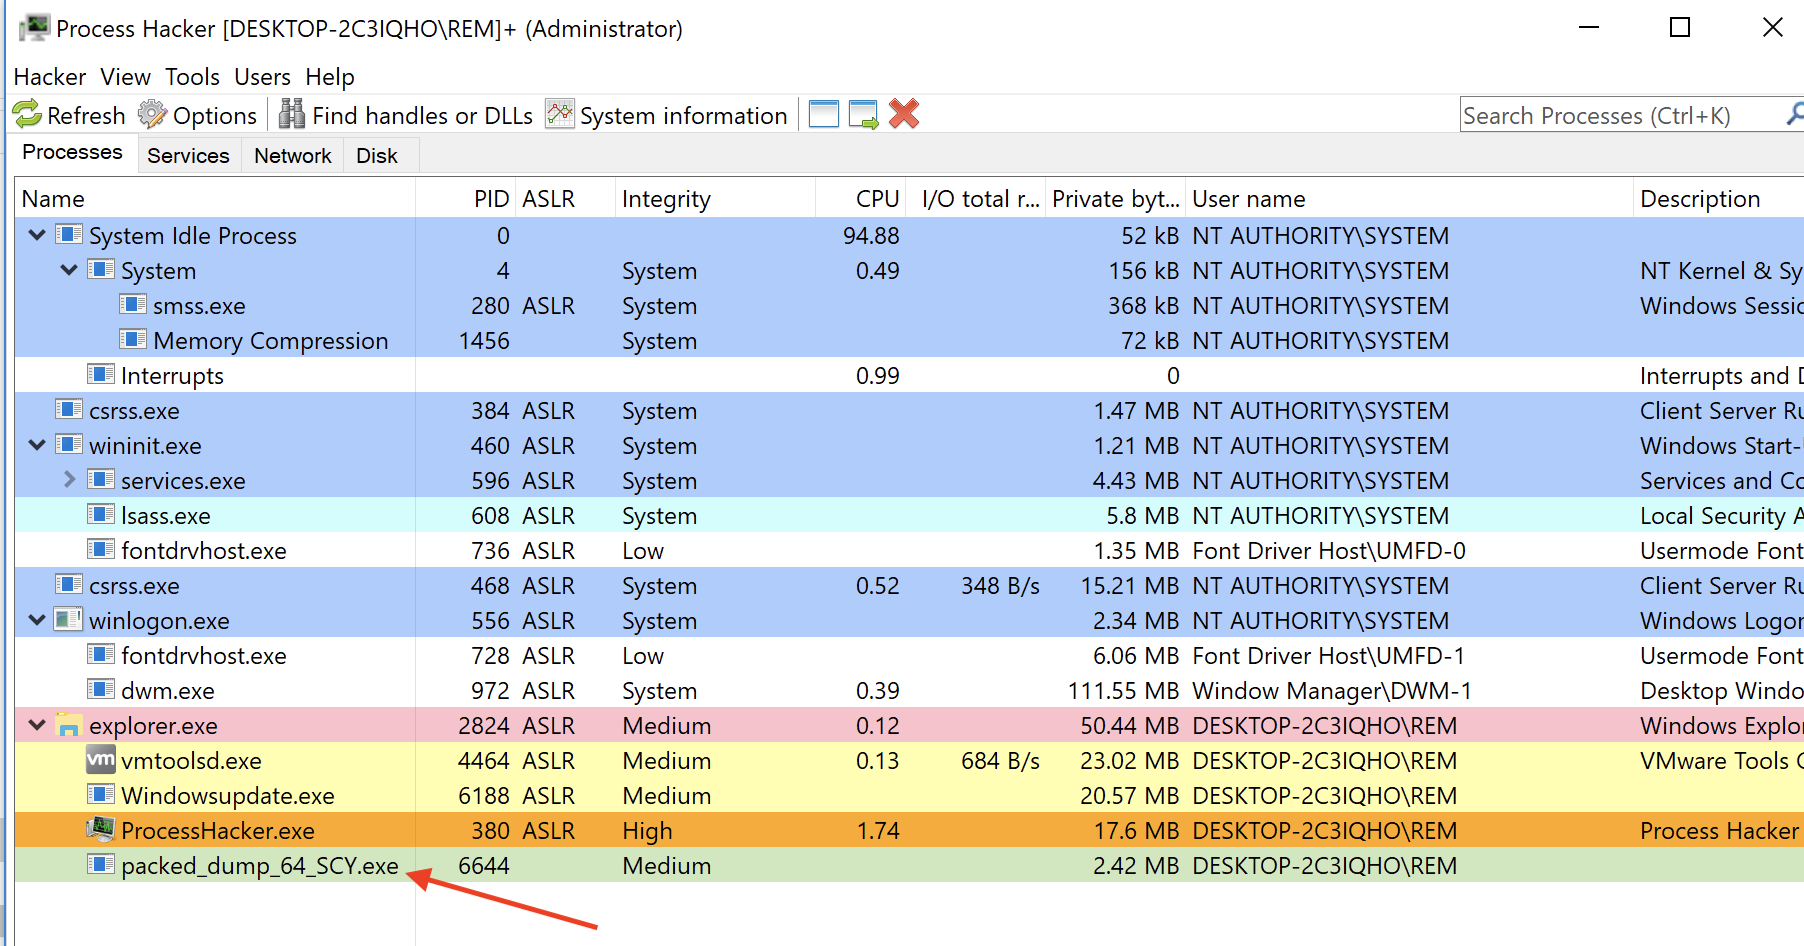
Process hacker: showing the sample packed_dump_64_SCY.exe is running
We now finally have a unpacked program.
Let’s drop the unpacked sample in PE studio to verify
In the sections the entry point is 0x00003F94 .
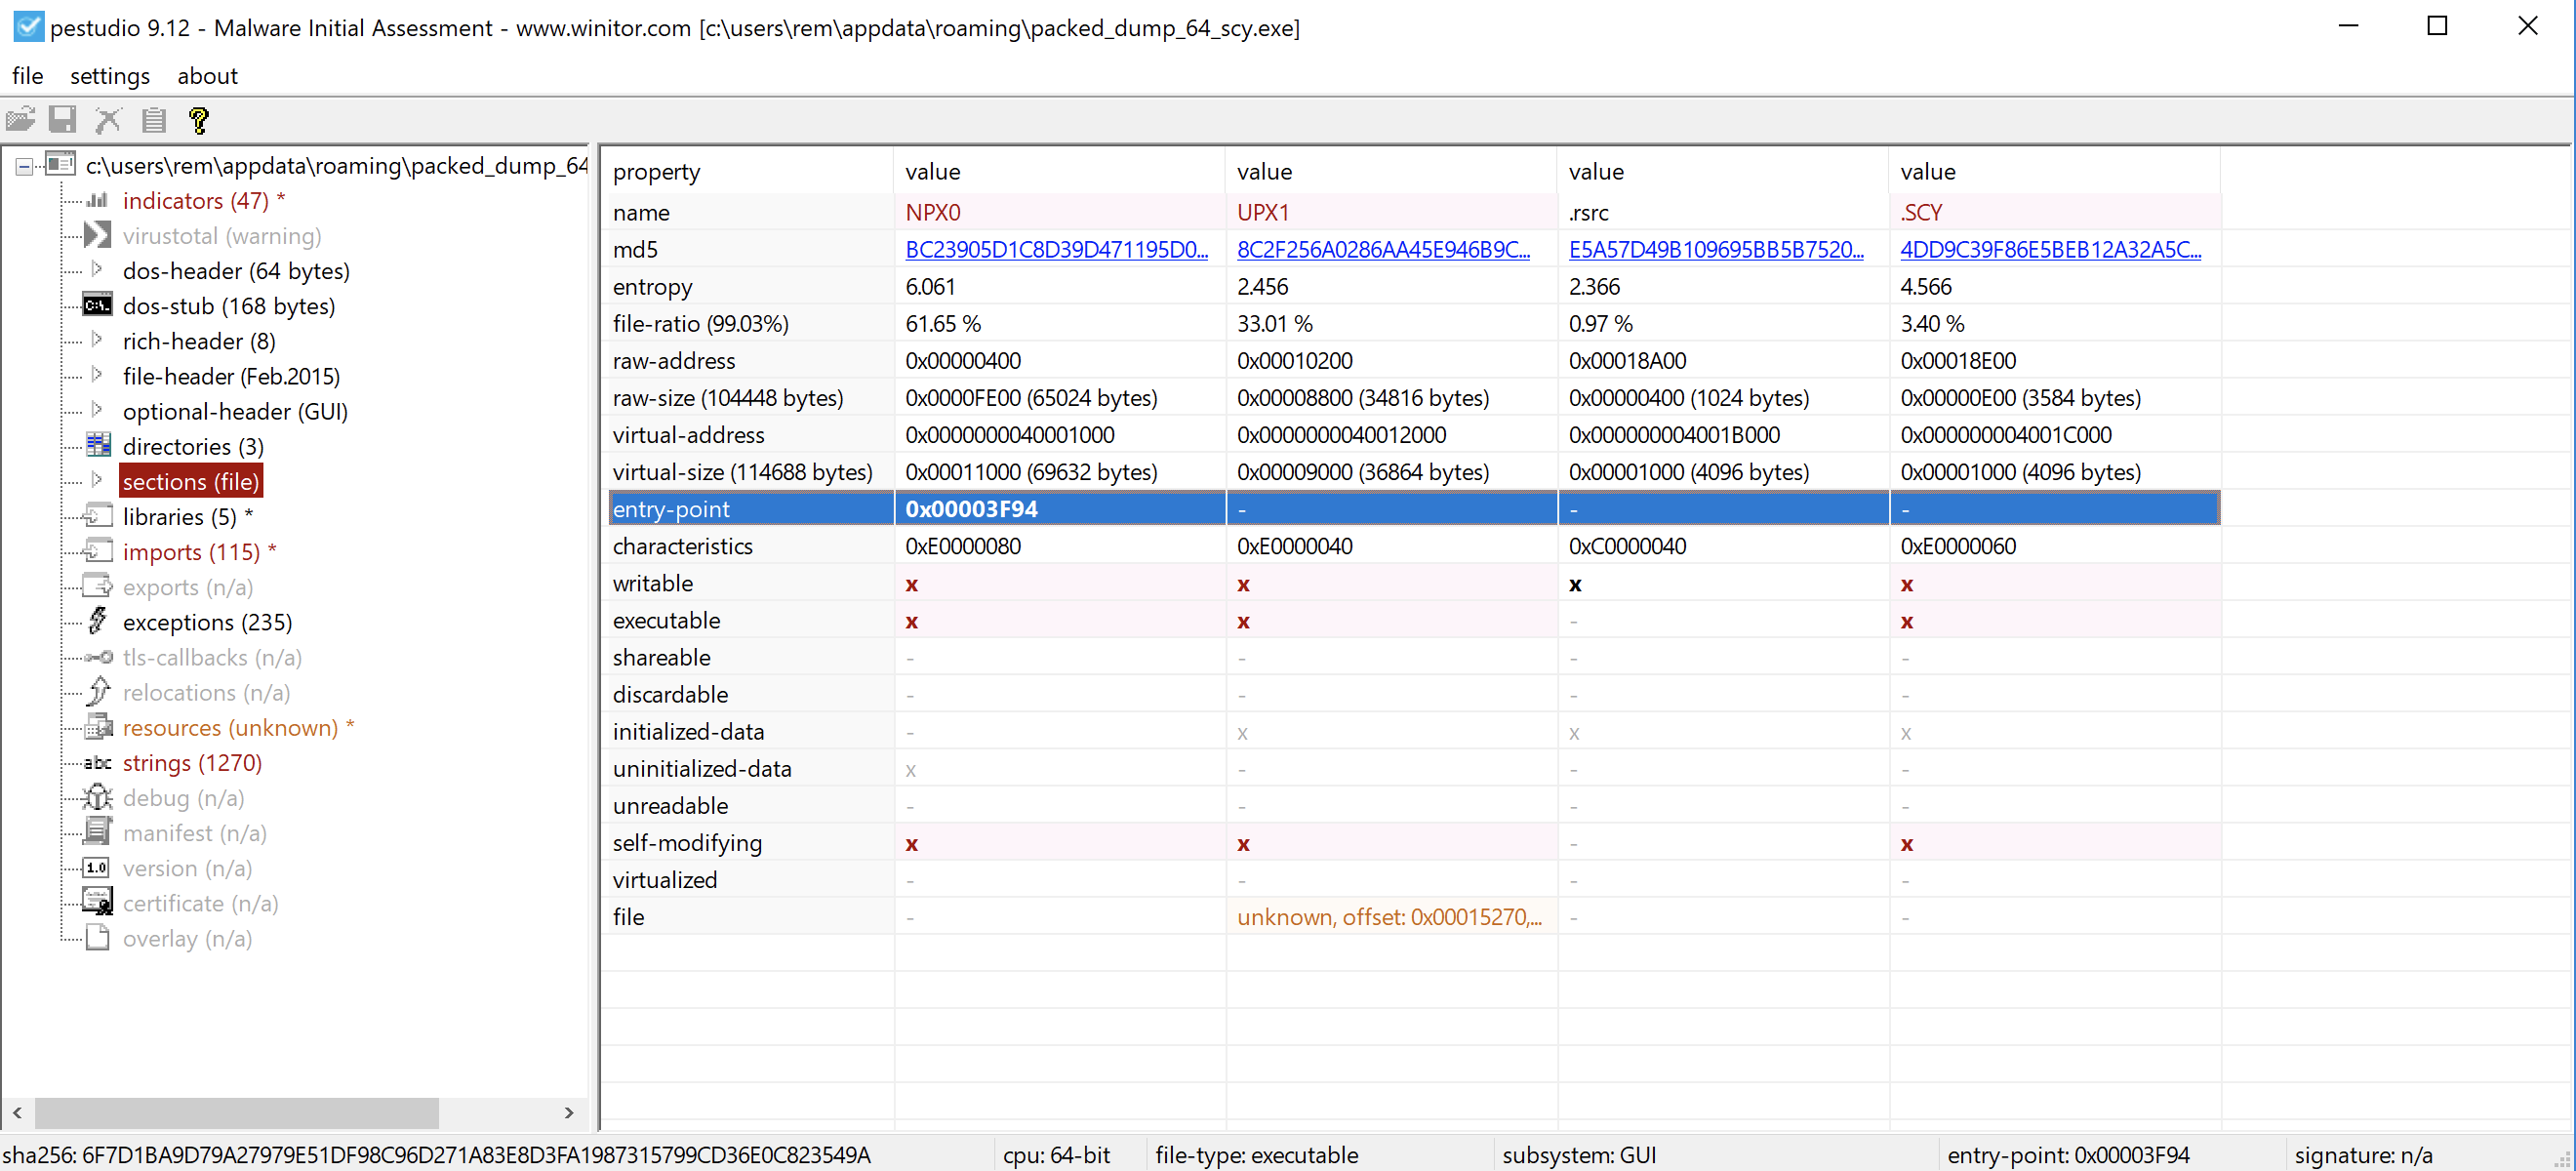
Pe studio - entry point of the packed_dump_64_SCY.exe is 0x00003F94
In the imports we have 115 counts. All those IAT’s were rebuild That’s the another sign of unpacked.
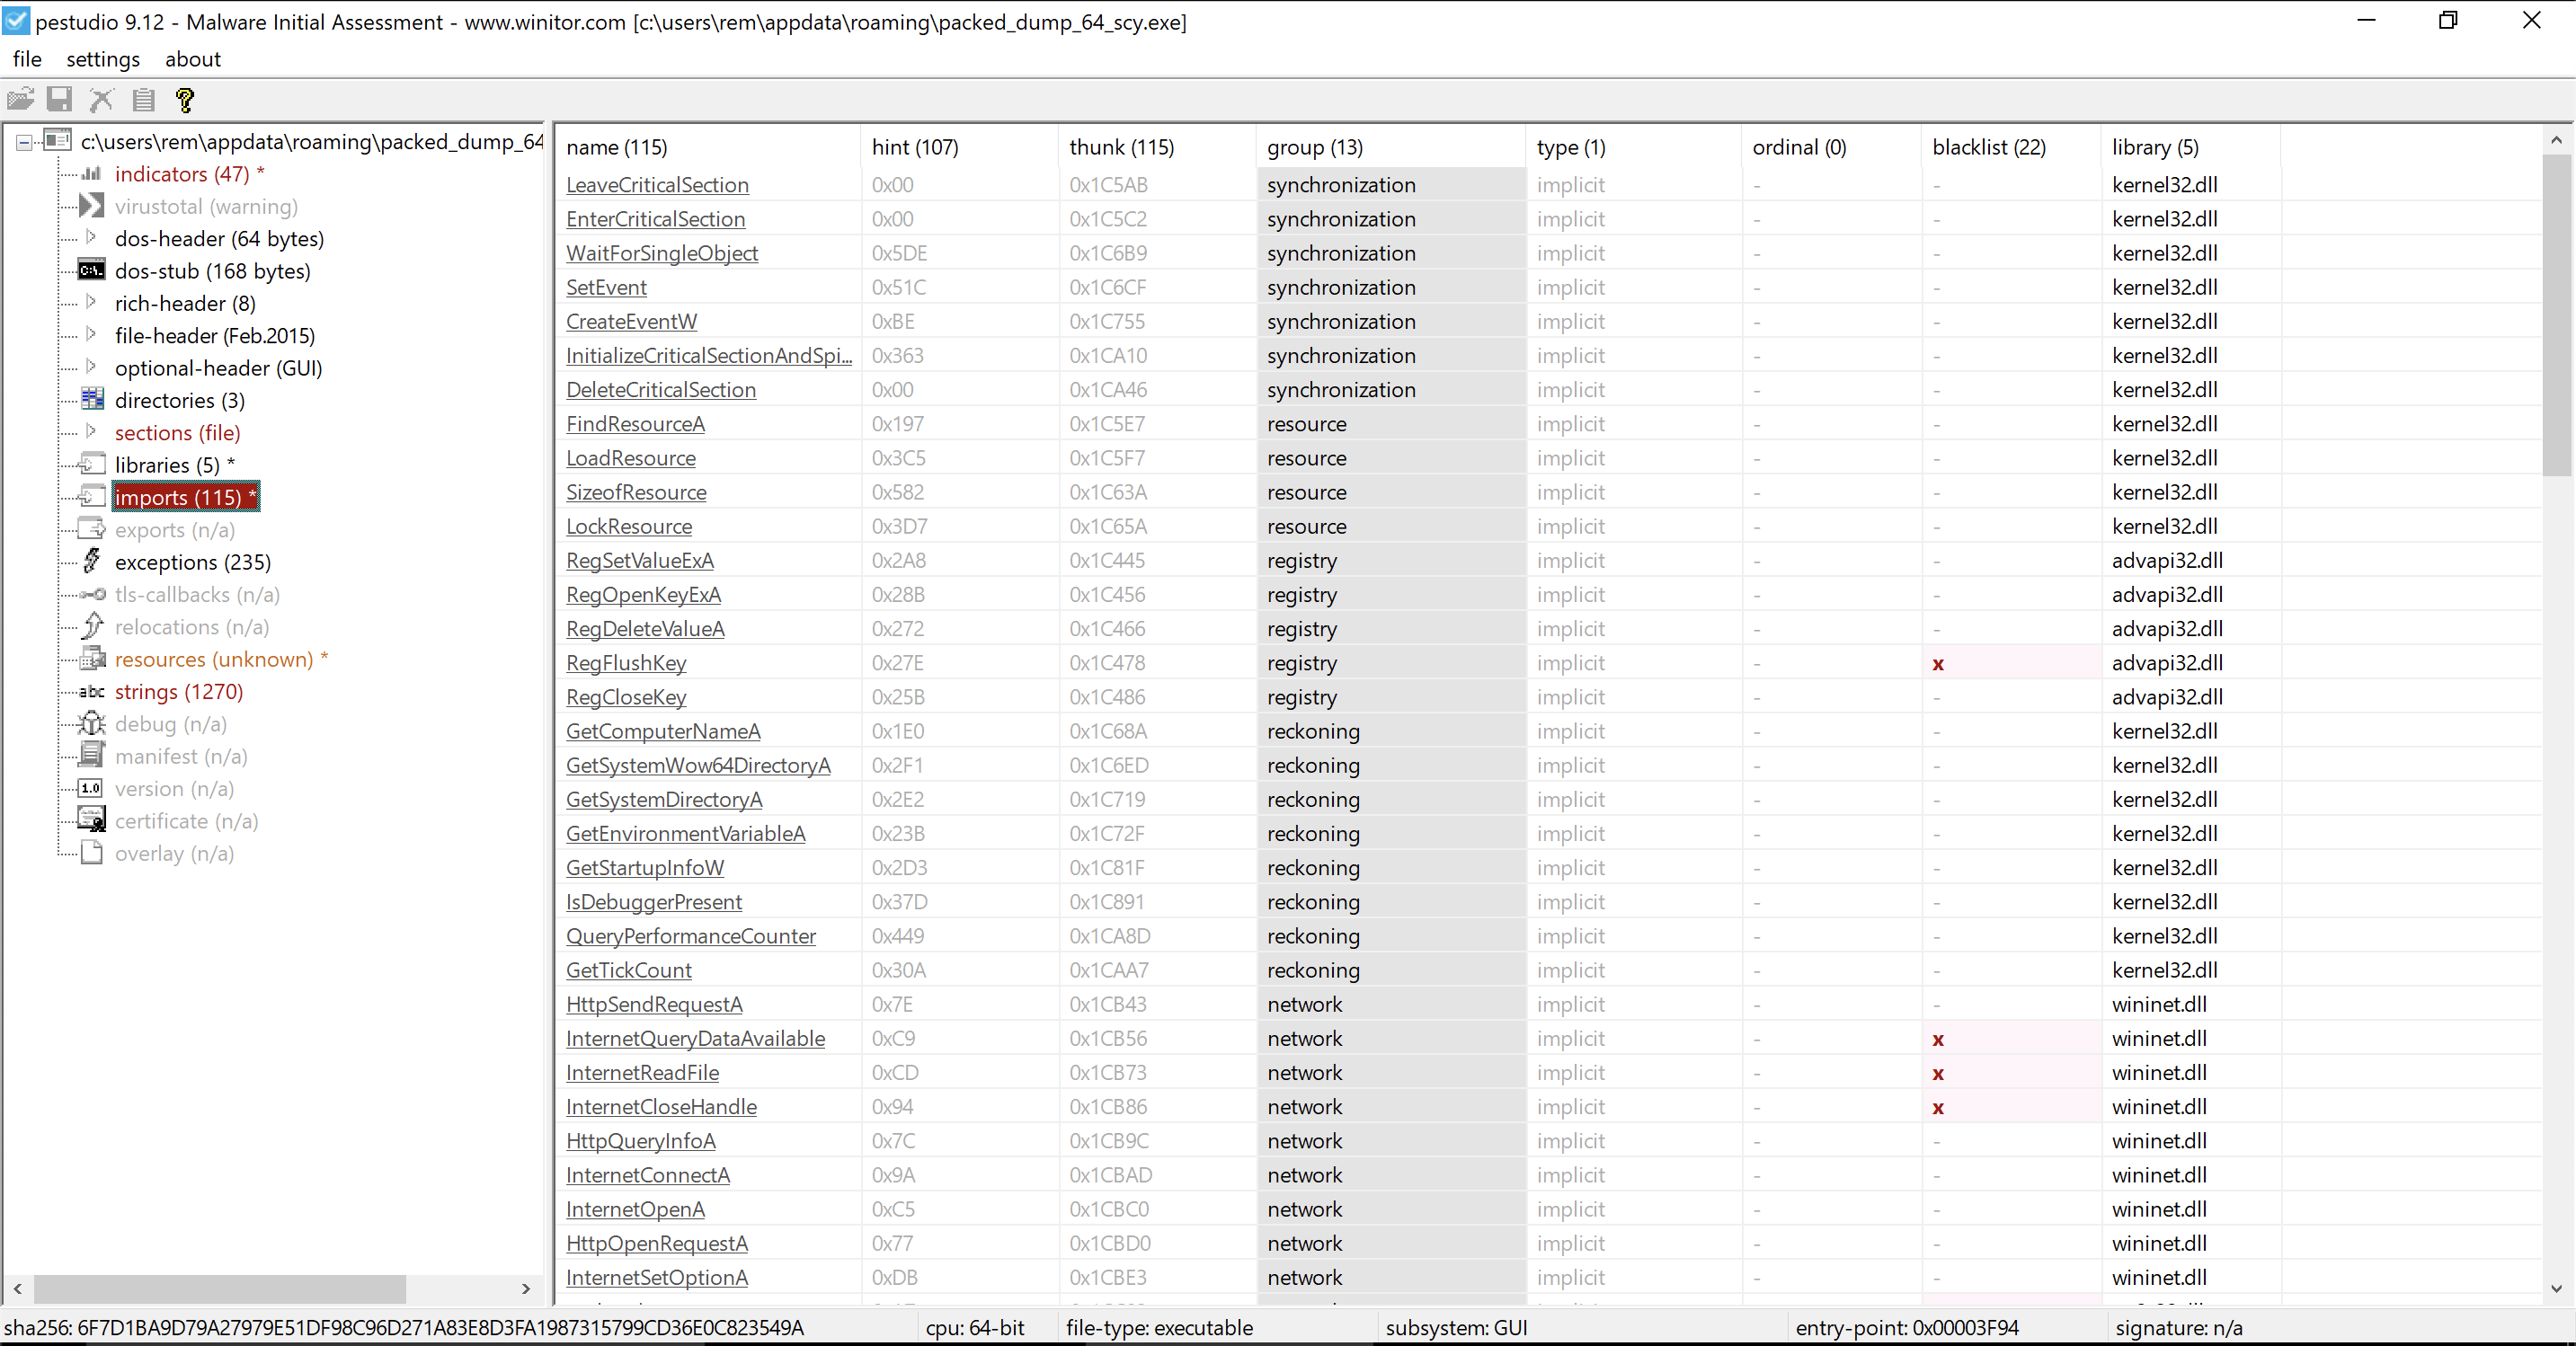
PE studio - Imports showing 115 counts.
In the strings we have now 1270 strings.
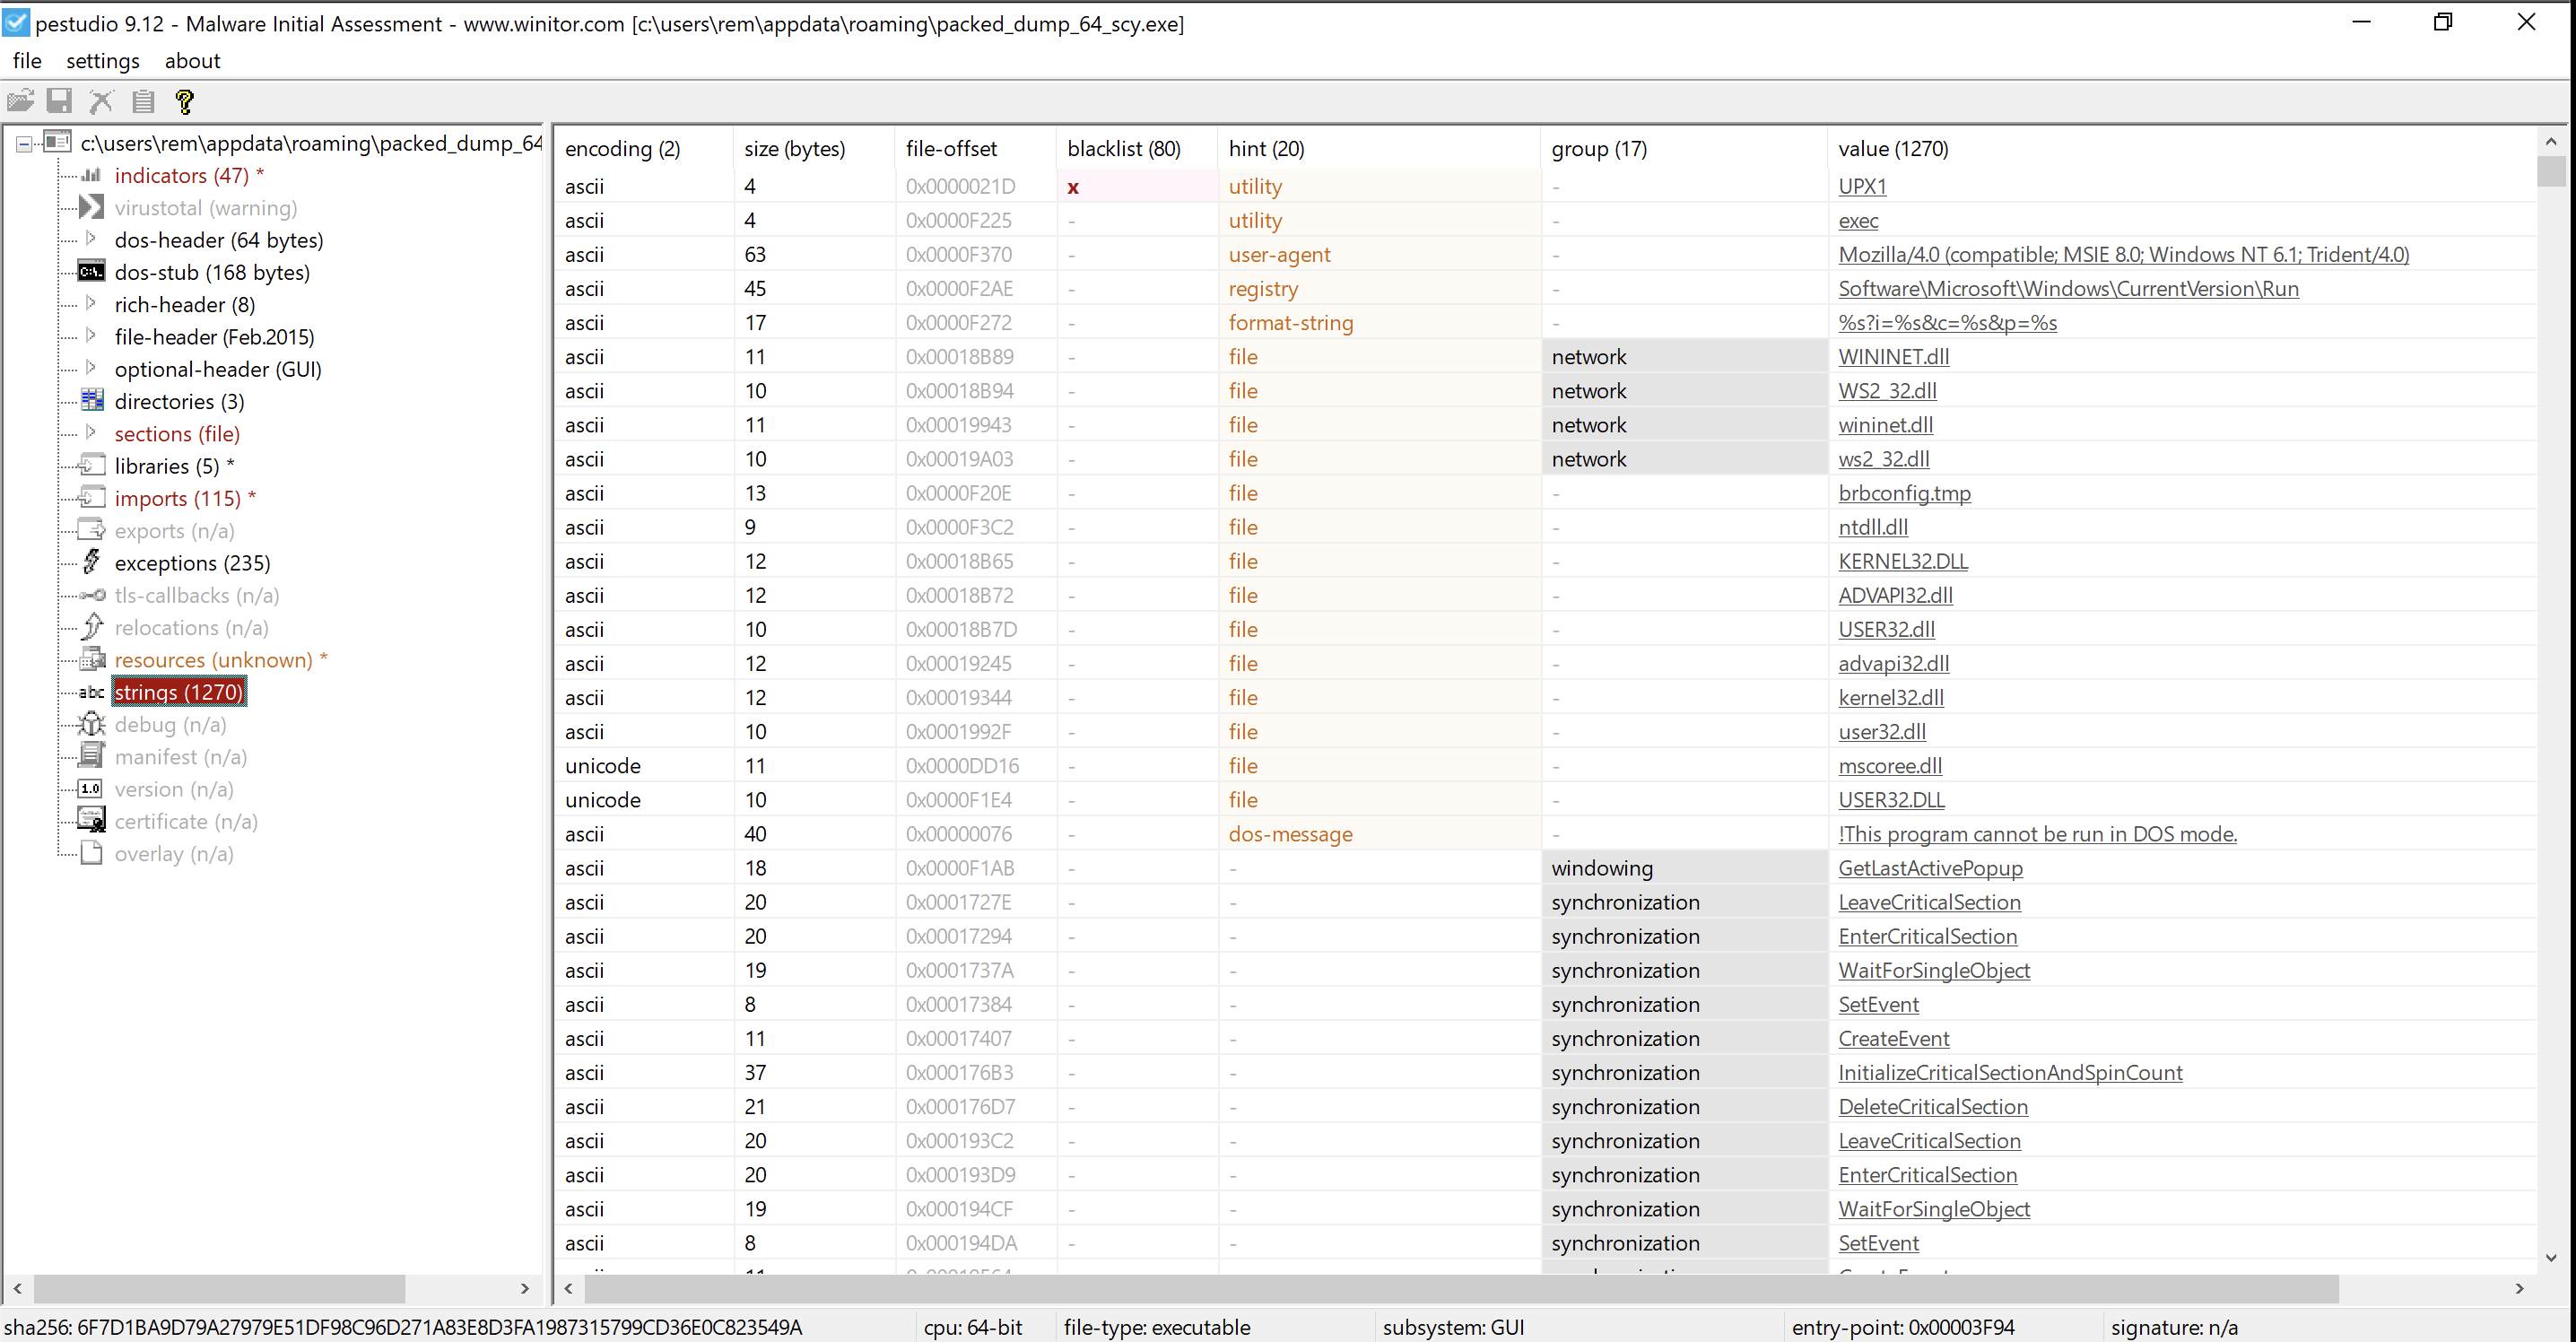
Pe studio Strings section - containing 1270 strings
Once again we verify it’s unpacked.