Executive Summary
This analysis focused on reversing a packed AutoIt malware sample that attempted to hide its real behavior using anti-debugging checks and runtime shellcode execution. During debugging in WinDbg, the malware was observed allocating executable RWX memory regions through VirtualAlloc(), which were later used to load shellcode into memory.
After bypassing the anti-debugging protection, the unpacked payload was dumped from memory using Process Hacker and analyzed further in Ghidra. The shellcode used dynamic API resolution, direct PEB access, and several low-level Windows APIs to avoid detection and make reverse engineering more difficult.
Overall, the sample demonstrates a typical multi-stage malware execution flow where an AutoIt wrapper is used to unpack and execute the real payload directly in memory.
Meta data
| Property | Value |
|---|---|
| MD5 | 66f33597cbf097345c51891ab951b641 |
| SHA-1 | 70ad543faecb496ca4c2318e0c8f81a8cbb8fb62 |
| SHA-256 | 0da91175e7d72a7ff2bcb3fd93f2ba7bbe4045f9c4dee5c9685c7fdf6da622a6 |
| Vhash | 016056655d15756210b02002300a46z161d013zf2za0030e039z |
| Authentihash | 619ac3cb903ba13a21eeba83e7357c599c49da585258a25a567262efd08d4e3d |
| Imphash | afcdf79be1557326c854b6e20cb900a7 |
| Rich PE Header Hash | a0bd59ea5981b6d23e0416f2dece72bc |
| SSDEEP | 24576:Pu6J33O0c+JY5UZ+XC0kGso6FaODoki222F0Eci4GIxmWY:5u0c++OCvkGs9FaOHN22F9QY |
| TLSH | T1B745CF2263DDC360CB669173BF2AB7057EBF7C614630B85B2F880D7DA950161262D7A3 |
| File Type | Win32 EXE |
| Tags | executable, windows, win32, pe, peexe |
| Magic | PE32 executable (GUI) Intel 80386, for MS Windows |
| TrID | Win64 Executable (generic) (32.2%)Win32 Dynamic Link Library (generic) (20.1%)Win16 NE executable (generic) (15.4%)Win32 Executable (generic) (13.7%)OS/2 Executable (generic) (6.2%) |
| Detect It Easy (DIE) | PE32Library: AutoIt (3.XX)Compiler: EP:Microsoft Visual C/C++ (2013-2017) [EXE32]Compiler: Microsoft Visual C/C++ (18.00.31101) [POGO_O_CPP]Linker: Microsoft Linker (12.00.31101)Tool: Visual Studio (2013) |
| Magika | PEBIN |
| File Size | 1.16 MB (1217024 bytes) |
Libraries
| DLL Name | Suspicious | Load Type | Imports | Description |
|---|---|---|---|---|
WSOCK32.dll | x | Implicit | 23 | Windows Socket 32-Bit Library |
VERSION.dll | - | Implicit | 3 | Version Checking and File Installation Library |
WINMM.dll | x | Implicit | 3 | Windows Management Library |
COMCTL32.dll | - | Implicit | 11 | Common Controls Library |
MPR.dll | x | Implicit | 4 | Multiple Provider Router Library |
WININET.dll | x | Implicit | 14 | Internet Extensions for Win32 Library |
PSAPI.DLL | x | Implicit | 1 | DHCP Server API Stub Library |
IPHLPAPI.DLL | x | Implicit | 3 | IP Helper API |
USERENV.dll | - | Implicit | 4 | User Environment Library |
UxTheme.dll | - | Implicit | 1 | Microsoft UxTheme Library |
KERNEL32.dll | - | Implicit | 164 | Windows NT BASE API Client |
USER32.dll | - | Implicit | 160 | Multi-User Windows USER API Client Library |
GDI32.dll | - | Implicit | 35 | GDI Client Library |
COMDLG32.dll | - | Implicit | 2 | Common Dialogs Library |
ADVAPI32.dll | - | Implicit | 33 | Advanced Windows 32 Base API |
SHELL32.dll | - | Implicit | 15 | Windows Shell Library |
ole32.dll | - | Implicit | 22 | Microsoft OLE for Windows |
OLEAUT32.dll | - | Implicit | 29 | oleaut32 library |
Sections
| Property | .text | .rdata | .data | .rsrc | .reloc |
|---|---|---|---|---|---|
| Section Name | .text | .rdata | .data | .rsrc | .reloc |
| Unknown | n/a | n/a | n/a | ||
| Entropy | 6.676 | 6.779 | |||
| File Ratio (99.92%) | 47.75% | 15.52% | 1.72% | 32.52% | 2.40% |
| Raw Address (Begin) | 0x00000400 | 0x0008E200 | 0x000BC400 | 0x000C1600 | 0x00122000 |
| Raw Address (End) | 0x0008E200 | 0x000BC400 | 0x000C1600 | 0x00122000 | 0x00129200 |
| Raw Size (1216000 bytes) | 0x0008DE00 (581120 bytes) | 0x0002E200 (188928 bytes) | 0x00005200 (20992 bytes) | 0x00060A00 (395776 bytes) | 0x00007200 (29184 bytes) |
| Virtual Address (Begin) | 0x00001000 | 0x0008F000 | 0x000BE000 | 0x000C7000 | 0x00128000 |
| Virtual Address (End) | 0x0008ECC4 | 0x000BD10E | 0x000C6F74 | 0x00127908 | 0x0012F11C |
| Virtual Size (1230698 bytes) | 0x0008DCC4 (580804 bytes) | 0x0002E10E (188686 bytes) | 0x00008F74 (36724 bytes) | 0x00060908 (395528 bytes) | 0x0000711C (28956 bytes) |
DIE
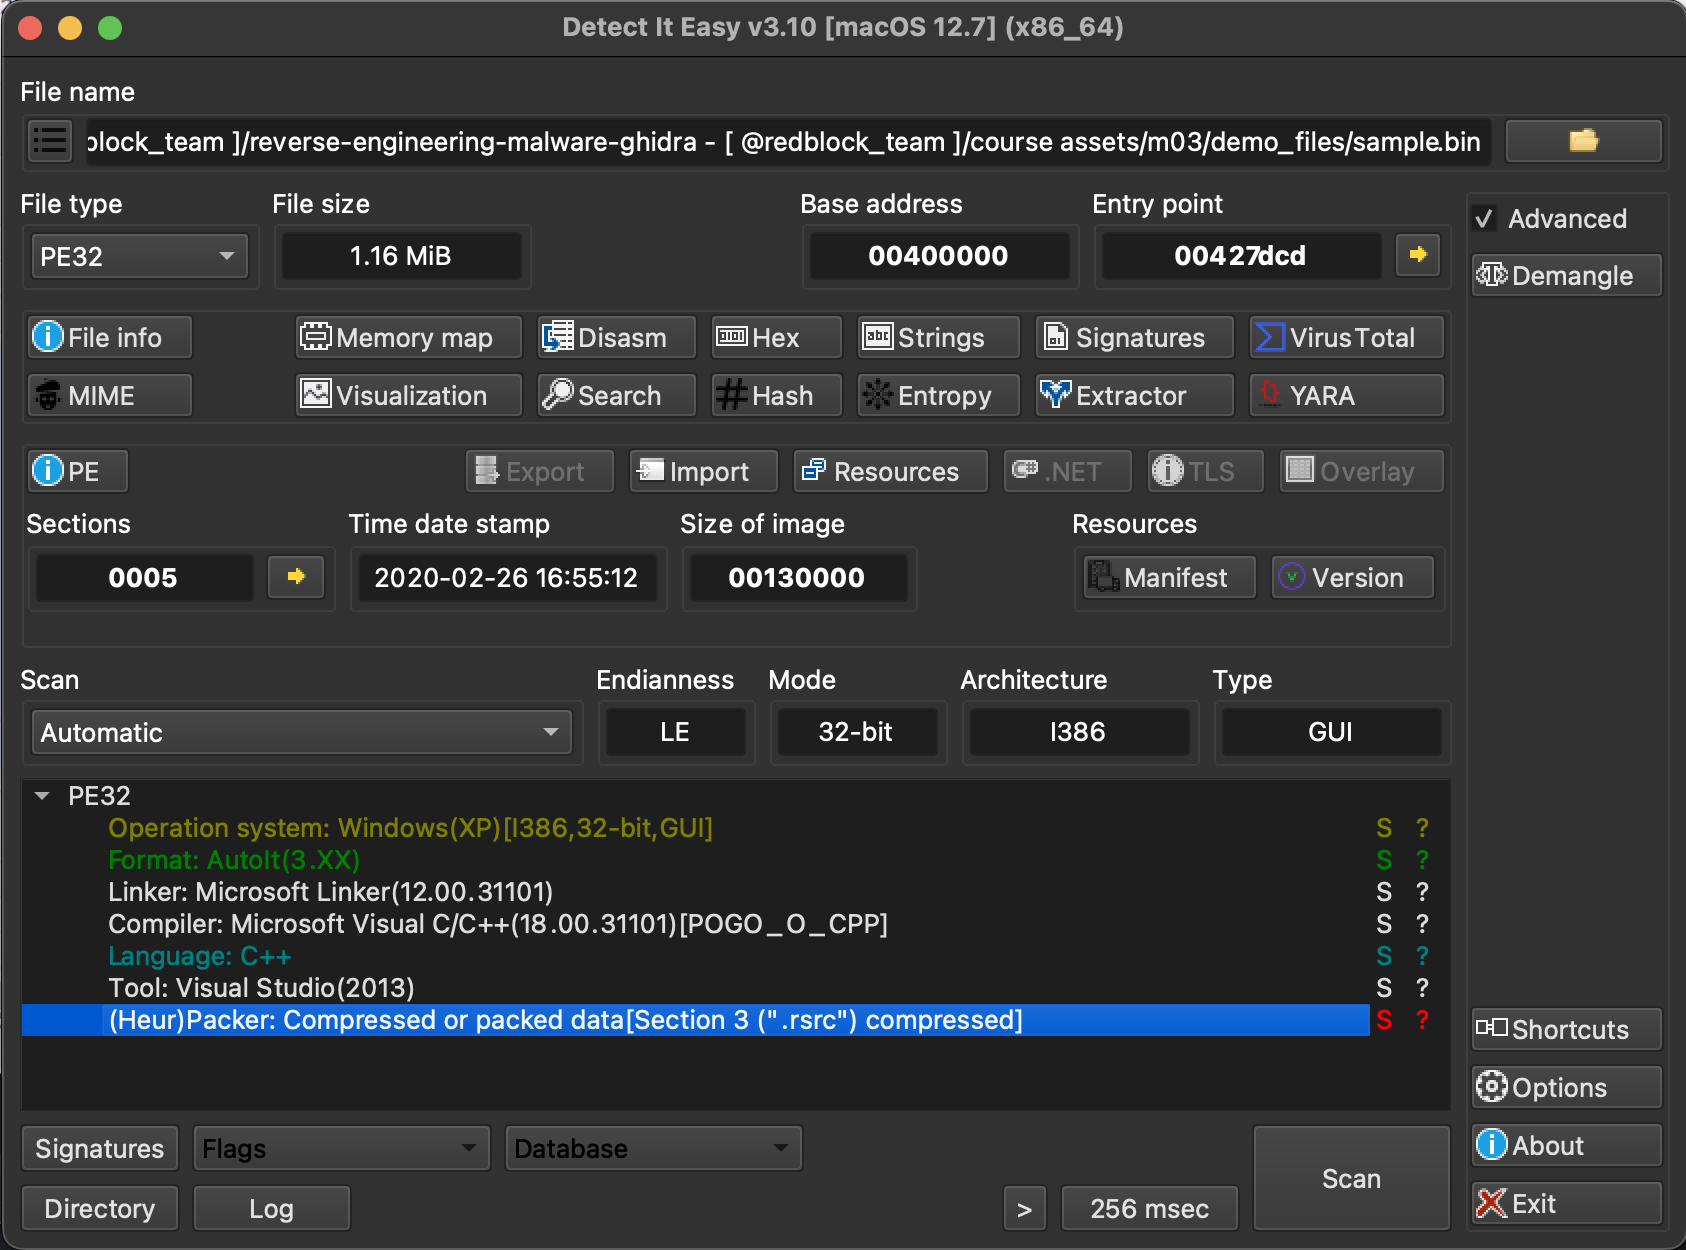
Entropy
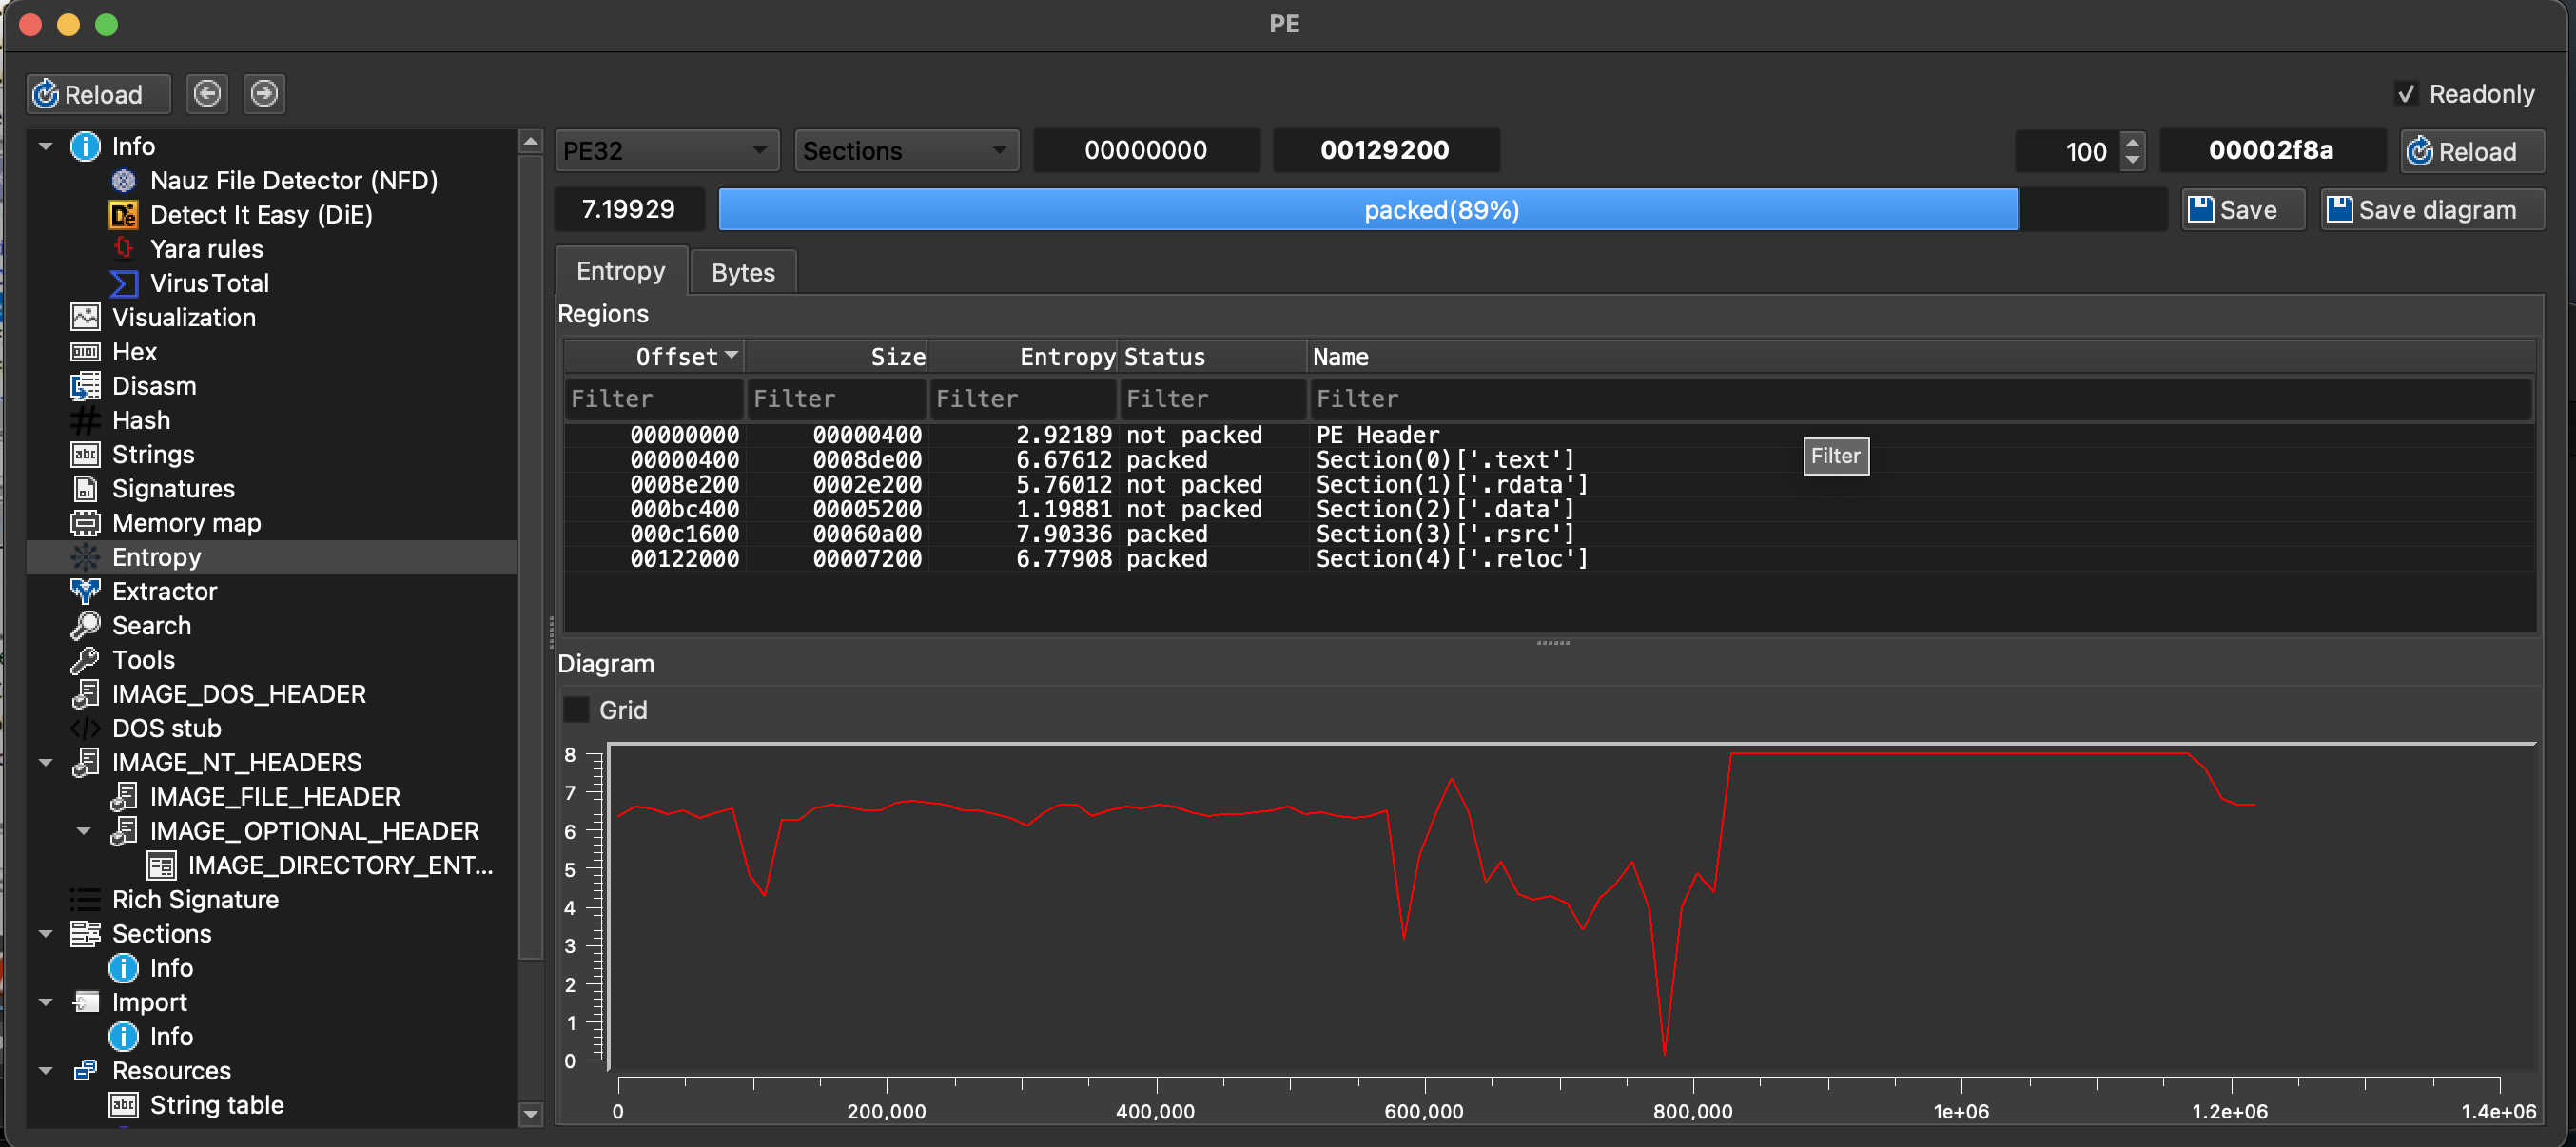
Description
The sample analyzed so far is a PE32 Win32 executable with a file size of approximately 1.16 MB. Static analysis identifies the binary as being compiled with Microsoft Visual C++ and containing an AutoIt 3.x library. The executable imports multiple Windows networking and system-related libraries such as WSOCK32.dll, WININET.dll, IPHLPAPI.dll, ADVAPI32.dll, and SHELL32.dll, which may indicate capabilities related to network communication, system interaction, and Windows API usage.
Initial PE section analysis shows standard sections including .text, .rdata, .data, .rsrc, and .reloc. Entropy analysis performed using Detect It Easy (DIE) indicates that the .text, .rsrc, and .reloc sections are flagged as packed or compressed due to relatively high entropy values, especially the .rsrc section with an entropy of 7.90. This may suggest the presence of obfuscated, compressed, or embedded data within the executable. At this stage, the analysis is limited to static metadata, import analysis, and PE section inspection; behavioral and dynamic analysis have not yet been performed.
| Category | Analysis Summary |
|---|---|
| File Type | PE32 Win32 executable |
| File Size | Approximately 1.16 MB |
| Compiler / Framework | Compiled using Microsoft Visual C++ with AutoIt 3.x library detected |
| Imported Libraries | Includes networking and system-related DLLs such as WSOCK32.dll, WININET.dll, IPHLPAPI.dll, ADVAPI32.dll, and SHELL32.dll |
| Possible Capabilities | May support network communication, Windows API interaction, and system-level operations |
| PE Sections Identified | .text, .rdata, .data, .rsrc, .reloc |
| Entropy Analysis | .text, .rsrc, and .reloc sections show relatively high entropy values |
| Packed / Obfuscated Sections | Detect It Easy (DIE) flagged .text, .rsrc, and .reloc sections as packed |
| Notable Observation | .rsrc section has very high entropy (7.90), which may indicate compressed, encrypted, or embedded data |
GHIDRA Analysis
Entry point
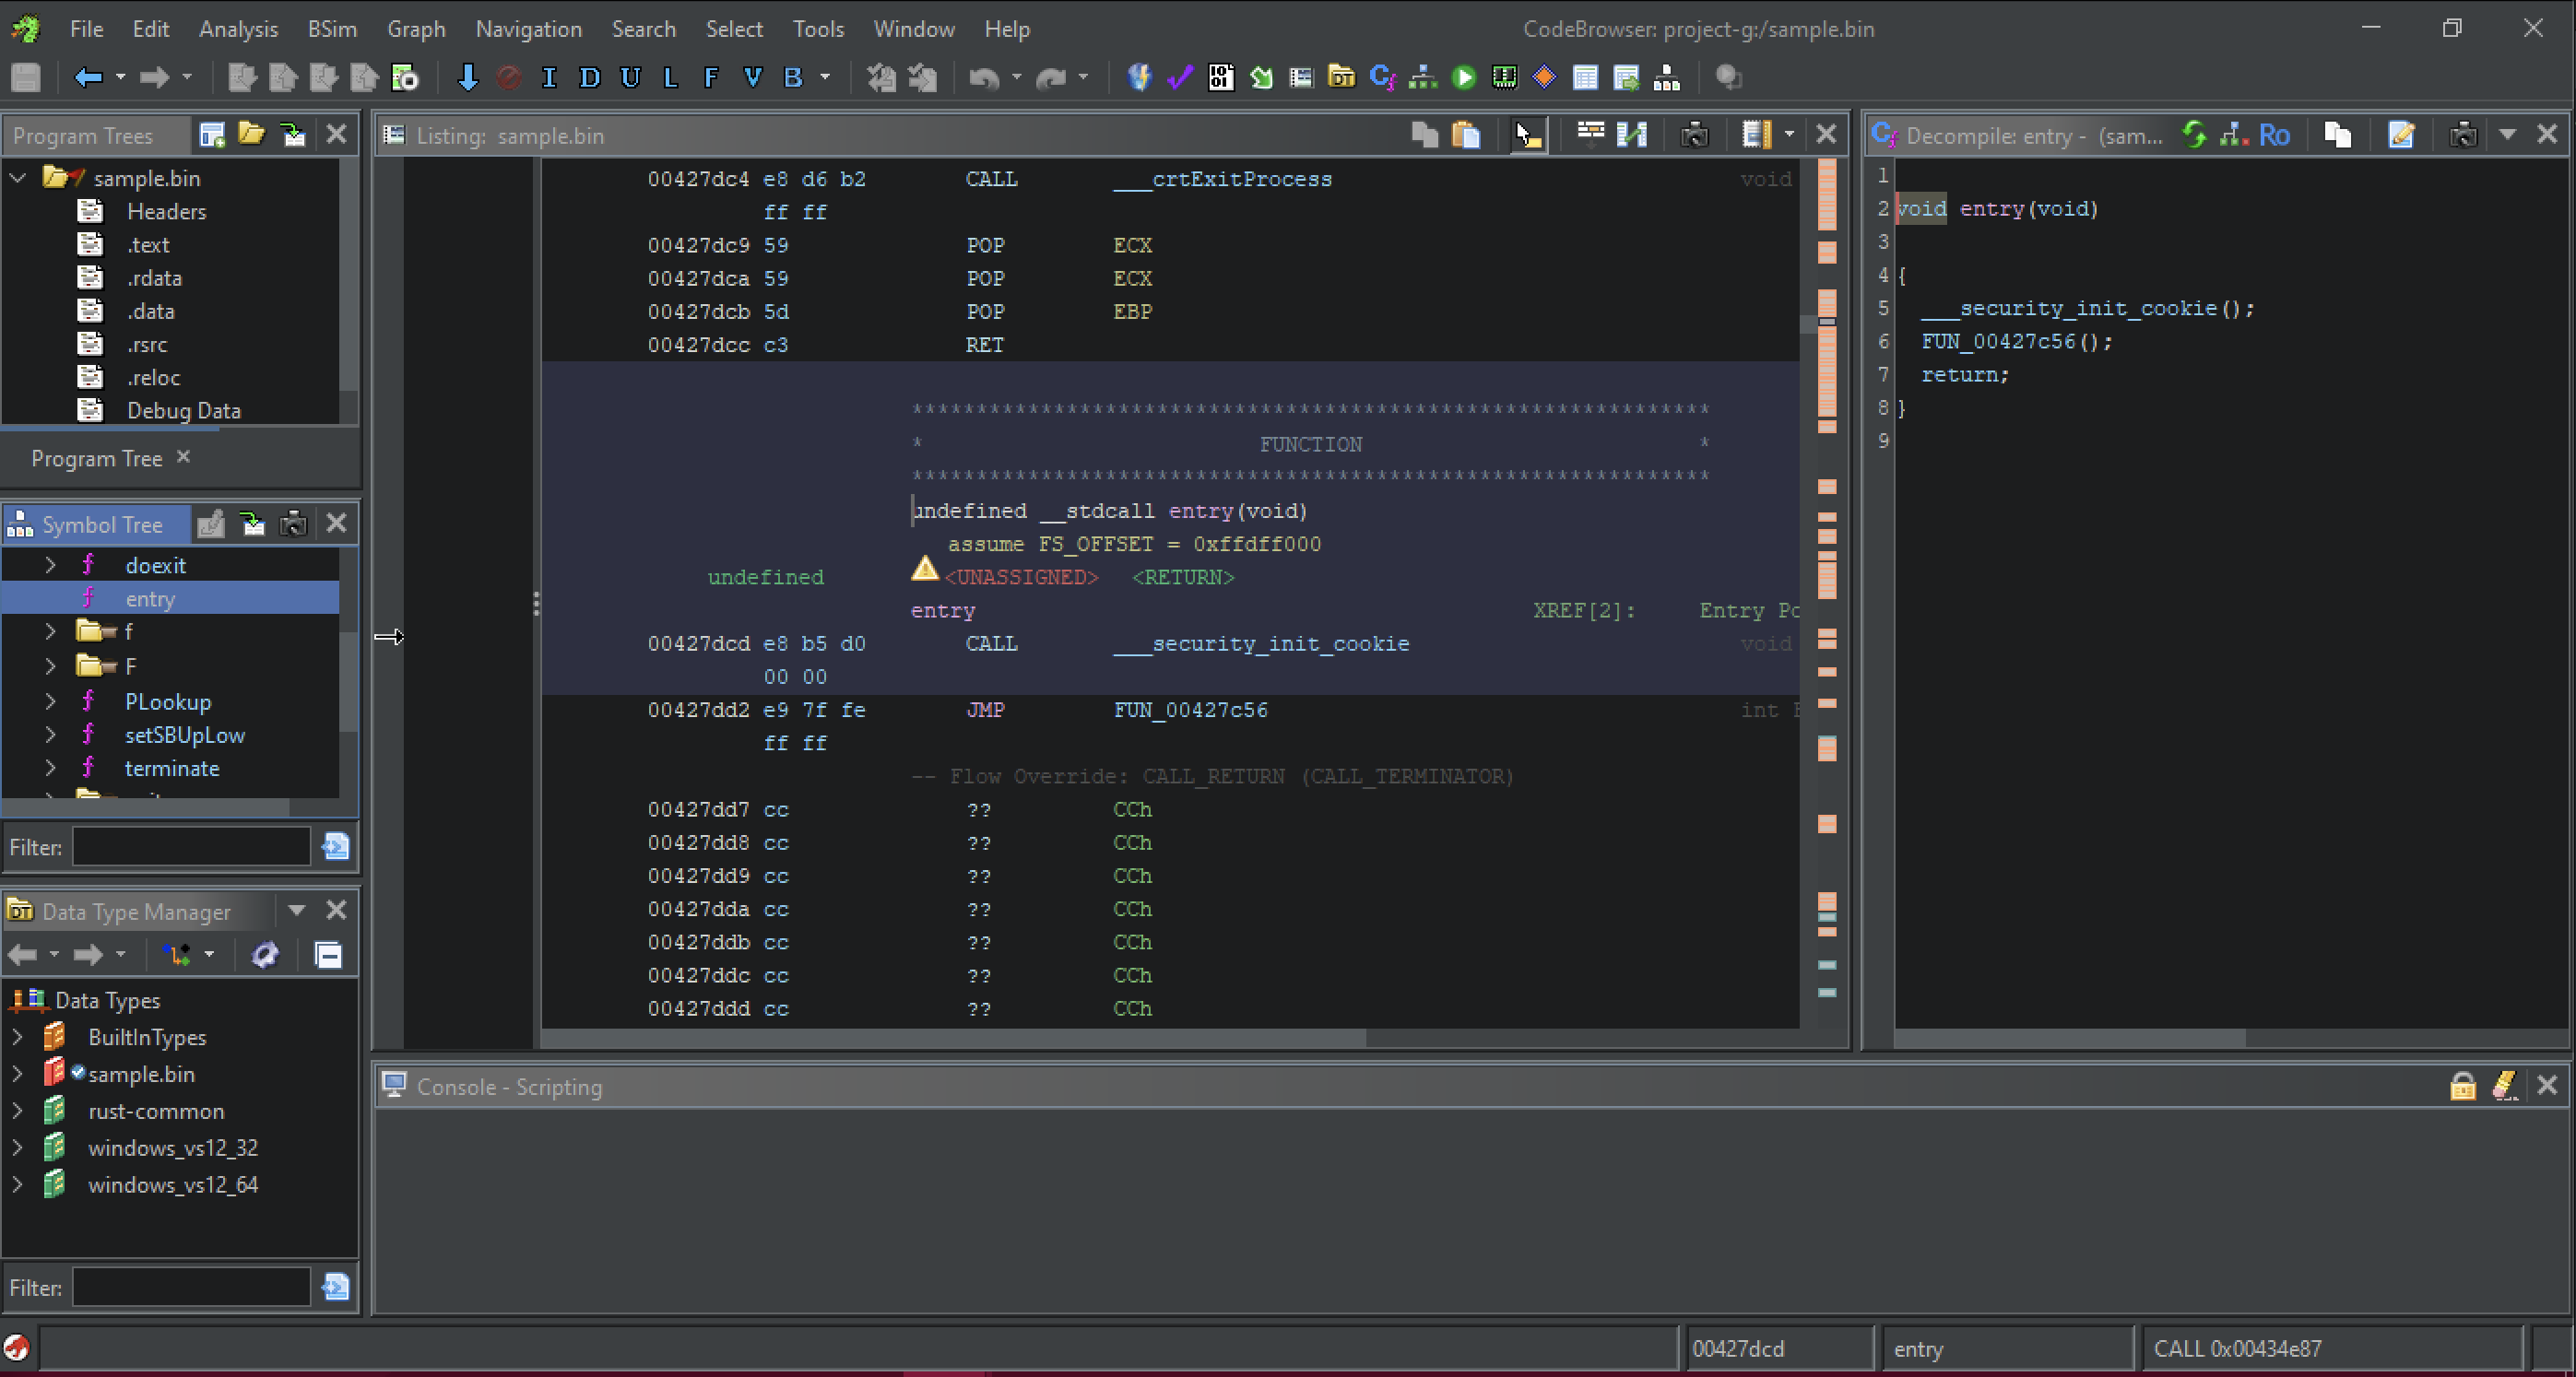
The executable entry point begins at address 0x00427DCD. Upon execution, the binary first calls ___security_init_cookie(), which is a standard Microsoft Visual C++ runtime function responsible for initializing security cookies used for stack protection and buffer overflow mitigation. After this initialization step, execution immediately jumps to the function FUN_00427C56. Since the entry point itself only performs runtime setup and transfers control, the actual program logic is likely located inside FUN_00427C56 or within functions called from it. To identify the real main() or WinMain() function, the analysis should continue by tracing execution flow from FUN_00427C56, as Microsoft Visual C++ compiled binaries commonly route execution through CRT (C Runtime) startup routines before reaching the main application logic.
Finding MAIN
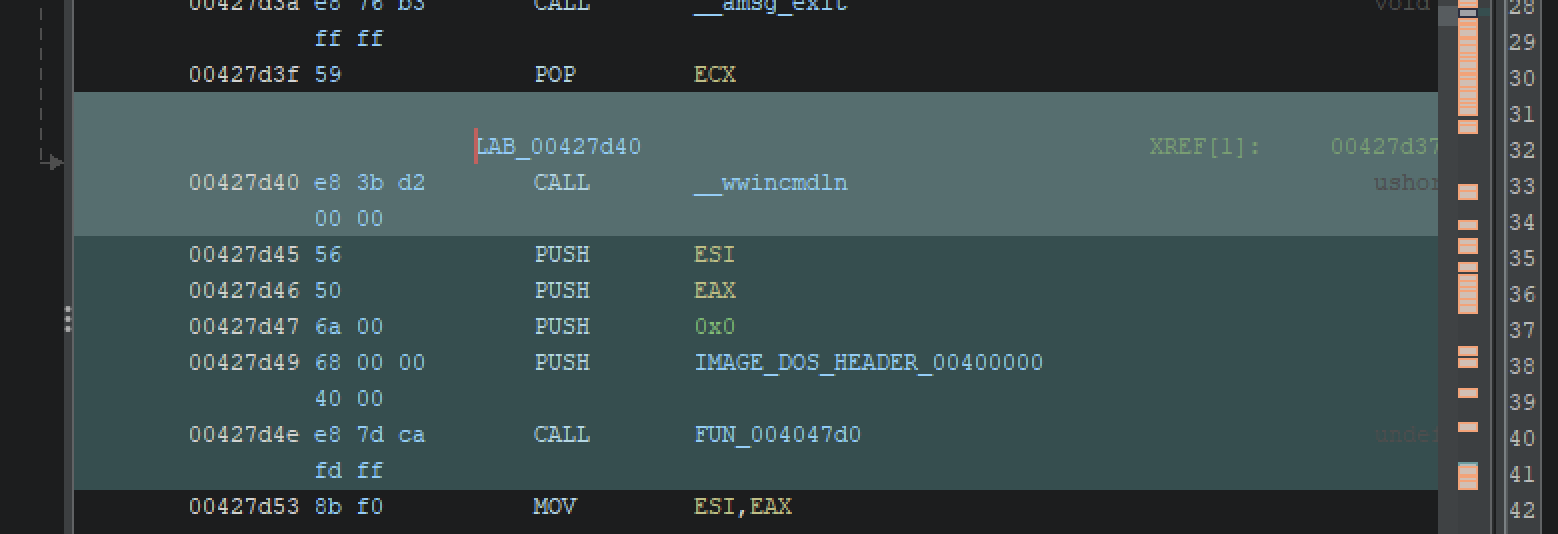
After following execution into FUN_00427C56, scrolling further down reveals an important pattern commonly used to identify the real program entry logic in Microsoft Visual C++ binaries:
LAB_00427d40
00427d40  CALL    __wwincmdln
00427d45  PUSH    ESI
00427d46  PUSH    EAX
00427d47  PUSH    0x0
00427d49  PUSH    IMAGE_DOS_HEADER_00400000
00427d4e  CALL    FUN_004047d0
The first instruction calls __wwincmdln(), which retrieves the command-line arguments passed to the program. The returned value is stored in the EAX register.
Right after that, the binary prepares several arguments using PUSH instructions before calling FUN_004047D0. These pushed values closely resemble the standard parameters normally passed to a program’s main() function.
PUSH ESI likely contains the environment pointer (envp) or other runtime startup data prepared earlier by the CRT.PUSH EAX pushes the command-line pointer returned by __wwincmdln(), which corresponds to the program arguments (argv).PUSH 0x0 acts as a placeholder value and is commonly associated with argument count (argc) or initialization-related data depending on the compiler’s startup routine.PUSH IMAGE_DOS_HEADER_00400000 pushes the executable’s image base address (0x00400000), which is commonly used as the application instance handle (HINSTANCE) in Windows applications.This sequence is important because these grouped PUSH instructions are commonly seen when CRT startup code prepares arguments before transferring execution to the real application logic. By following the call into FUN_004047D0, we move closer to identifying the actual main() or WinMain() function where the program’s core behavior begins.
THREE pushes
| Instruction | Parameter | Description |
|---|---|---|
PUSH ESI | envp | Pushes environment-related data. |
PUSH EAX | argv | Pushes the command-line arguments pointer. |
PUSH 0x0 | argc | Pushes a value related to argument count/startup data. |
FUN004047D0
FUN_004047D0 appears to be a startup initialization routine rather than the actual main() function. The function performs several runtime setup operations such as initializing global variables, configuring memory allocation handlers, checking whether Windows themes are enabled using IsThemeActive(), and retrieving system configuration settings through SystemParametersInfoW(). It also processes the program’s command-line arguments via FUN_00403B3A(param_3). Overall, this function mainly prepares the runtime environment and application state before execution continues deeper into the program’s core logic.
// Possible startup / initialization wrapper function
// Likely executed before the real main application logic

undefined4 FUN_004047d0(undefined4 param_1, undefined4 param_2, wchar_t *param_3)

{
    undefined4 uVar1;

    // Local structures used during initialization
    int *local_28[2];
    undefined4 local_20;
    undefined4 local_1c;

    int local_18[2];
    undefined4 local_10;
    undefined4 local_c;

    // Check a global startup flag
    // If the flag is not enabled, return immediately
    if (*(char *)(DAT_004c6428 + 0x1d) == '\0') {

        uVar1 = 1;
    }

    else {

        // Store startup parameter globally
        DAT_004c5278 = param_1;

        // Initialize global state variables
        DAT_004c527c = 0;
        DAT_004c5270 = 0;

        // Initialize local structures
        local_28[0] = (int *)0x0;
        local_20 = 0;
        local_1c = 1;

        local_18[0] = 0;
        local_10 = 0;
        local_c = 1;

        // Perform memory/object initialization
        FUN_004098c0((int *)local_28);

        // Reassign structure pointer
        local_28[0] = local_18;

        // Update structure state/configuration
        local_1c = 6;

        // Check whether Windows themes are enabled
        DAT_004c52b0 = IsThemeActive();

        // Configure C++ runtime memory allocation handler
        _set_new_handler((_func_int_uint *)&LAB_00457c74);

        // Enable new-mode memory behavior
        _set_new_mode(1);

        // Additional runtime/environment setup
        FUN_004048fd(DAT_004c642c);

        // Process command-line arguments passed to the program
        FUN_00403b3a(param_3);

        // Retrieve Windows system/UI configuration settings
        SystemParametersInfoW(
            0x2001,
            0,
            *(PVOID *)(DAT_004c642c + 4),
            2
        );

        // Retrieve final status/result value
        uVar1 = DAT_004c527c;

        // Cleanup initialized structures
        FUN_004098c0(local_18);
        FUN_004098c0((int *)local_28);
    }

    // Return initialization result
    return uVar1;
}
FUN00403B3A
FUN_00403B3A appears to be one of the main execution functions of the sample. The function starts by retrieving the current working directory and processing the command-line arguments passed to the program. It then performs an anti-debugging check using IsDebuggerPresent(). If a debugger is detected, the program displays a message saying "This is a third-party compiled AutoIt script." and immediately stops execution, which is a common anti-analysis technique.
The function also performs several runtime and environment checks, initializes internal data structures, resolves file paths, and restores the working directory when needed. One important behavior is the use of ShellExecuteW() with the "runas" operation, which attempts to relaunch the executable with administrator privileges through UAC elevation. Depending on certain conditions and internal flags, the function then transfers execution into other routines such as FUN_00403A46() and FUN_004039D5(), which likely contain the main functionality of the program. Overall, this function acts as a controller that handles anti-debugging checks, environment setup, privilege escalation attempts, and execution flow before the core logic begins.
/* WARNING: Function: __alloca_probe replaced with injection: alloca_probe */

/*
    FUN_00403B3A

    This function appears to be a major execution/control routine.
    It performs:
    - Environment setup
    - Command-line processing
    - Anti-debugging checks
    - Path handling
    - Privilege elevation attempts
    - Transfers execution into deeper program logic
*/

void FUN_00403b3a(wchar_t *param_1)

{
    bool bVar1;
    BOOL BVar2;
    undefined4 uVar3;
    int iVar4;
    HWND hwnd;

    undefined4 extraout_ECX;

    // Used for ShellExecuteW()
    wchar_t *lpOperation;
    WCHAR *lpDirectory;
    INT nShowCmd;

    // Buffers for file paths/current directory
    WCHAR aWStack_20030[32768];
    WCHAR aWStack_10030[32768];

    // Internal structures/buffers
    LPCWSTR local_30[4];
    LPCWSTR local_20[4];

    LPWSTR local_10;

    // Internal flags
    char local_b;
    undefined1 local_a;
    char local_9;

    undefined4 uStack_8;

    // Stack setup
    uStack_8 = 0x403b47;

    // Initialize local structure
    FUN_00407667(local_30);

    local_10 = (wchar_t *)0x0;
    local_a = 0;
    local_9 = '\0';

    // Get current working directory
    GetCurrentDirectoryW(0x7fff, aWStack_10030);

    // Process command-line arguments
    FUN_00403766(param_1, &local_b);

    // Anti-debugging check
    BVar2 = IsDebuggerPresent();

    // If debugger detected -> show message and exit
    if (BVar2 != 0) {

        MessageBoxA(
            (HWND)0x0,
            "This is a third-party compiled AutoIt script.",
            "",
            0x10
        );

        goto LAB_00403c75;
    }

    // Check internal execution flag/state
    if (DAT_004c52e0 == 0) {

        // Set error state
        DAT_004c527c = 0xffffffff;
    }

    else {

        // Simple initialization path
        if (DAT_004c52e0 == 1) {

            // Initialize internal data
            FUN_00407213(
                &DAT_004c6290,
                1,
                DAT_004c52e8,
                0xffffffff
            );

            DAT_004c6292 = DAT_004c5284;
        }

        else {

            // More complex initialization path
            uVar3 = FUN_00407285(
                &DAT_004c6290,
                &DAT_004c52f8,
                &DAT_004c52e0,
                extraout_ECX,
                &local_a
            );

            // Initialization failed
            if ((char)uVar3 == '\0') {

                DAT_004c527c = 1;

                goto LAB_00403c68;
            }

            // Store internal values
            DAT_004c52e4 = DAT_004c6290;
            local_9 = DAT_004c6291;

            // Resolve full file path
            GetFullPathNameW(
                DAT_004c52f8,
                0x7fff,
                aWStack_20030,
                &local_10
            );

            // Additional path/file processing
            uVar3 = FUN_00407bcc(
                &DAT_004c52d0,
                local_10
            );

            local_10 = (LPWSTR)
                CONCAT31((int3)((uint)uVar3 >> 8), local_a);
        }

        // Additional validation/check
        iVar4 = FUN_0041092d(
            &DAT_004c52f8,
            DAT_004c52e0
        );

        // Validation failed
        if (iVar4 != 0) {

            // Cleanup
            FUN_004072db((undefined2 *)&DAT_004c6290);

            // Restore original working directory
            SetCurrentDirectoryW(aWStack_10030);

            DAT_004c527c = 1;

            goto LAB_00403c75;
        }

        // Check execution flag
        if (local_9 == '\x01') {

            // Internal condition check
            bVar1 = FUN_0045874b();

            // Compare conditions
            if ((bVar1) || ((bool)local_b != bVar1))
                goto LAB_00403c26;

            // Prepare executable path
            FUN_00404706(local_30);

            // Build command-line arguments
            FUN_00407de1(local_20, L"!");

            // If no path available
            if ((char)local_10 == '\0') {

                FUN_00407cab(local_20, param_1);
            }

            else {

                // Build quoted command-line string
                FUN_00407cab(local_20, L"\"");
                FUN_00407b2e(local_20, (int *)&DAT_004c52f8);
                FUN_00407cab(local_20, L"\"");
            }

            // Window display mode
            nShowCmd = 1;

            // Working directory
            lpDirectory = aWStack_10030;

            // "runas" triggers UAC/admin prompt
            lpOperation = L"runas";

            // Get active window handle
            hwnd = GetForegroundWindow();

            // Relaunch executable with elevated privileges
            ShellExecuteW(
                hwnd,
                lpOperation,
                local_30[0],
                local_20[0],
                lpDirectory,
                nShowCmd
            );

            // Cleanup
            FUN_00405904(local_20);
        }

        else {

LAB_00403c26:

            // Continue into deeper program execution

            FUN_00403a46();

            FUN_004039d5();

            // Additional internal logic
            if (DAT_004c52e4 == '\0') {

                FUN_0040434a(&DAT_004c5890);
            }

            // Initialize/execute another component
            FUN_004109d0(&DAT_004c5310, 1);

            // More internal execution
            if (DAT_004c52e4 == '\0') {

                FUN_0040443a(0x4c5890);
            }
        }

        // Cleanup internal structures
        FUN_004072db((undefined2 *)&DAT_004c6290);
    }

LAB_00403c68:

    // Restore original working directory
    SetCurrentDirectoryW(aWStack_10030);

LAB_00403c75:

    // Final cleanup
    FUN_00405904(local_30);

    return;
}
So this is a AutoIt compiled executable.
AutoIt is a Windows scripting language used to automate tasks such as GUI interaction, file operations, and system administration. AutoIt scripts can be compiled into standalone .exe files, making them easy to distribute and execute. Because of this, AutoIt is also commonly abused by malware authors to create packed or obfuscated malware loaders and droppers.
Based on the indicators seen so far, the sample very likely contains an AutoIt compiled executable.
Several observations support this conclusion:
Library: AutoIt (3.XX) "This is a third-party compiled AutoIt script." when a debugger is detected using IsDebuggerPresent().
ShellExecuteW(..., "runas", ...),.rsrc sections..rsrc section has very high entropy (7.90), which is common in compiled AutoIt executables because AutoIt often stores compressed scripts or embedded resources inside the resource section.At this stage, it is best to describe the sample as:
“A likely AutoIt-compiled executable with packed resources and anti-debugging behavior.”
Further analysis would involve:
.rsrc section,FUN_00403A46() and FUN_004039D5() to identify the actual payload or behavior.Using Exe2Aut
Just drag the sample into Exe2Aut. It will create a file named sample_.au3 open it in your favorite text editor for further analysis.
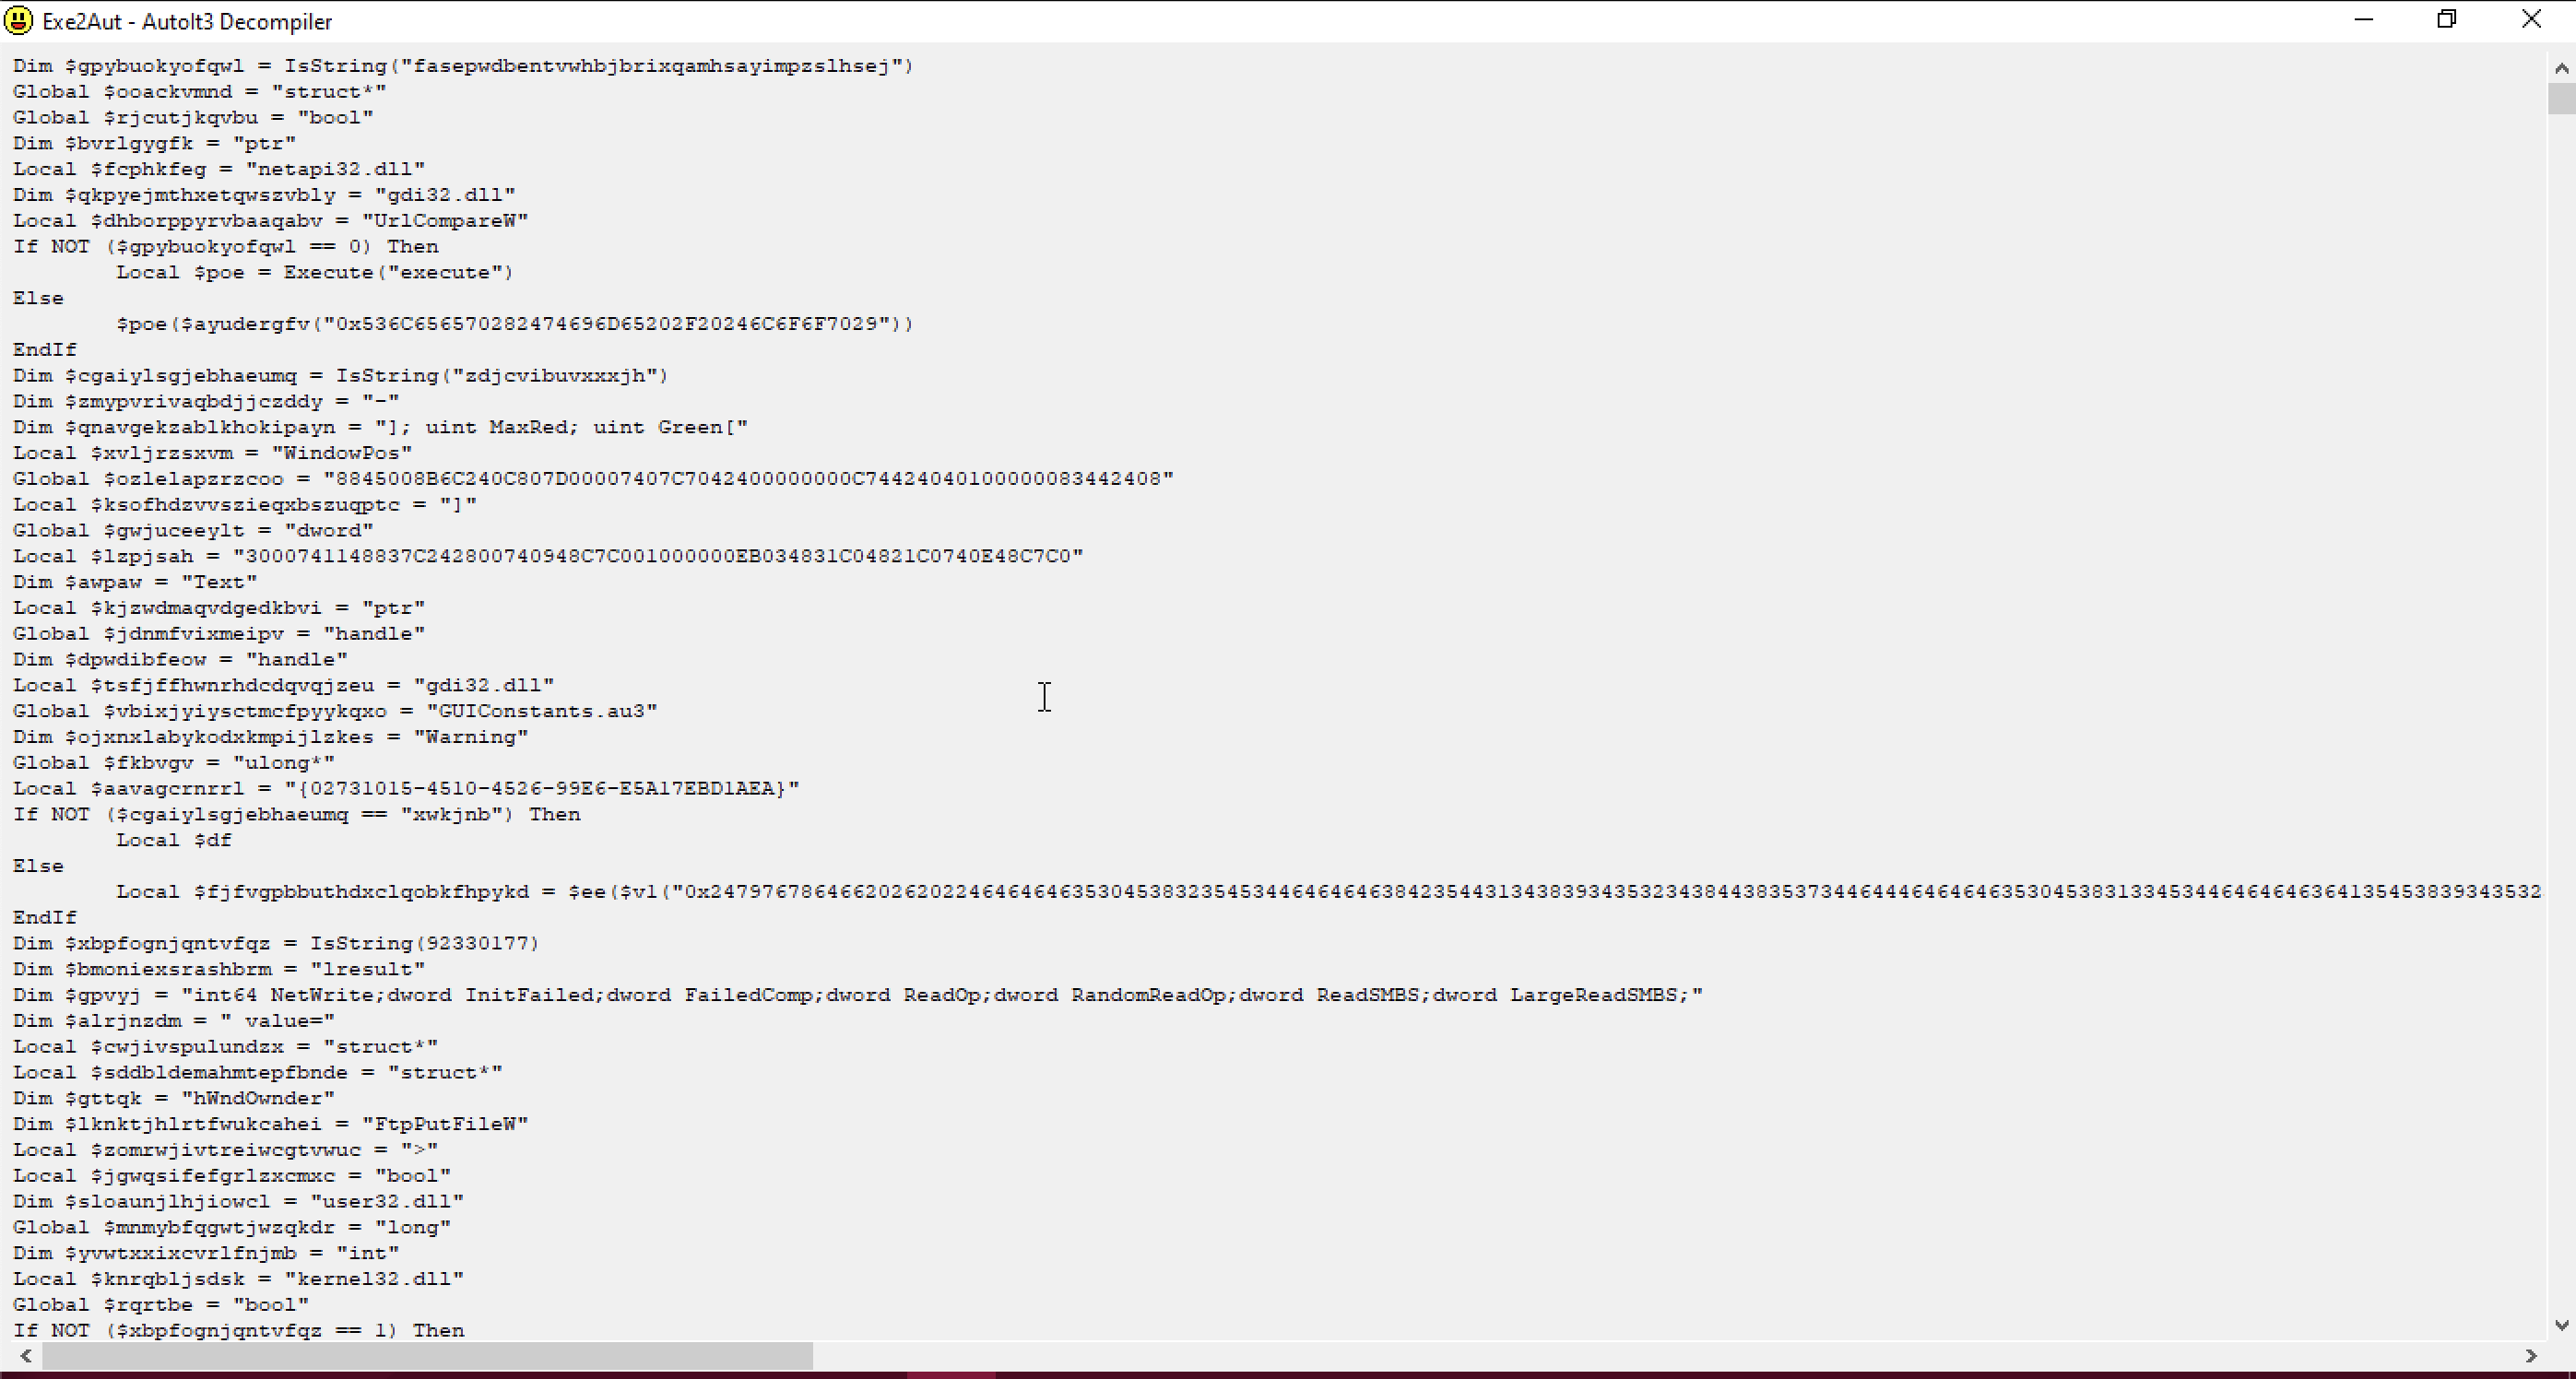
AutoIt script Analysis
One of the behavior you can look for is the inclusion of a large amount of code.
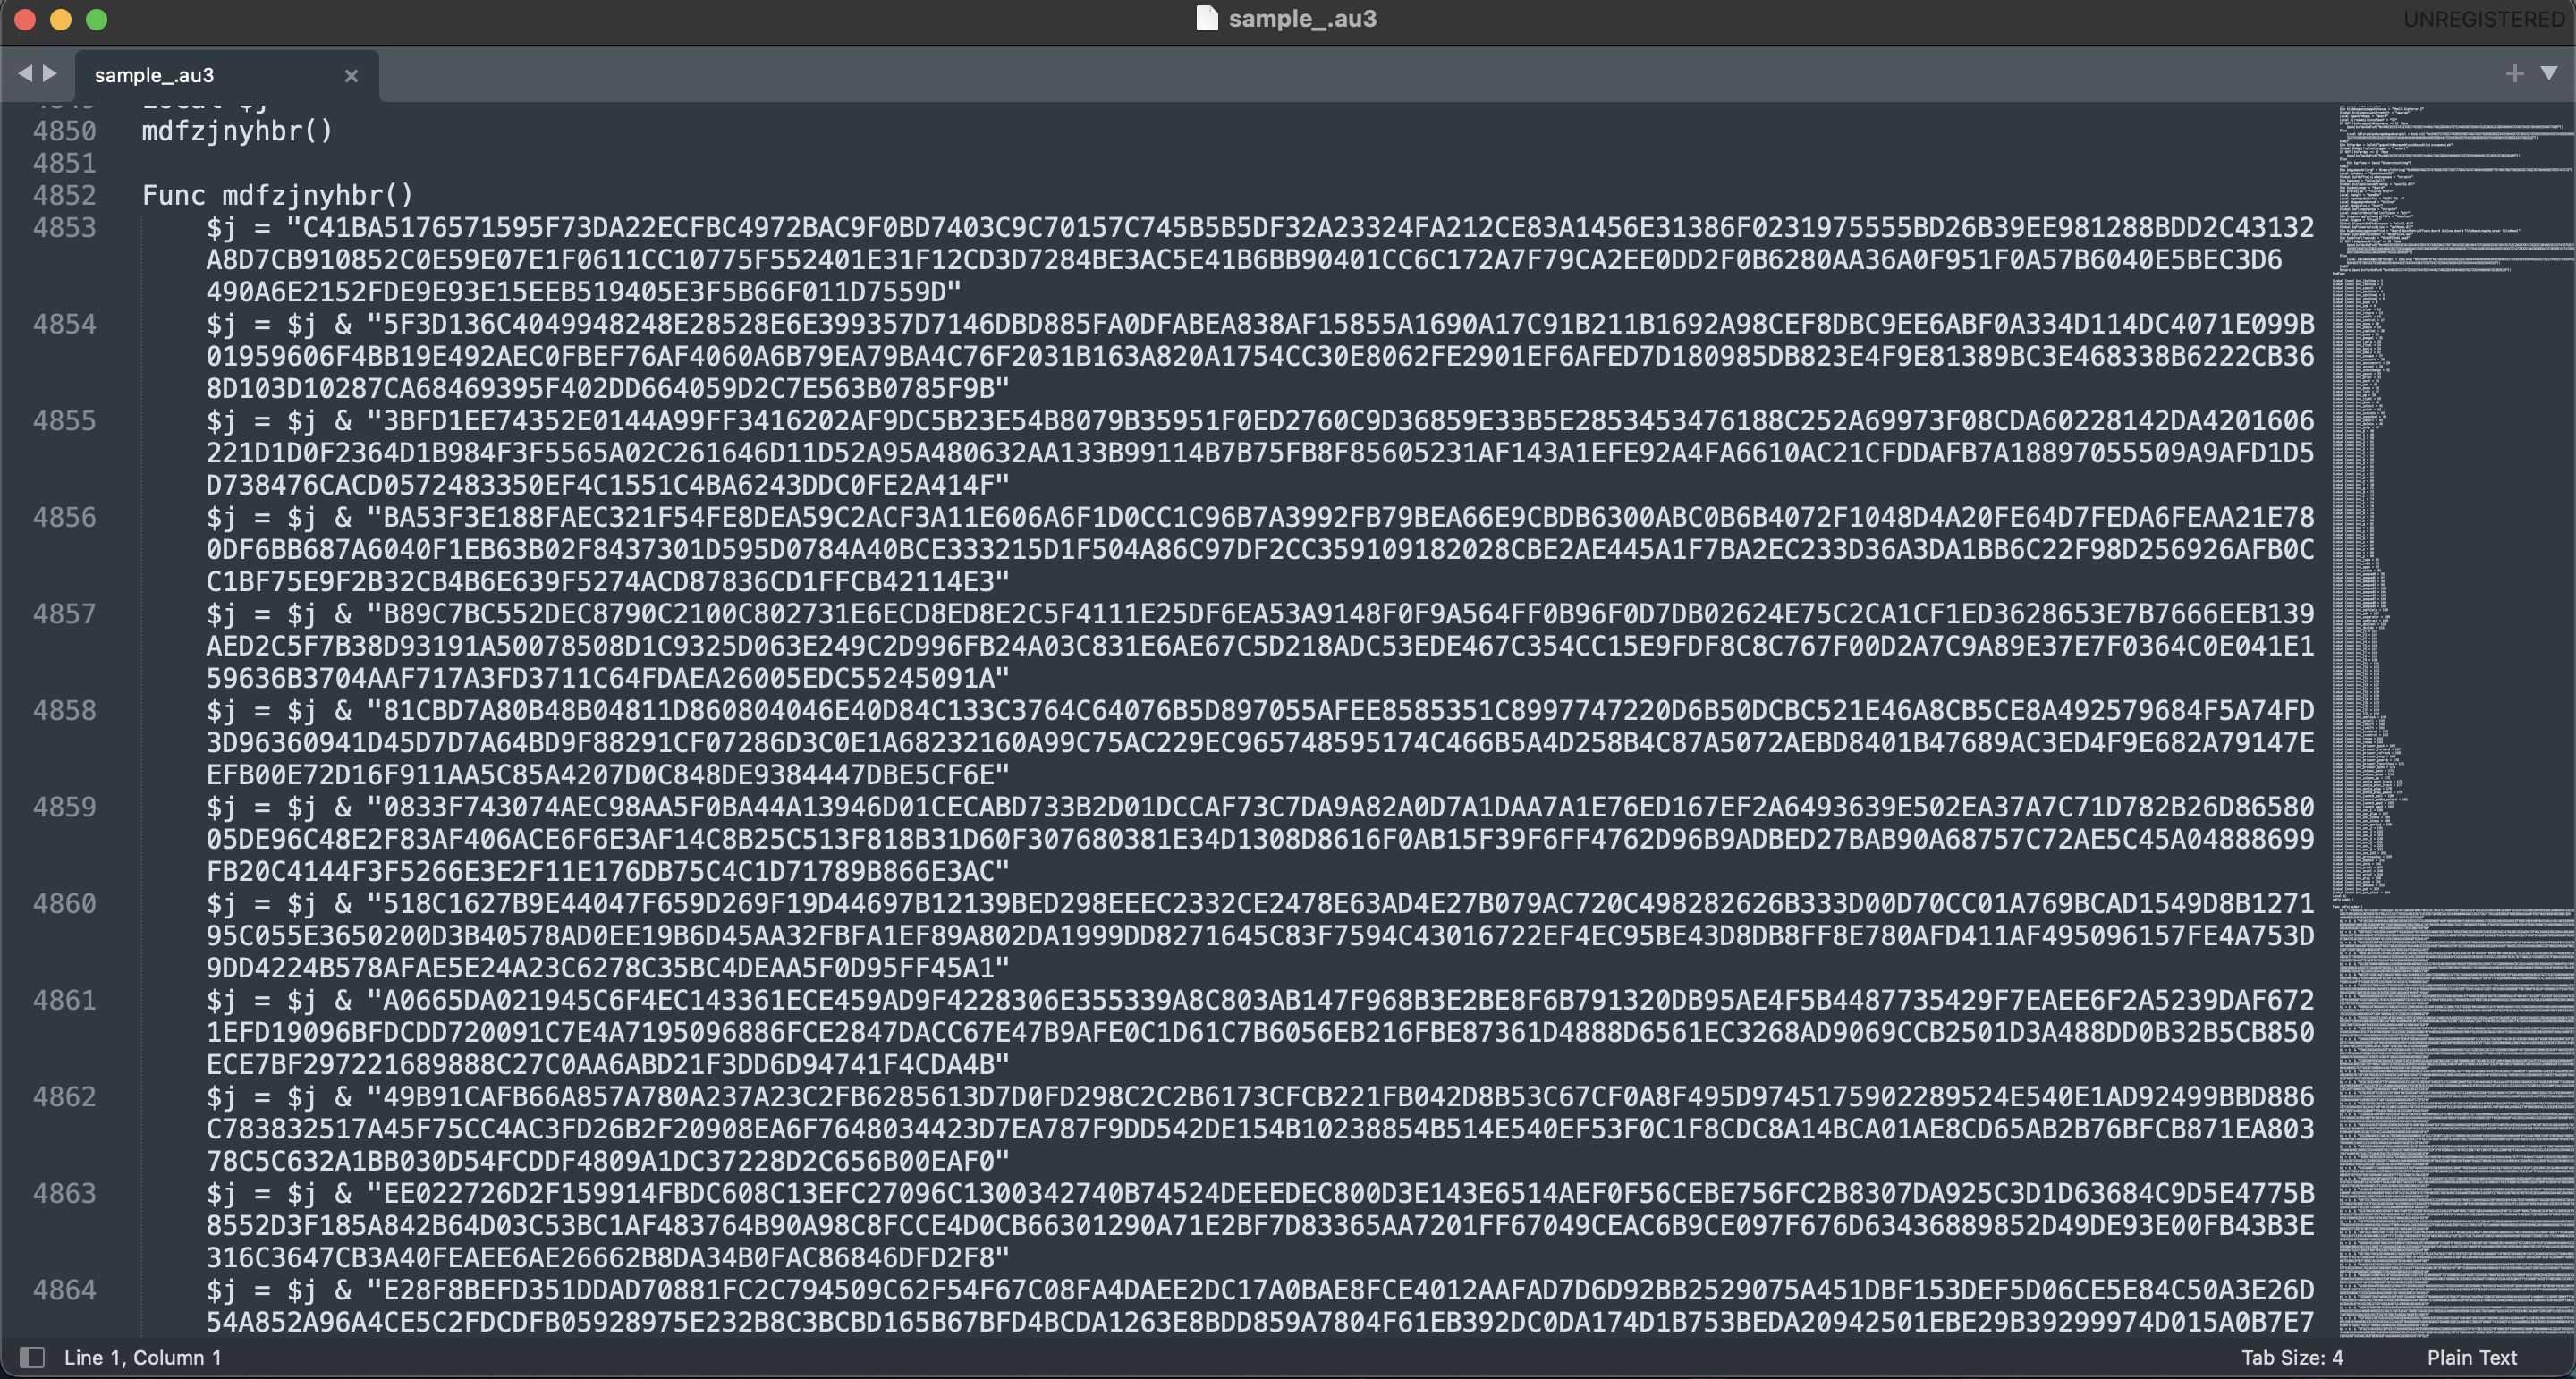
We can suspect either this is going to be a shellcode or maybe another executable file. This will likely be staged in memory. So we need to use a debugger to extract this shell code from the memory.
Before that
Identifying the Anti-Debugging Check
Since the script checks IsDebuggerPresent(), the sample is using a simple anti-debugging technique to stop execution when it detects a debugger. Earlier, we saw this behavior inside FUN_00403B3A():
BVar2 = IsDebuggerPresent();

if (BVar2 != 0) {
    MessageBoxA(
        (HWND)0x0,
        "This is a third-party compiled AutoIt script.",
        "",
        0x10
    );

    goto LAB_00403c75;
}
To locate the anti-debugging functionality, I opened the binary in Ghidra and navigated to:
Symbol Tree → Imports → KERNEL32.dll → IsDebuggerPresent
This revealed the imported Windows API IsDebuggerPresent(), which is commonly used by malware to detect debuggers during execution.
PTR_IsDebuggerPresent_0048f330

0048f330  addr  KERNEL32.DLL::IsDebuggerPresent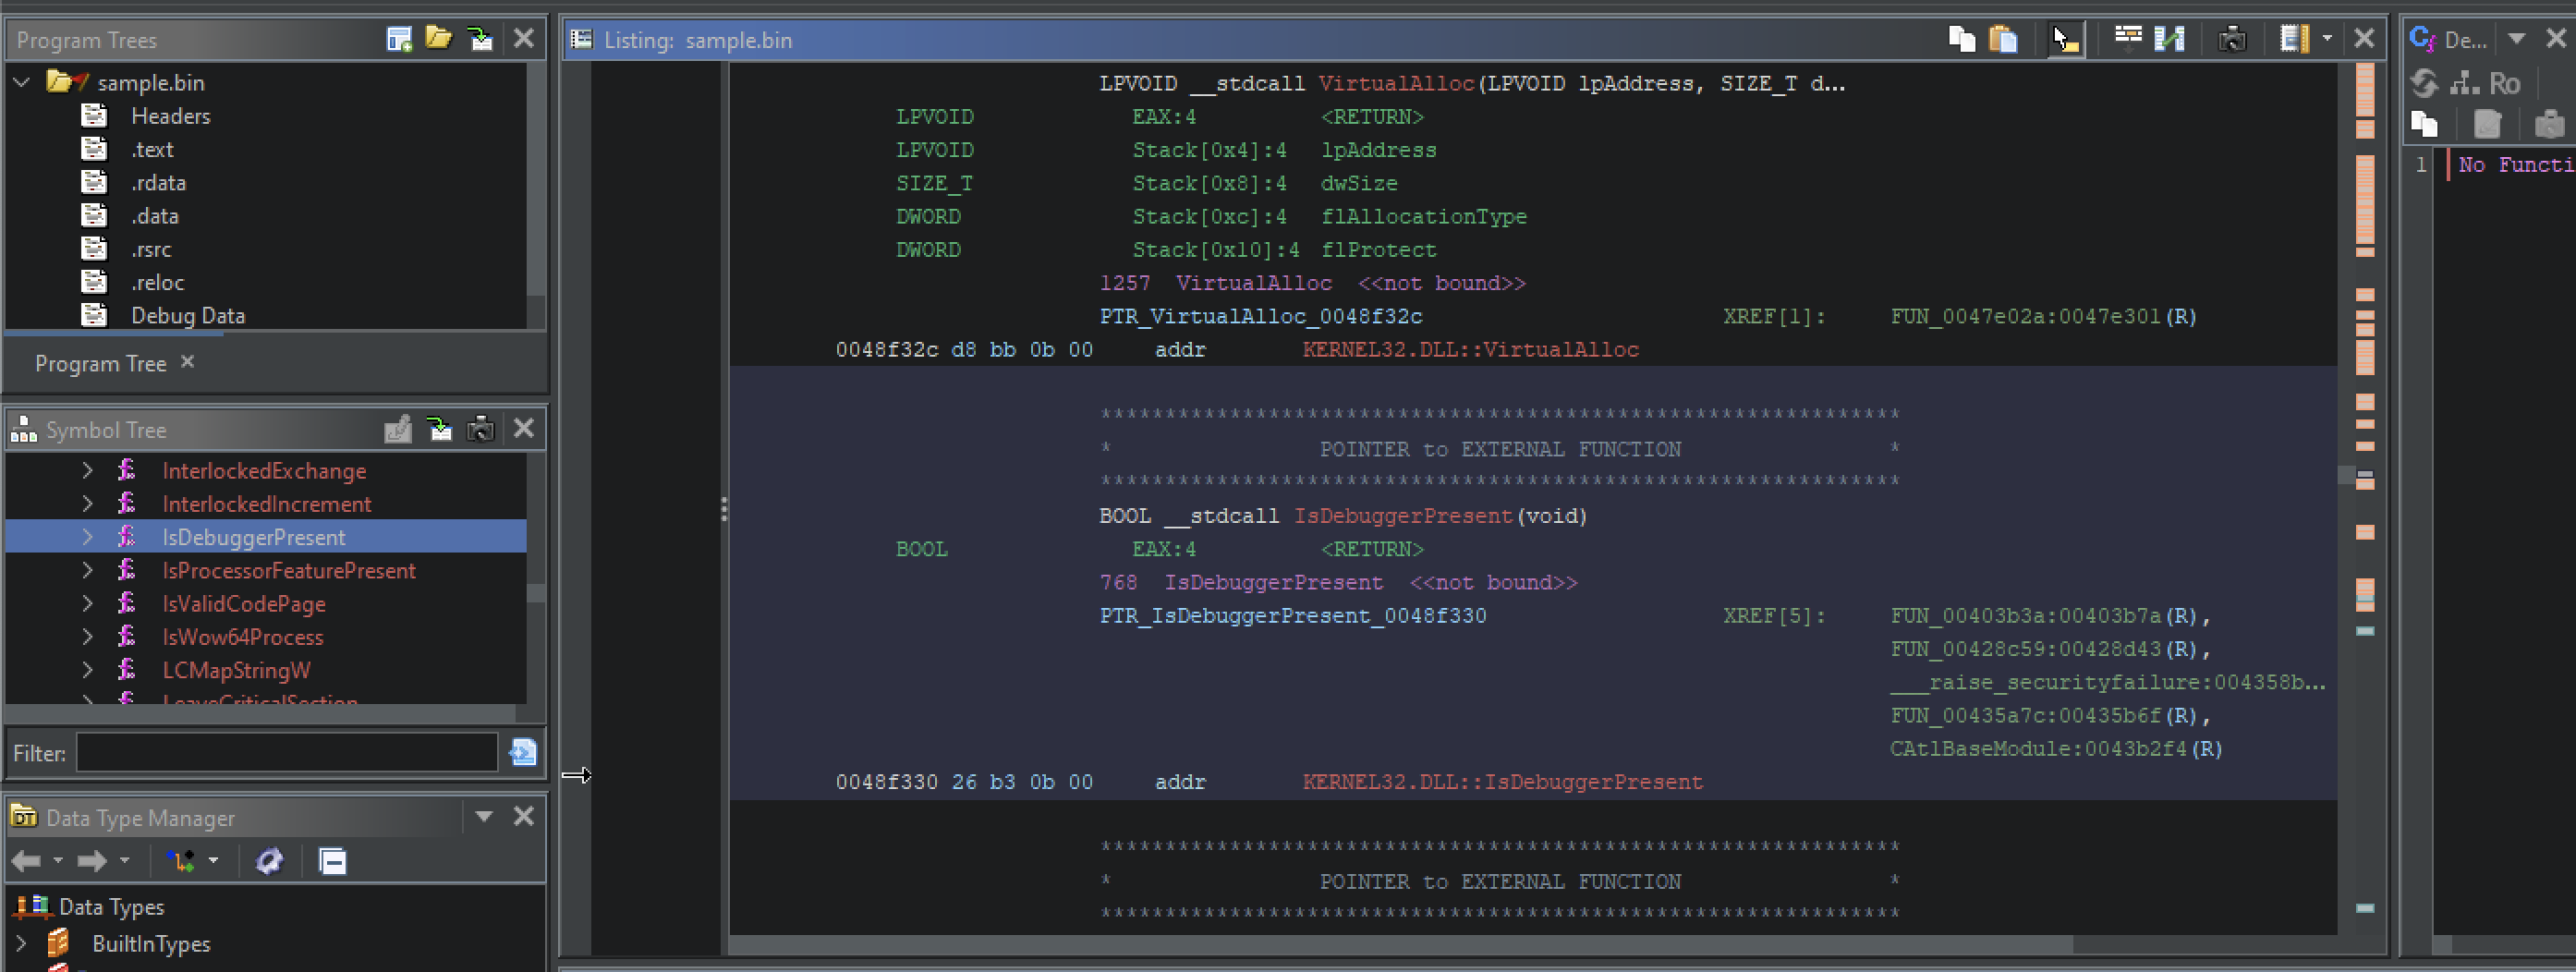
The cross-references (XREFs) showed all locations where the function was used inside the binary:
FUN_00403b3a:00403b7a(R)Following this reference led directly to the anti-debugging routine inside FUN_00403B3A(), where the sample checks if a debugger is attached. If the check returns TRUE, the program displays the message:
"This is a third-party compiled AutoIt script."and terminates execution.
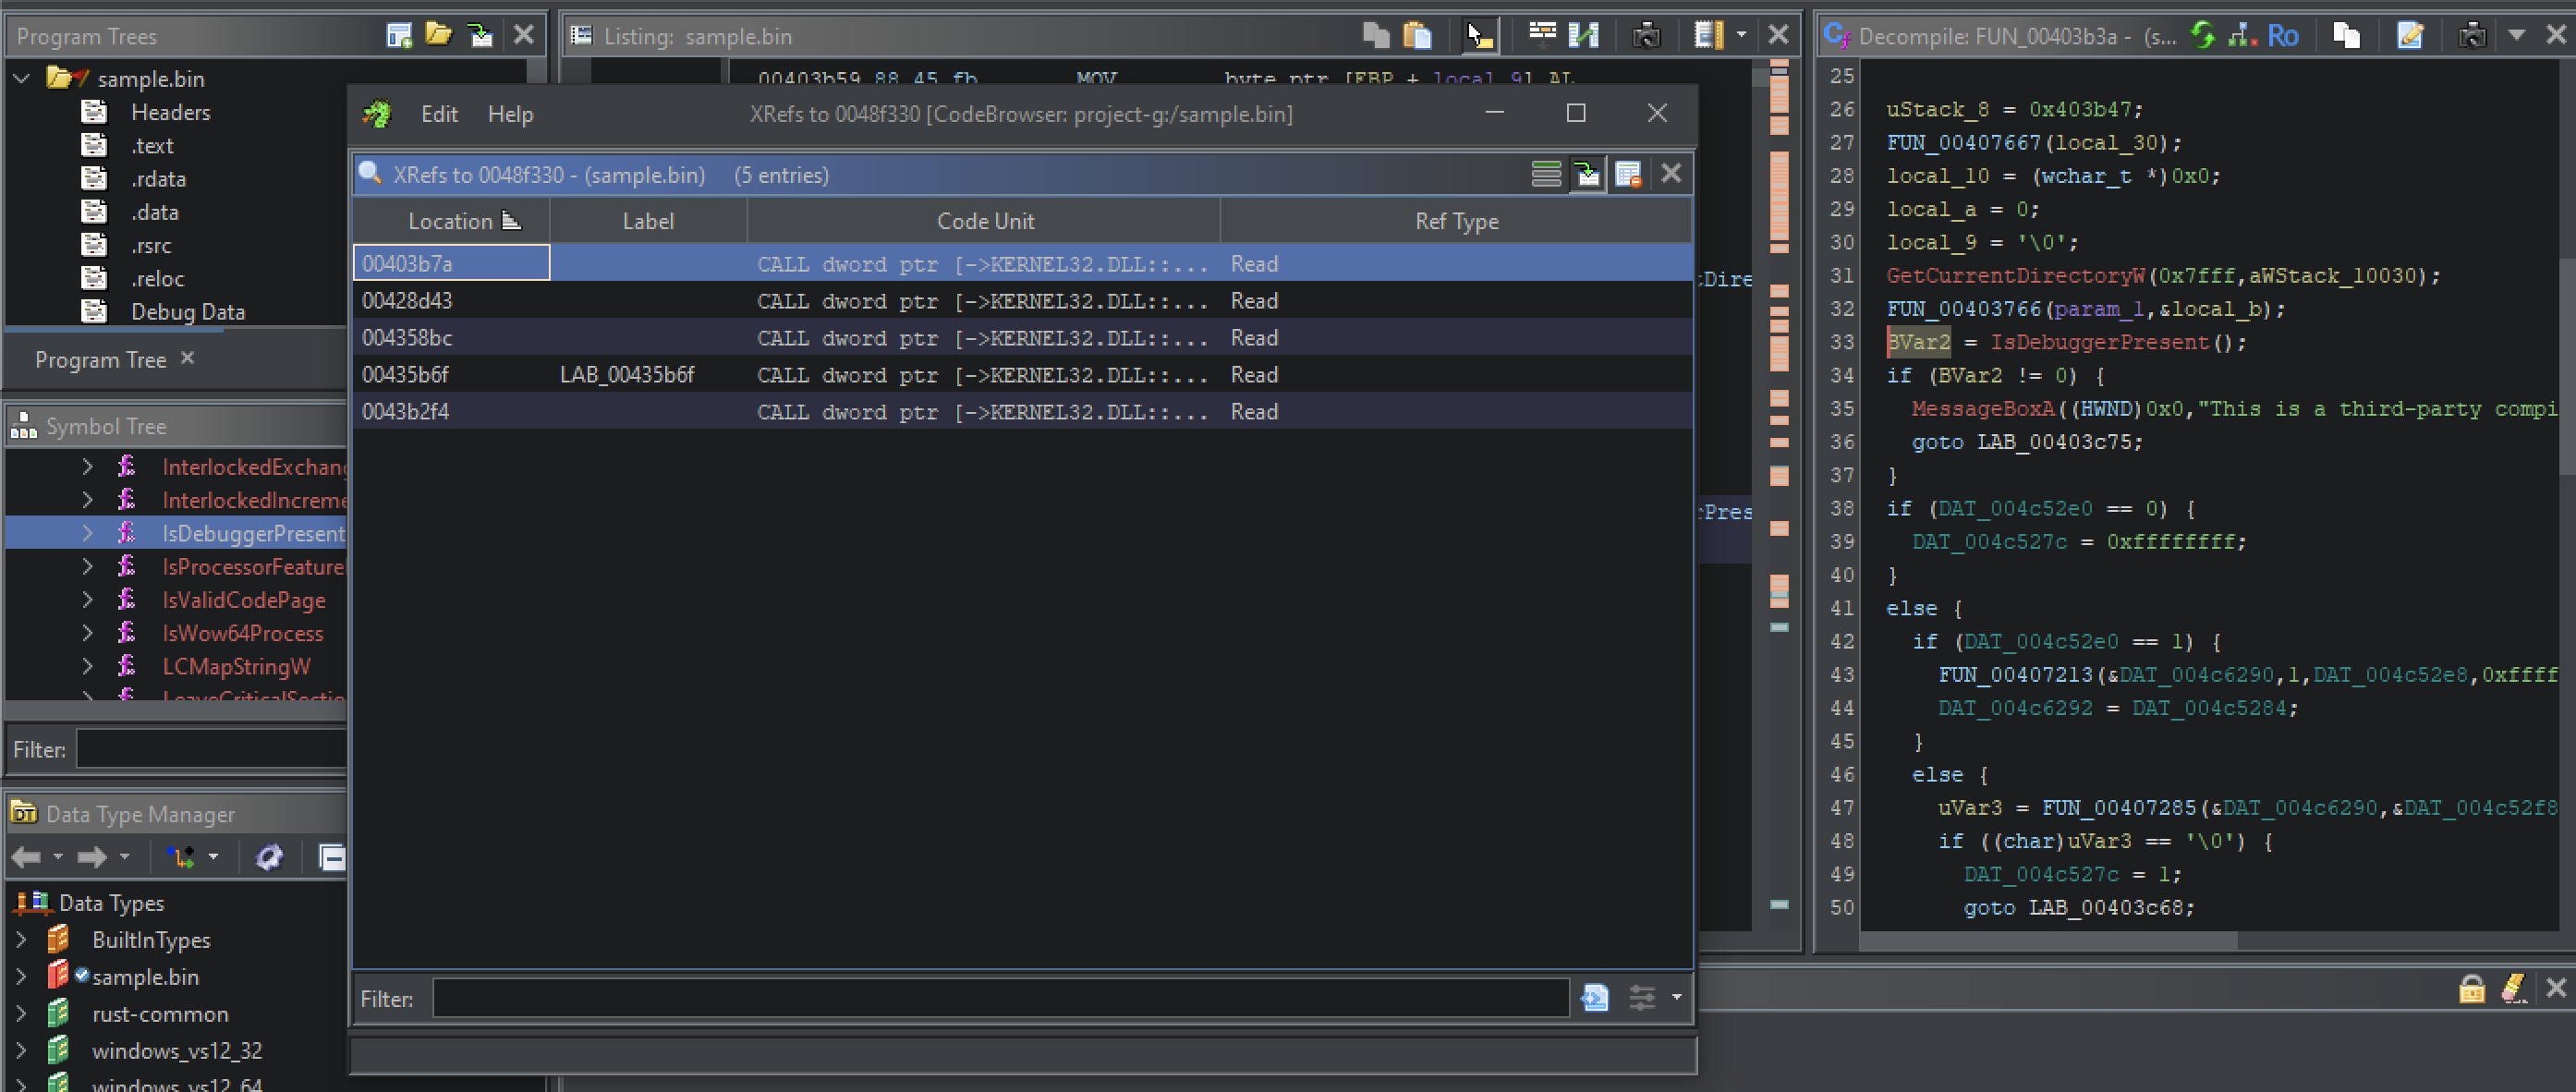
Virtual Address where this instruction is located: 00403b7a . we can set the break point here and change the return value. I will use windbg.
00403b7a ff 15 30        CALL       dword ptr [->KERNEL32.DLL::IsDebuggerPresent]    = 000bb326
                 f3 48 00

Windbg
Dealing with ASLR During Debugging
While debugging the sample in WinDbg, the module list showed that the executable was loaded at a different base address:
0:000> lm

start    end        module name
00bd0000 00d00000   sample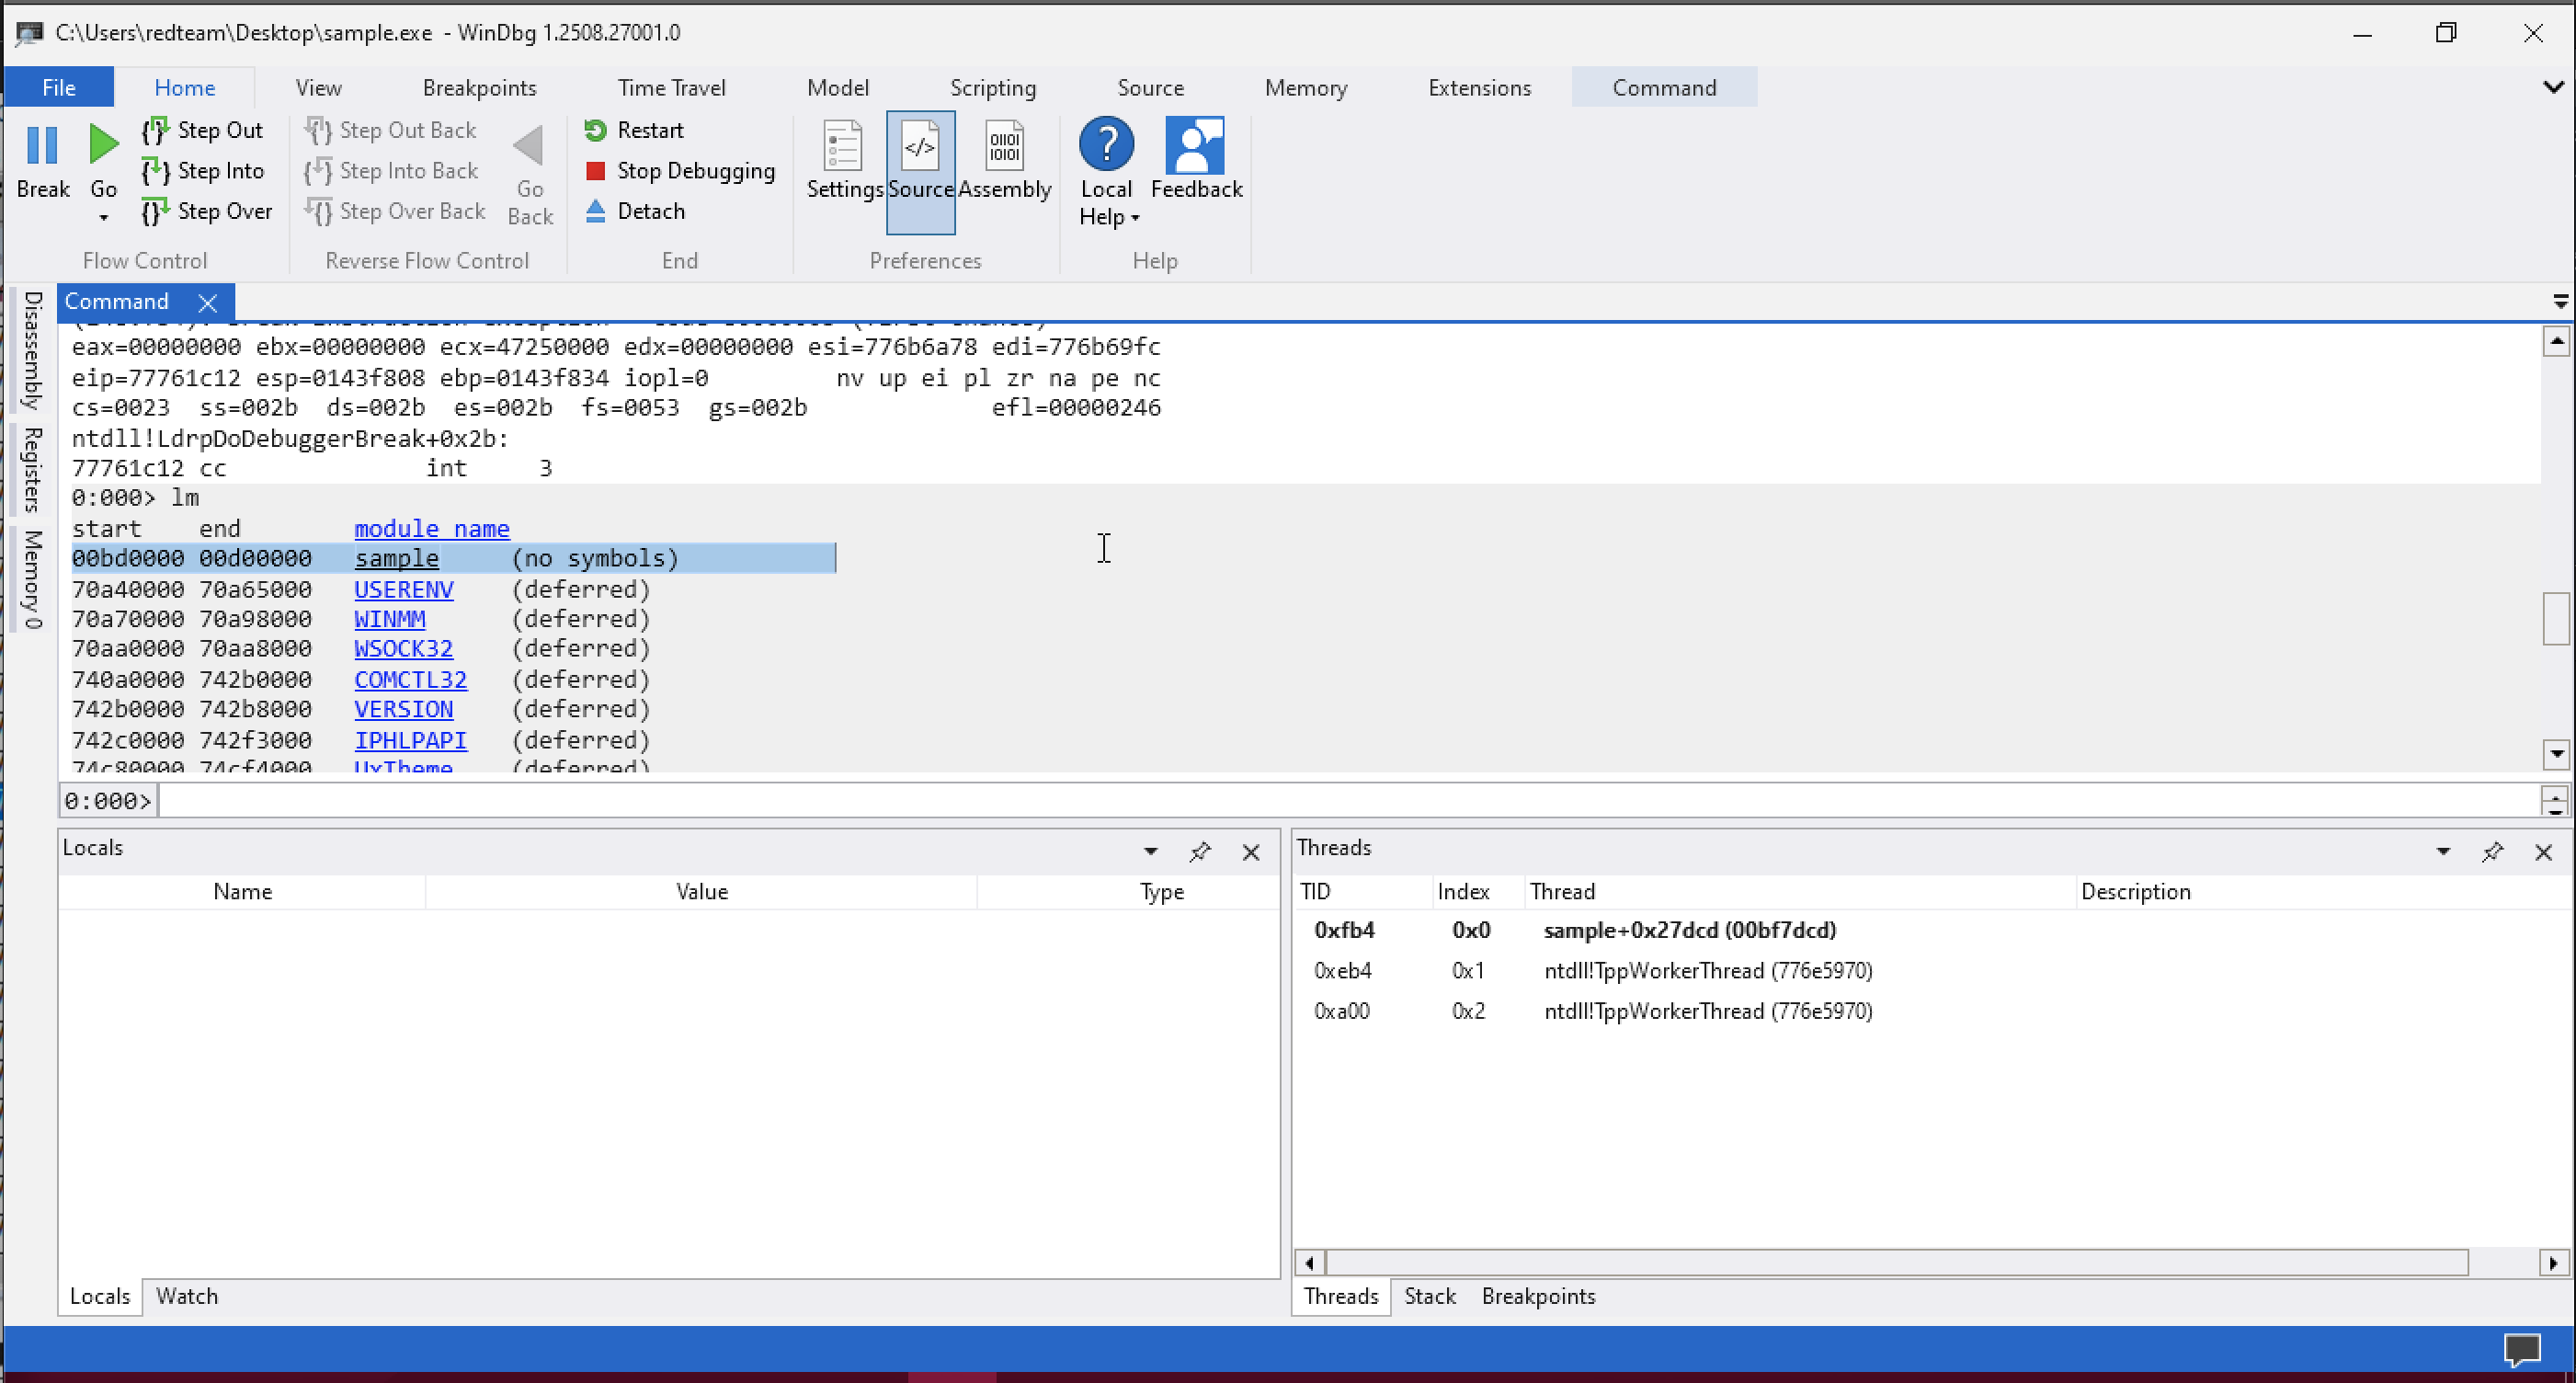
Originally, the static analysis in Ghidra showed the anti-debugging call at:
00403B7AHowever, because the program uses ASLR (Address Space Layout Randomization), the executable is relocated in memory each time it runs. This means the runtime address inside WinDbg will be different from the address seen in Ghidra.
To calculate the correct runtime breakpoint address:
Runtime Address =
(New Base Address) + (Original RVA)
The original image base in Ghidra is:
00400000The runtime base in WinDbg is:
00BD0000The RVA of the instruction:
00403B7A - 00400000 = 0x3B7AAdding the RVA to the new base:
00BD0000 + 0x3B7A = 00BD3B7ASo the correct breakpoint address in WinDbg becomes:
bp 00BD3B7AThis allows us to break exactly at the IsDebuggerPresent() call even with ASLR enabled.
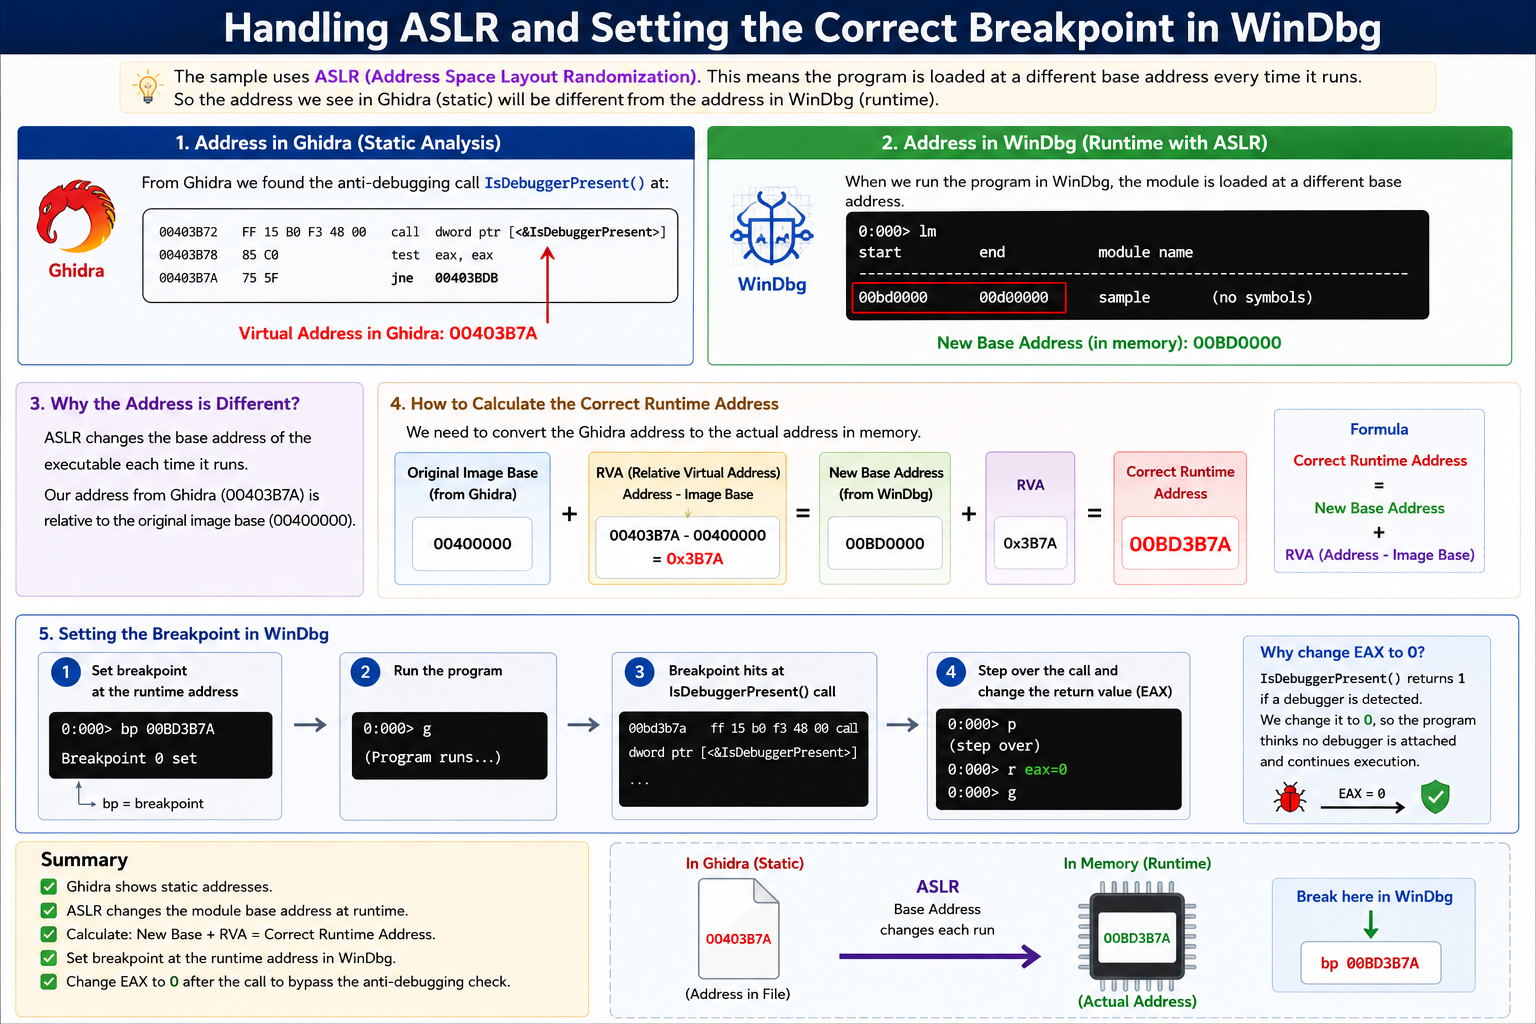
Setting Breakpoints in WinDbg
After calculating the correct runtime address caused by ASLR, I set two important breakpoints in WinDbg:
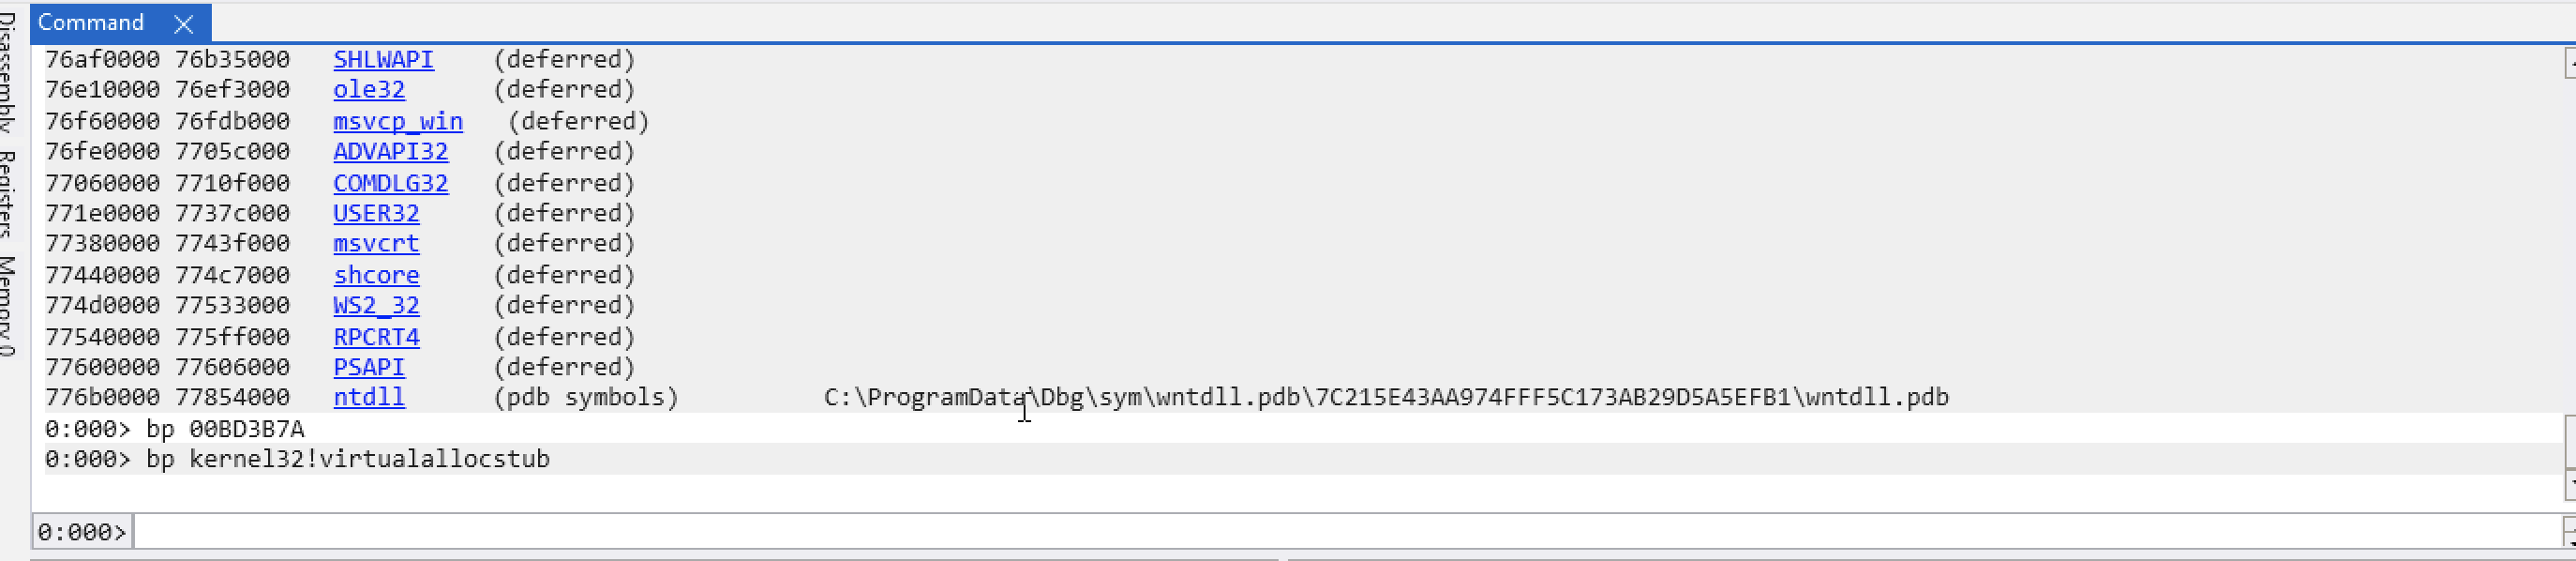
0:000> bp 00BD3B7A
0:000> bp kernel32!virtualallocstubbp 00BD3B7A sets a breakpoint at the IsDebuggerPresent() check. Once hit, I changed the EAX register to 0 to bypass the anti-debugging protection.bp kernel32!VirtualAllocStub monitors memory allocation activity. Malware commonly uses VirtualAlloc during unpacking, shellcode loading, or payload decryption, making it useful for tracking runtime behavior.Now continue execution.
Hit the breakpoint:
00bd3b7a ff1530f3c500 call dword ptr [sample+0x8f330 (00c5f330)] ds:002b:00c5f330={KERNEL32!IsDebuggerPresentStub (75c62770)}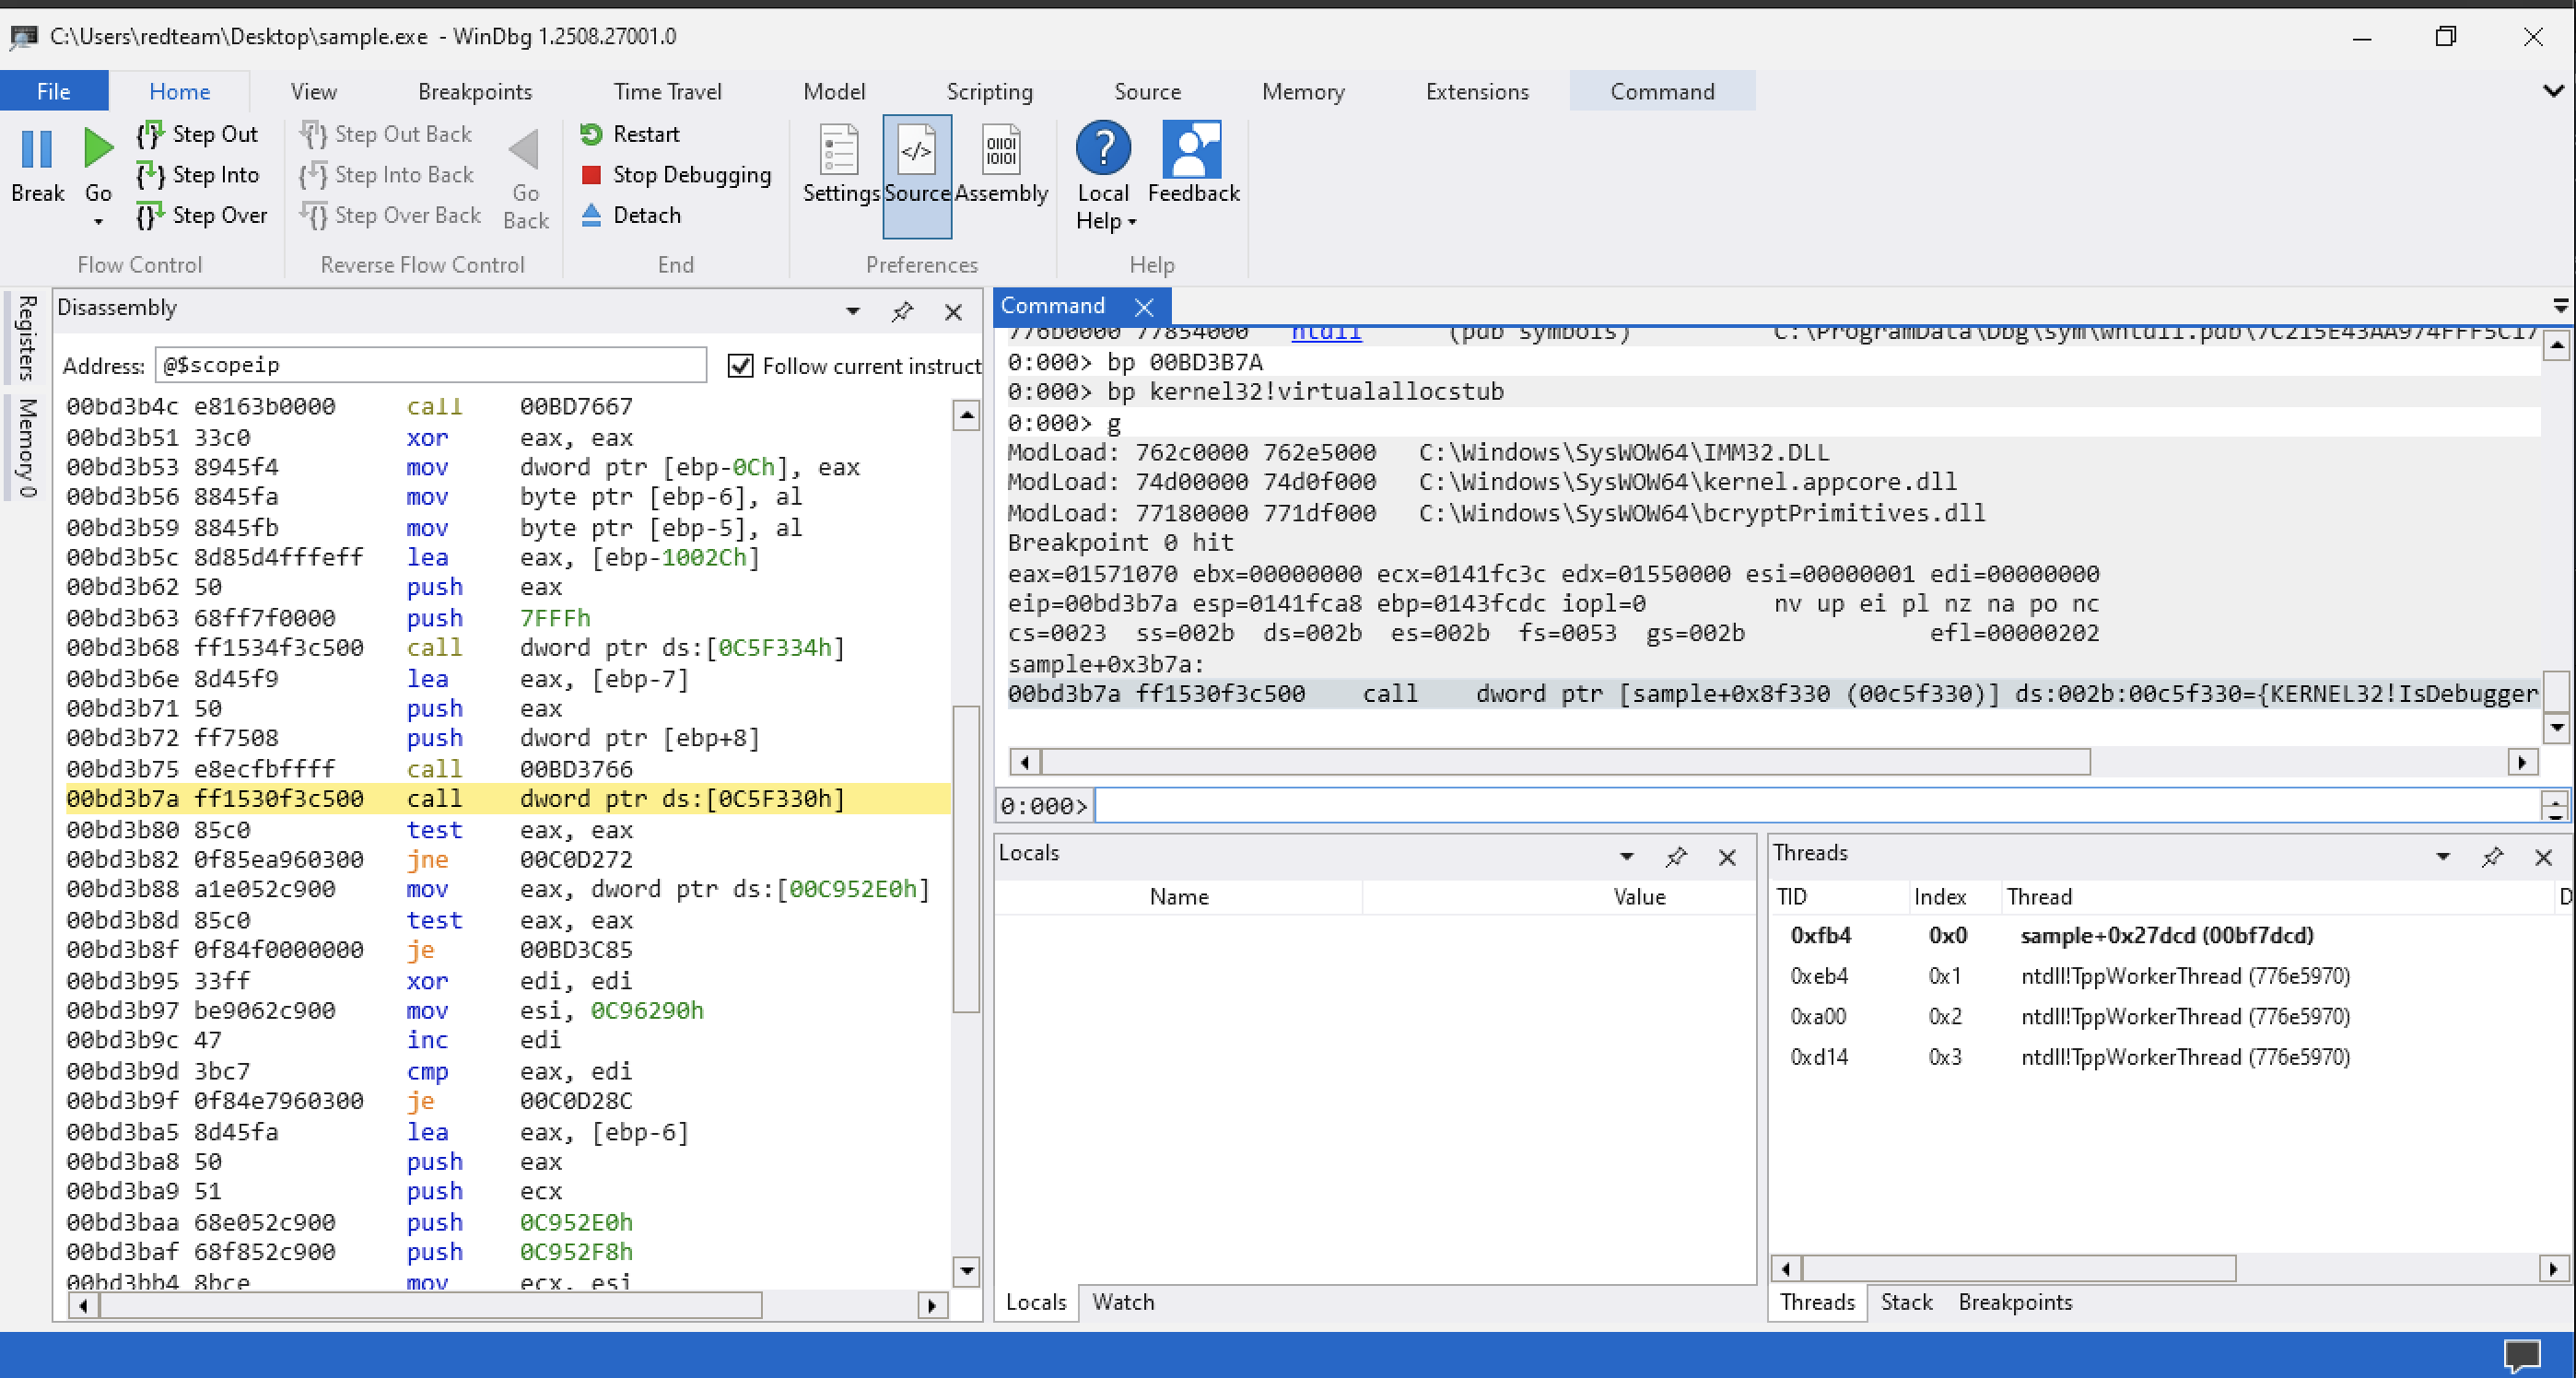
There’s no need to step into this function so let’s do step over and look at the value in the EAX register.
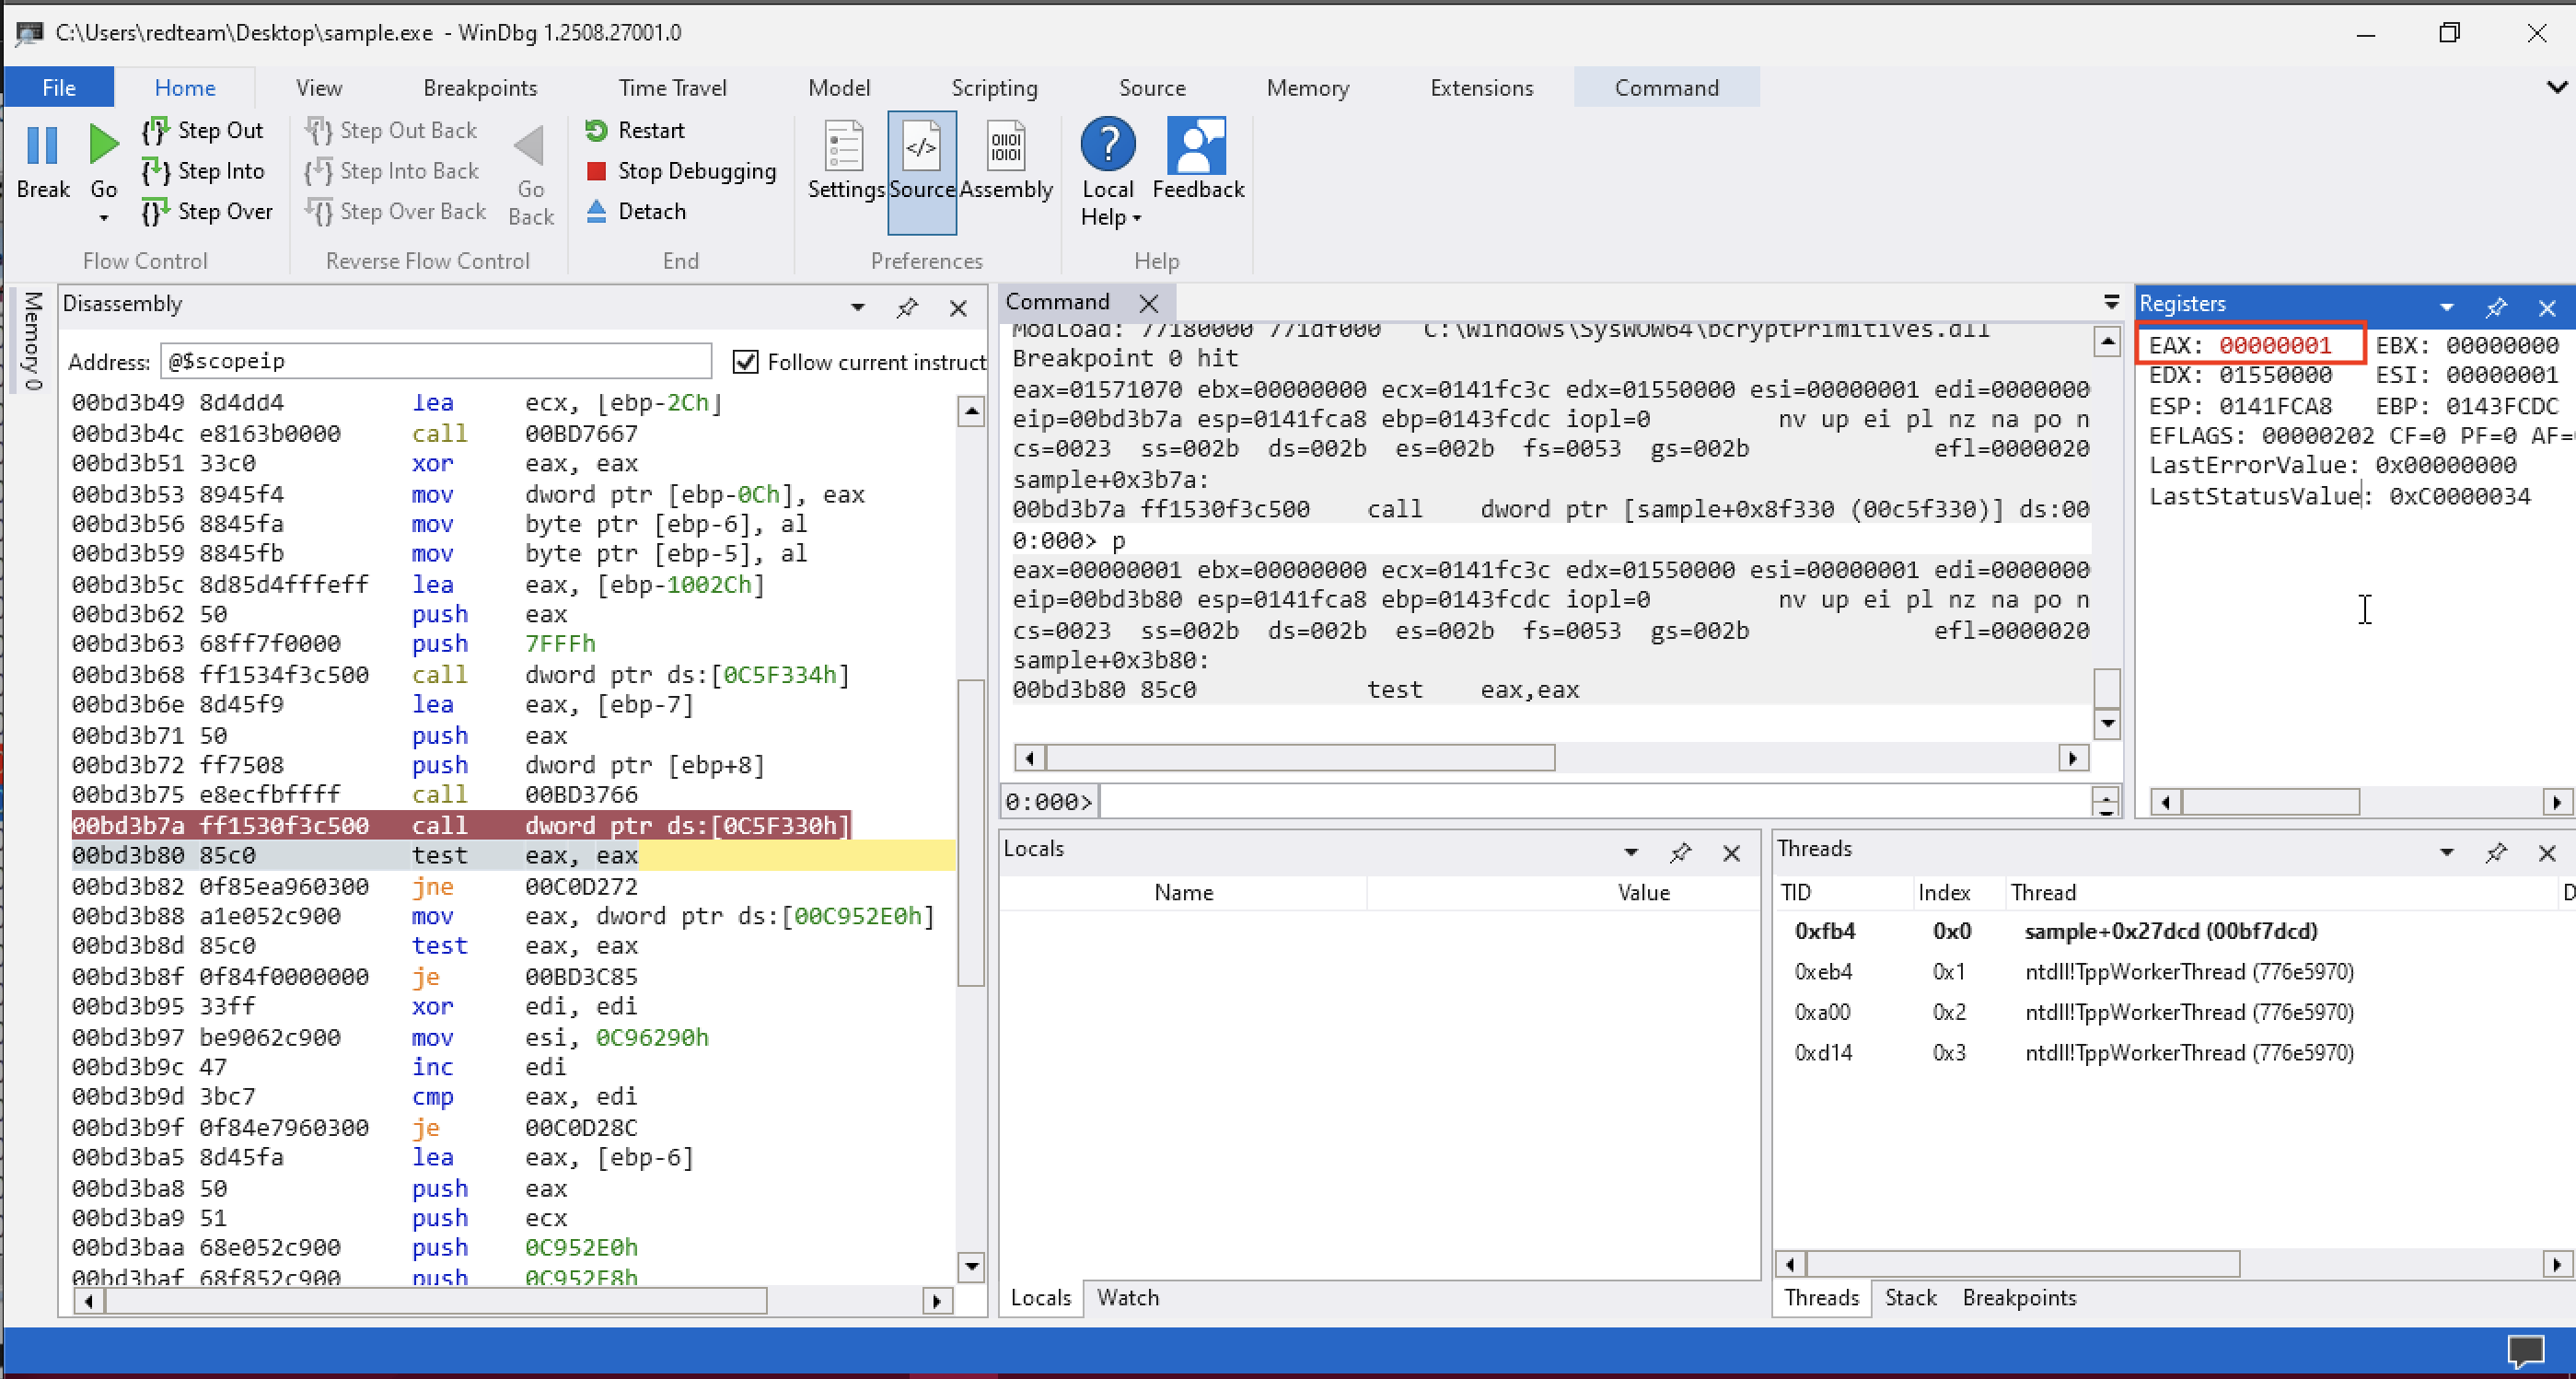
EAX = 1A value of 1 means the program successfully detected that a debugger was attached. To bypass this anti-debugging check, I manually changed the register value to: 0 .
In command:
r EAX = 0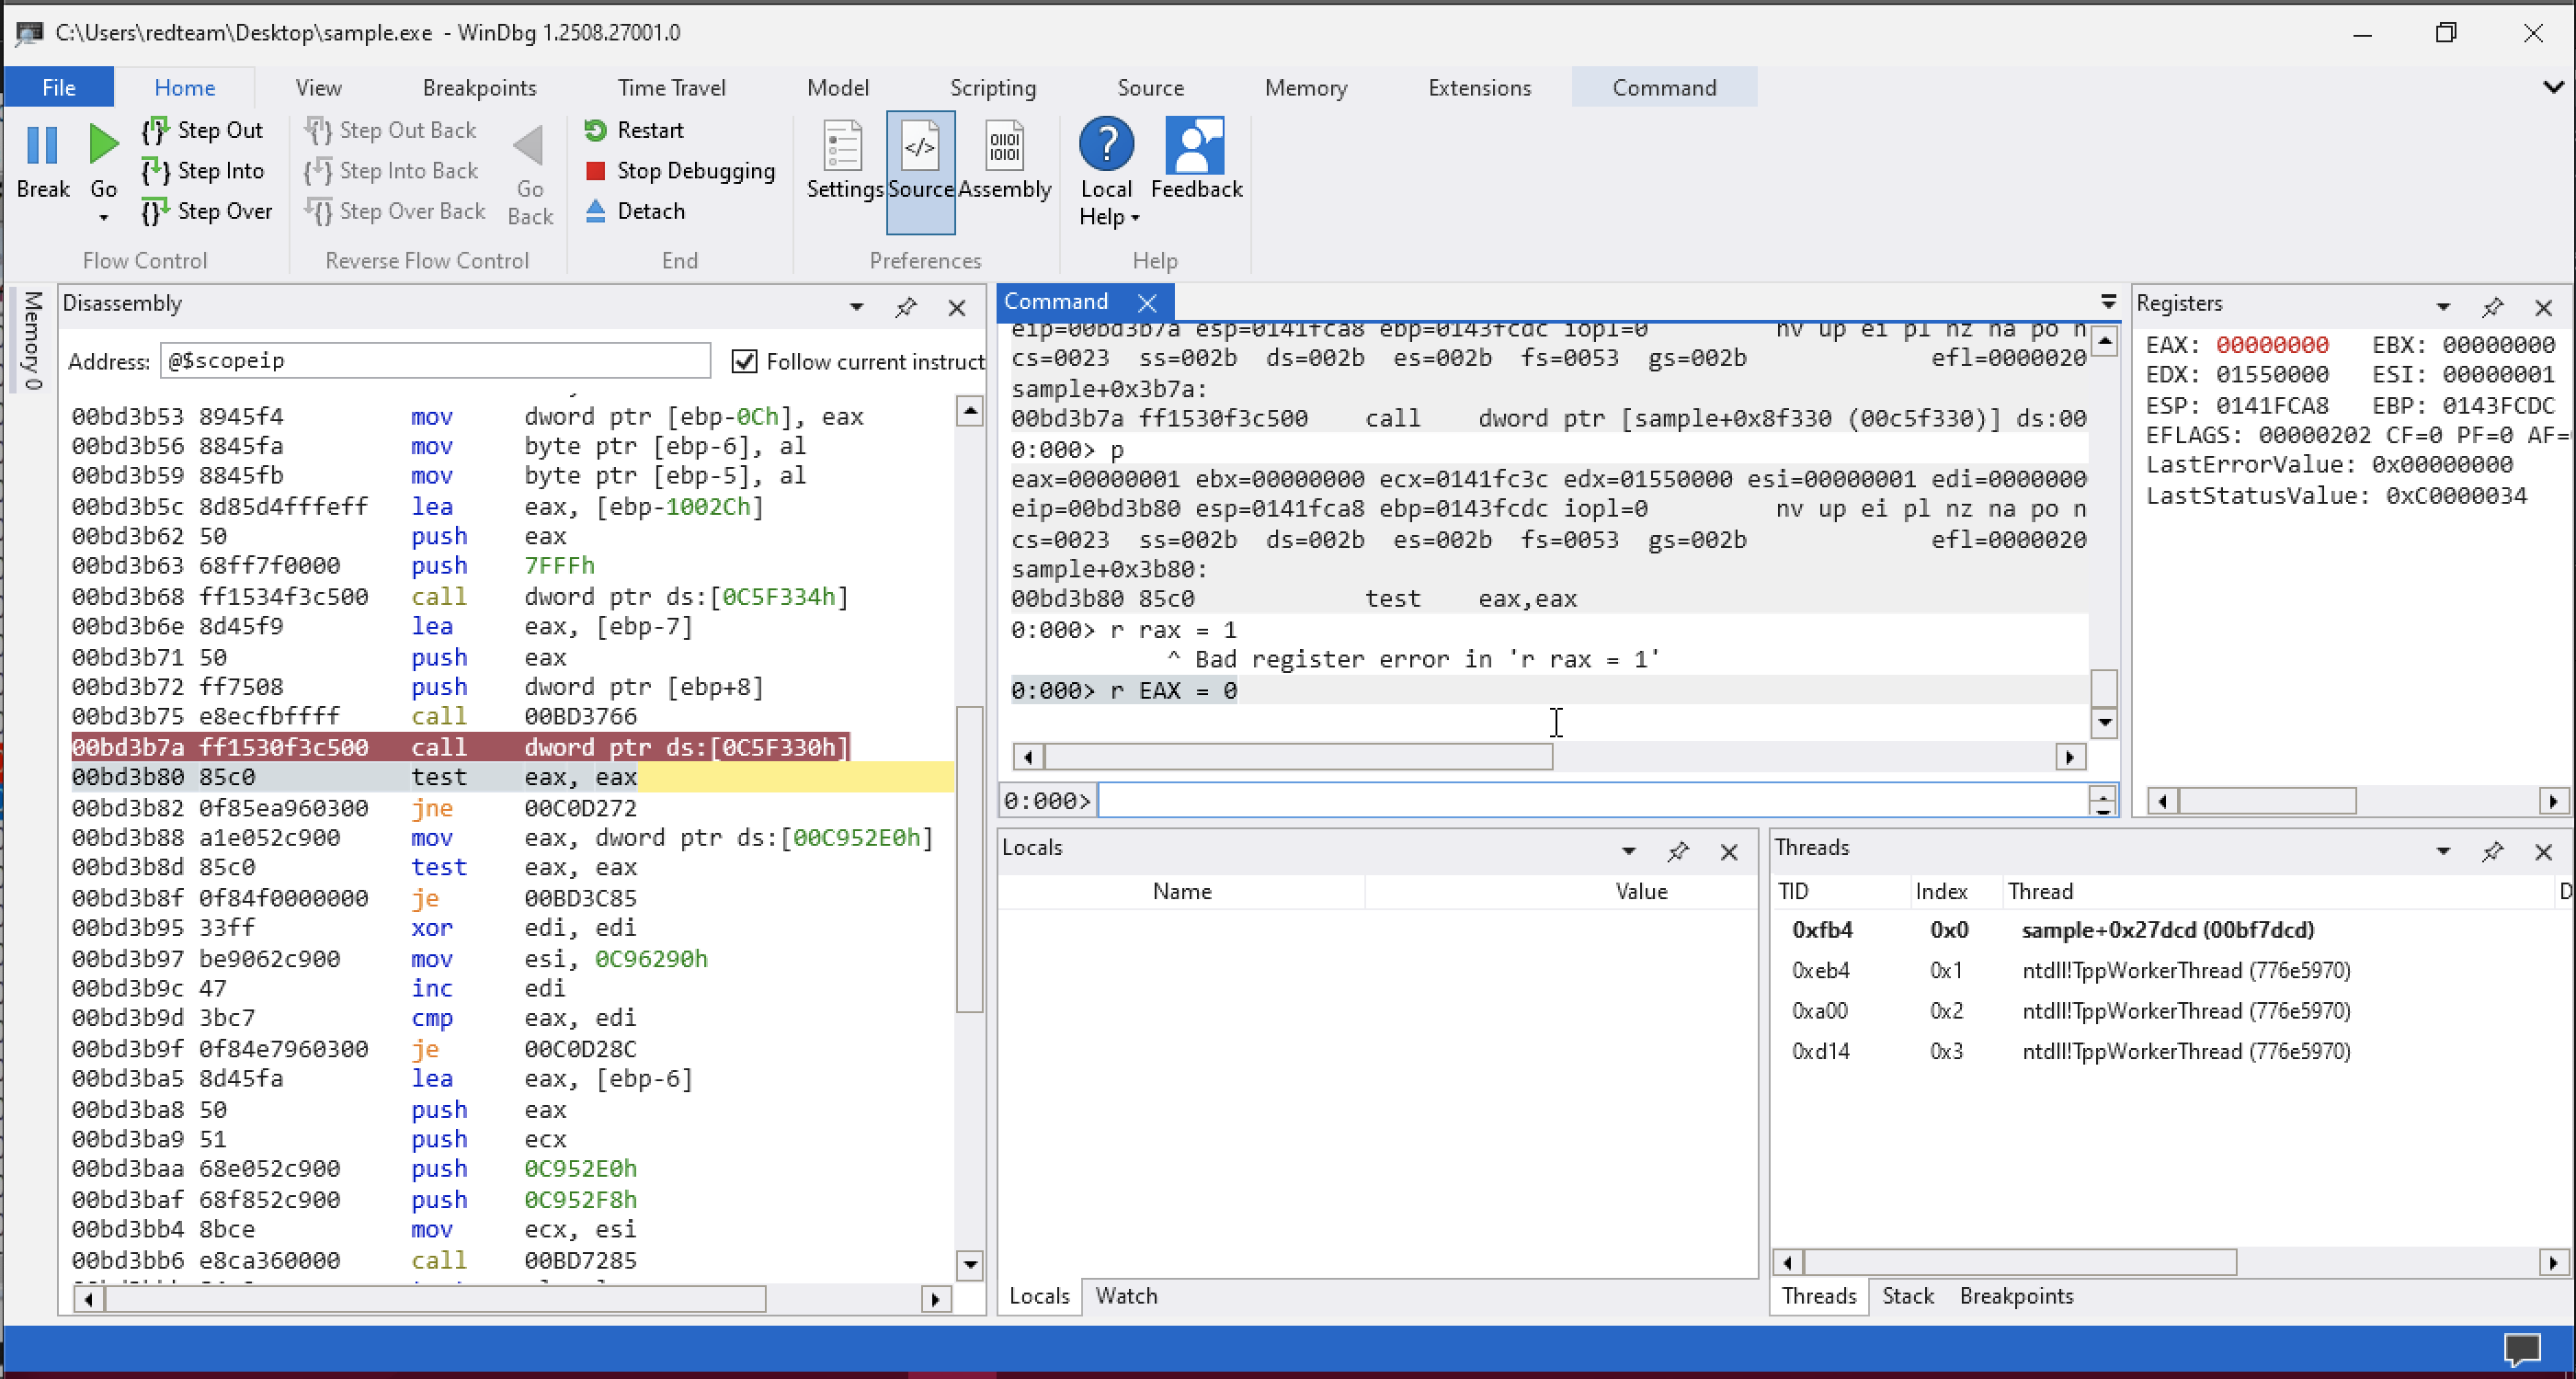
Setting EAX to 0 tricks the program into believing that no debugger is attached, allowing execution to continue normally.
Now resume execution until we hit VirtualAlloc.
Command to resume execution.
ghitting the breakpoint: kernel32!VirtualAllocStub .
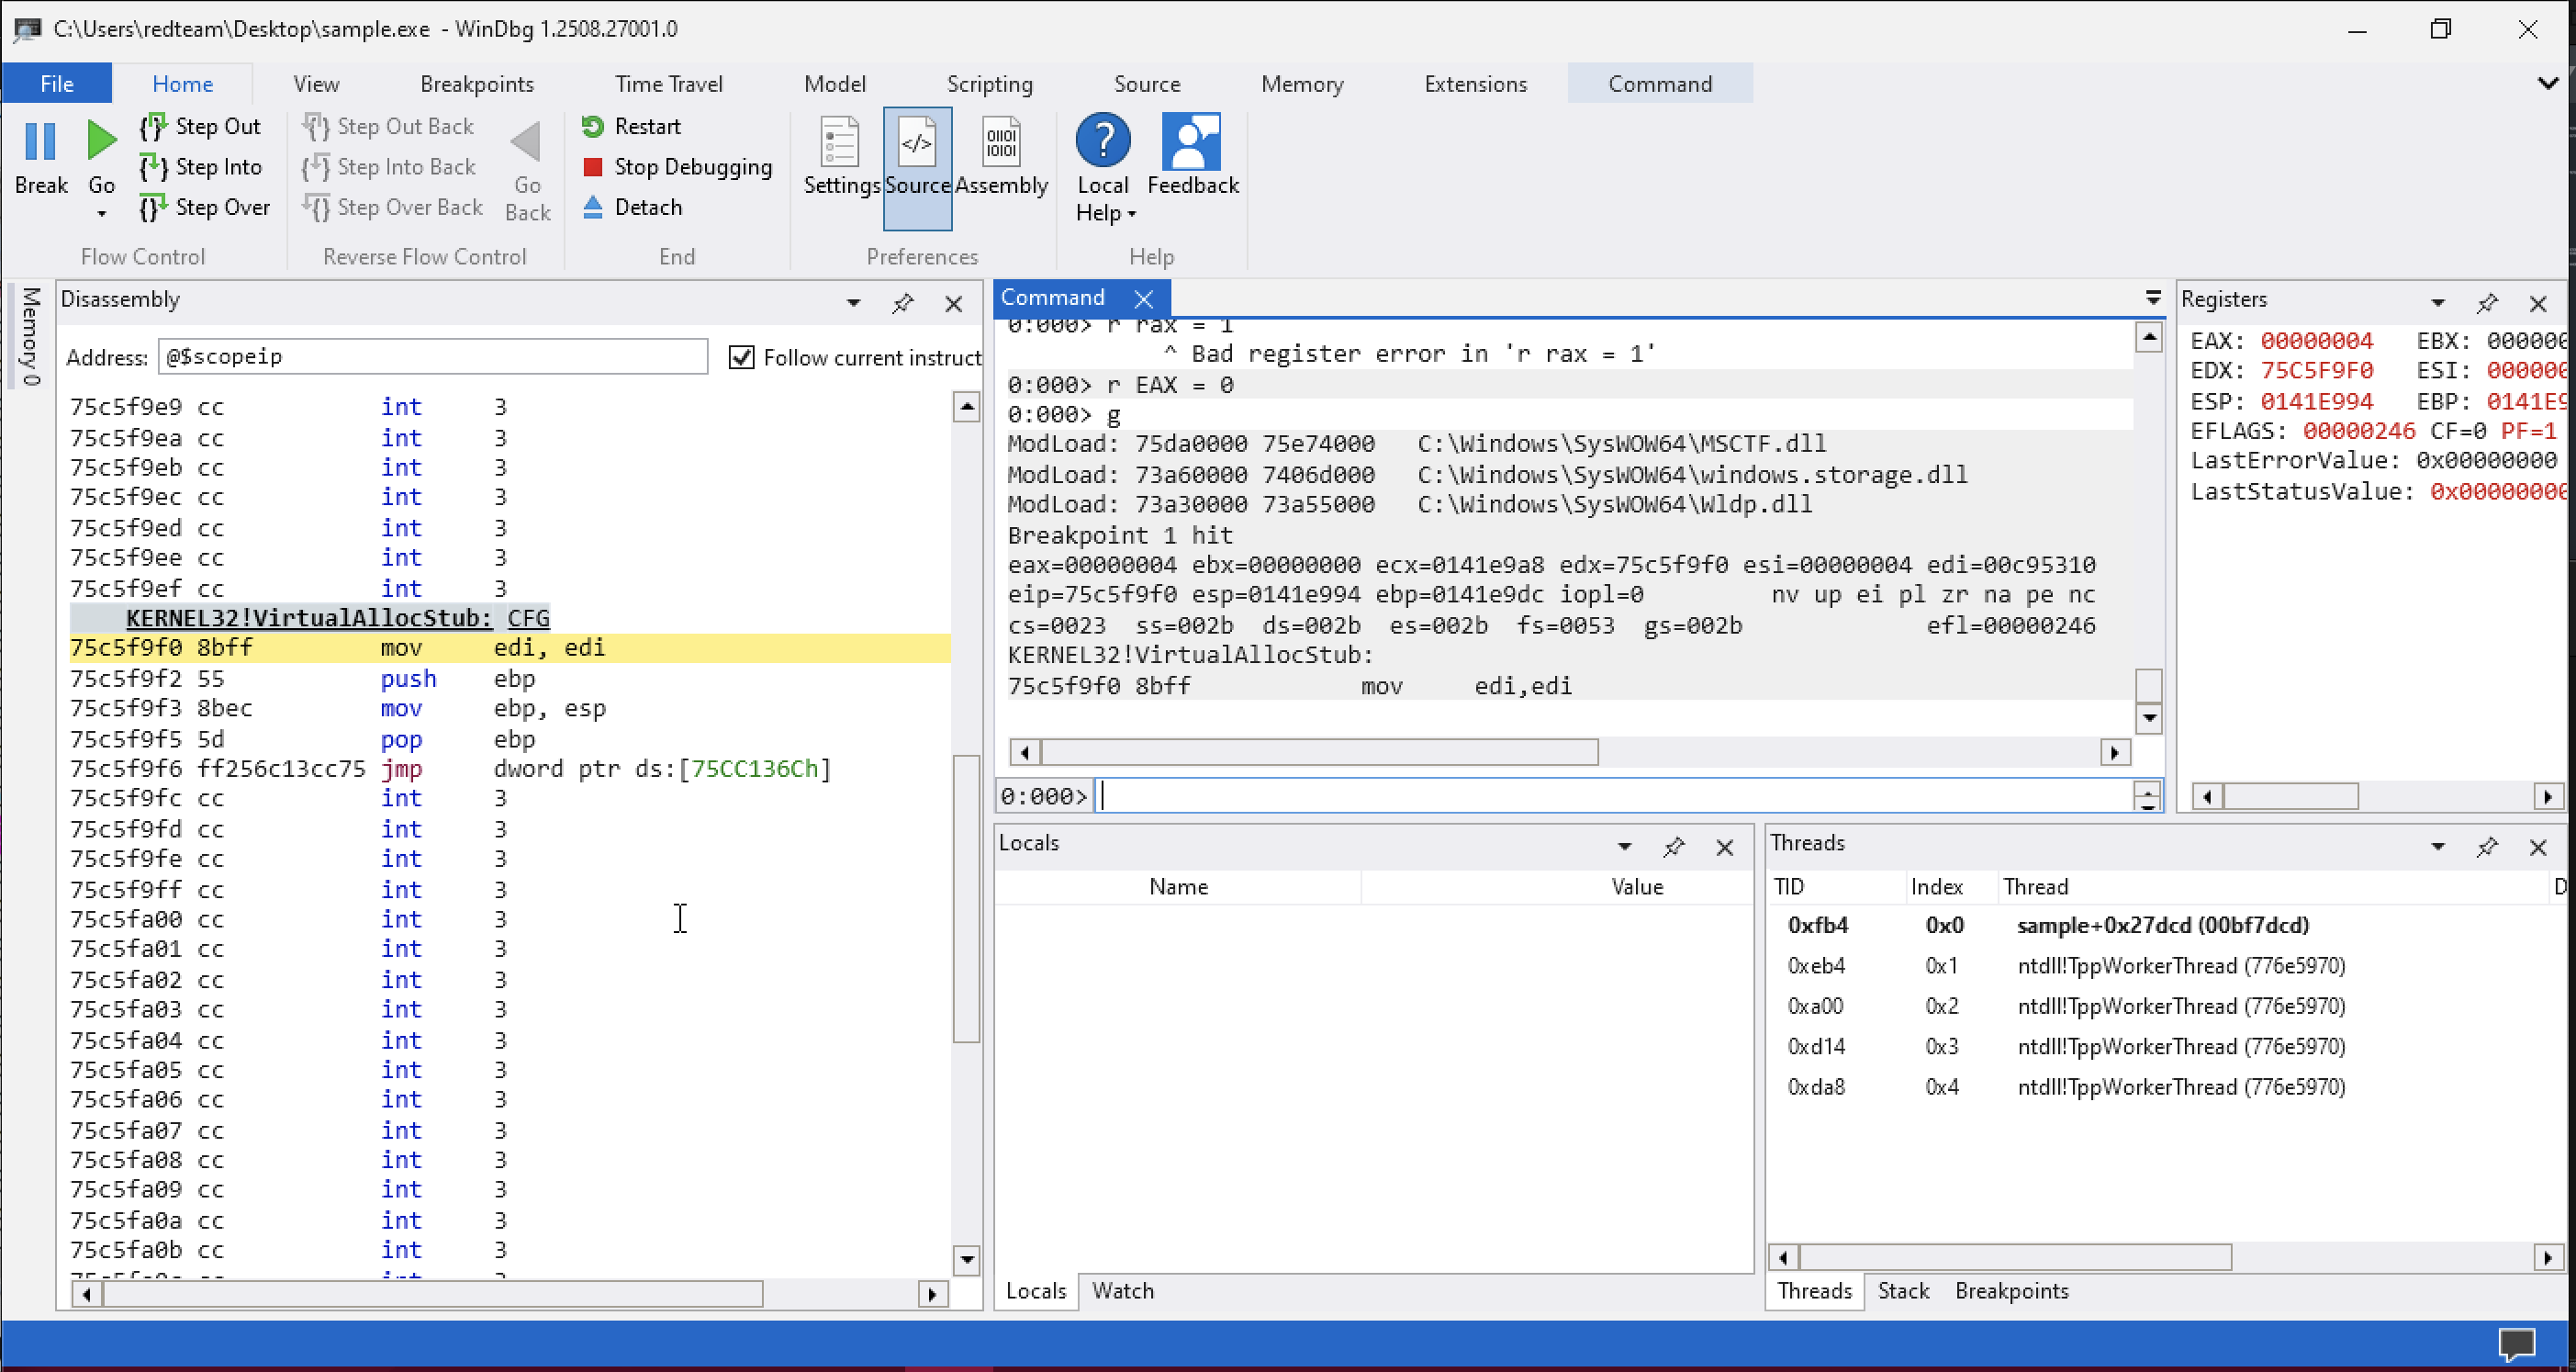
Once the breakpoint at VirtualAlloc was hit, I stepped into the API call to trace where the memory allocation request originated from, and then stepped out back into the malware code. This is useful because it gives insight into the actual memory address returned by VirtualAlloc(). In Windows x86 binaries, the return value of a function is stored in the EAX register.
Step into.
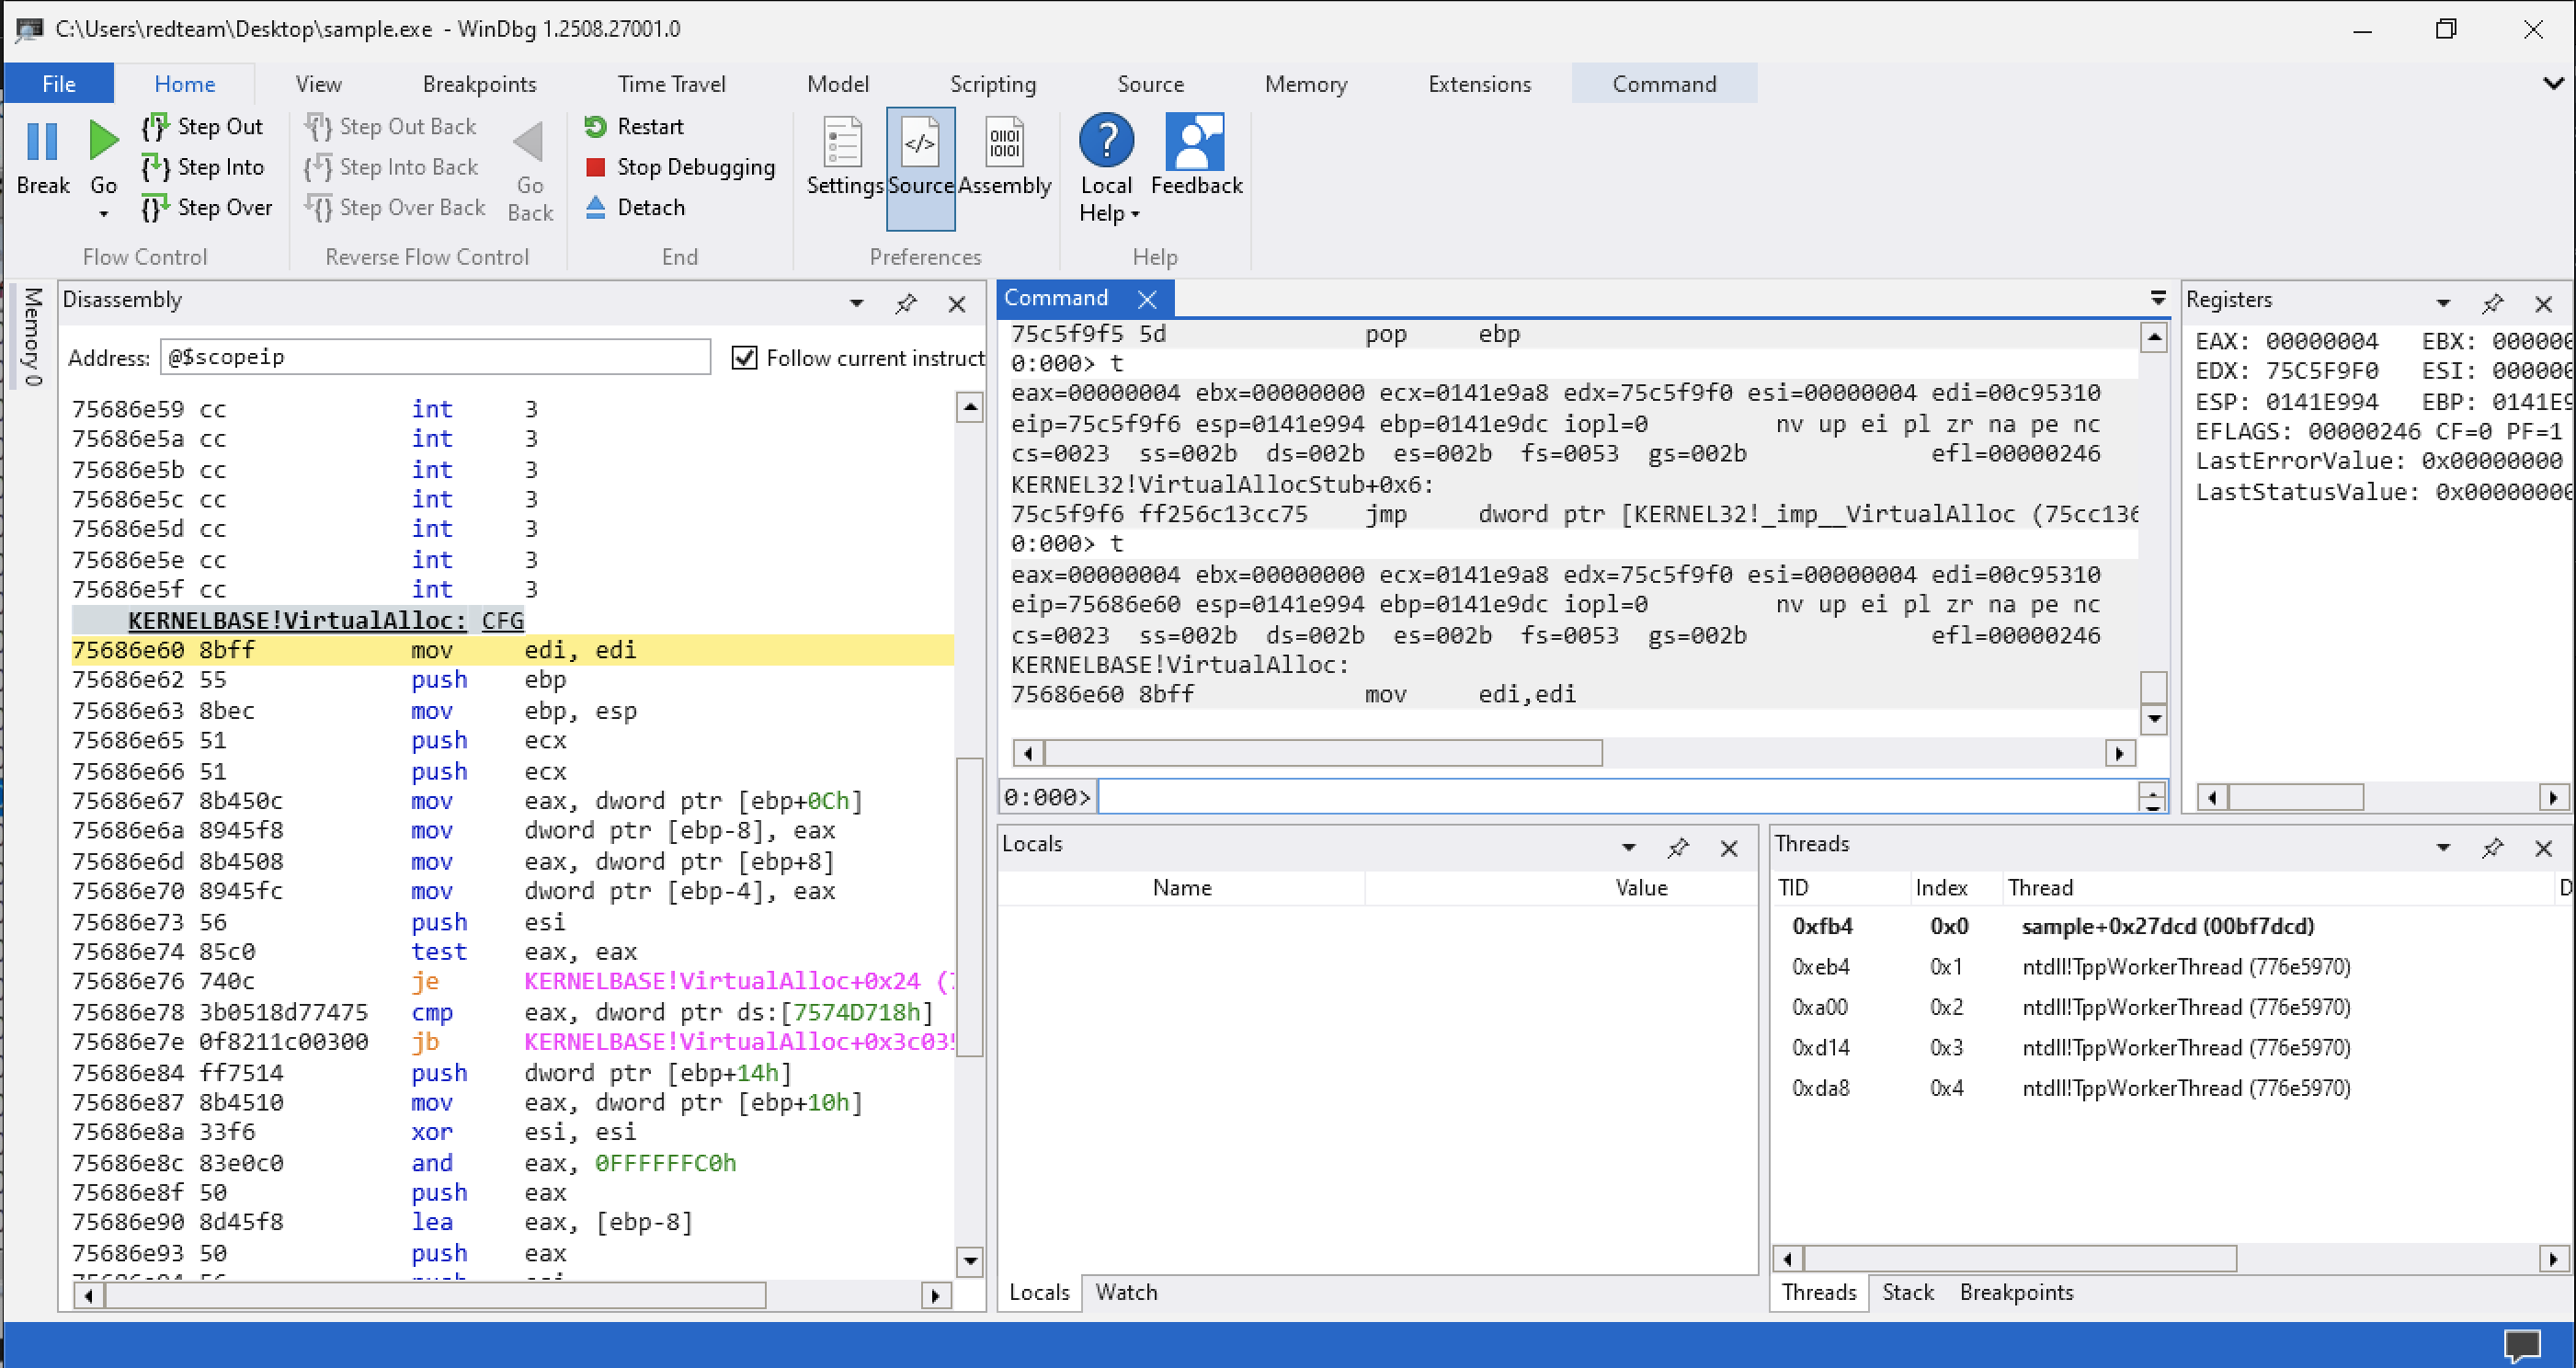
Then Step out.
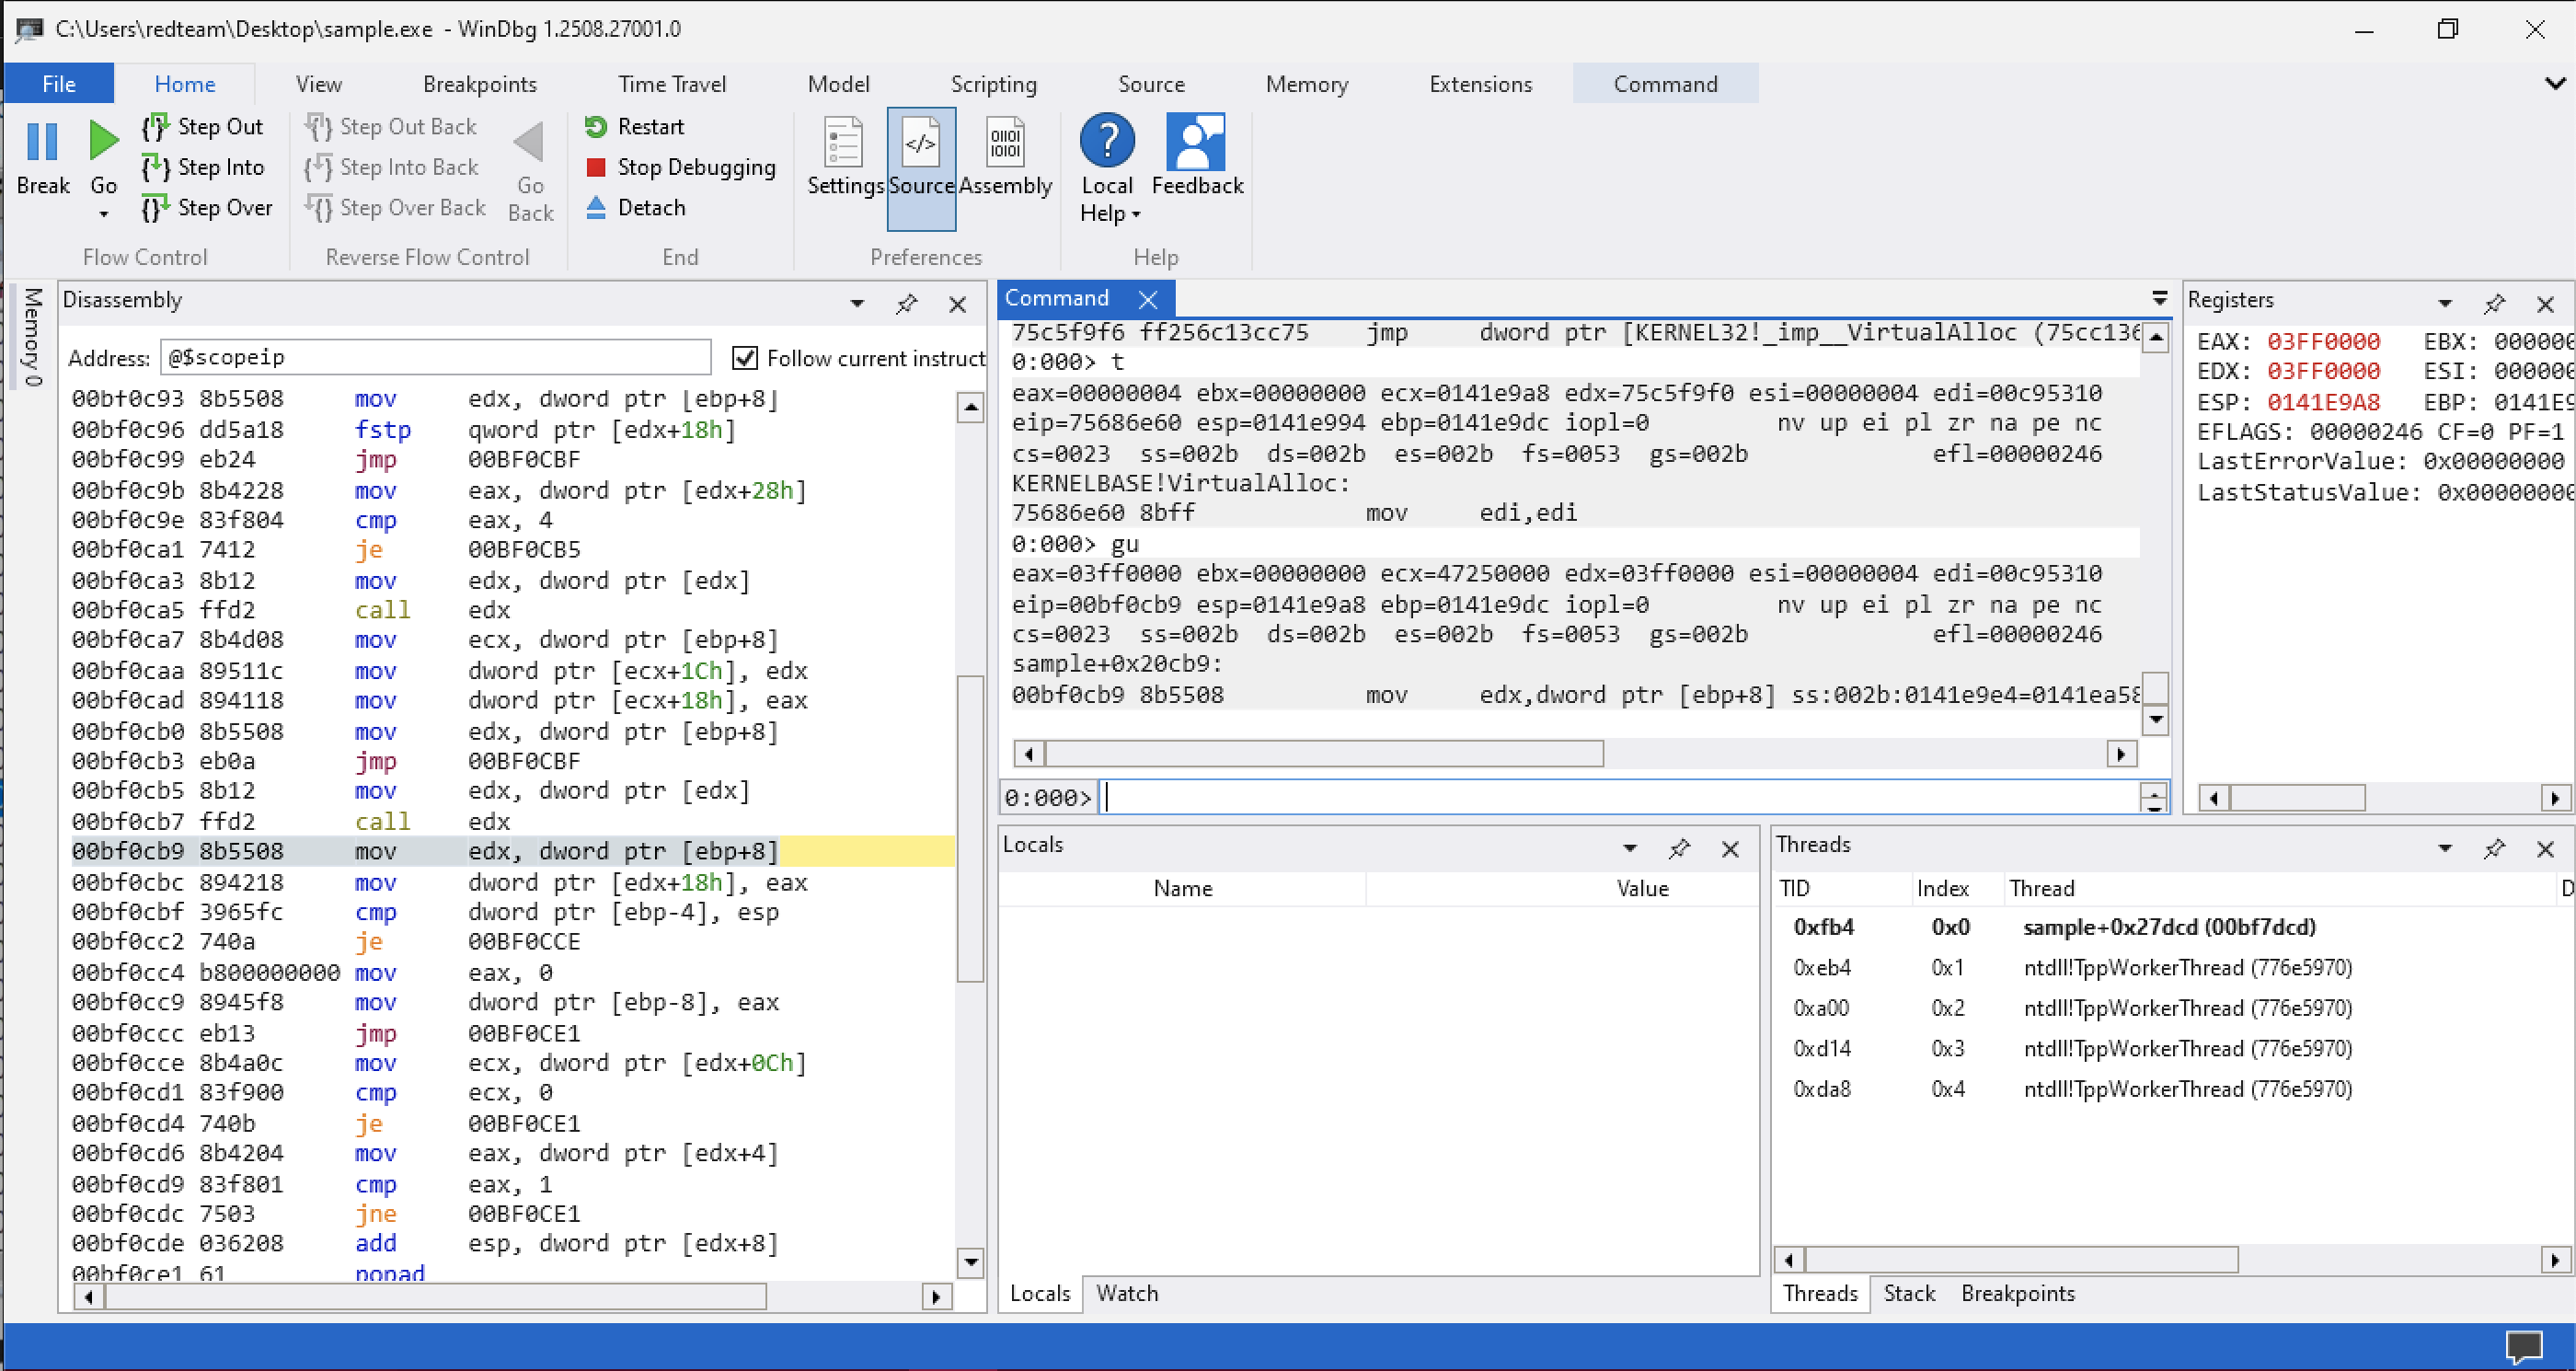
This will give us inside into the actual value the address that was return from the function call. This will be held in EAX.
After stepping out of VirtualAlloc, the newly allocated memory address could be observed directly in EAX. This address is important because malware often uses this allocated memory region to unpack, decrypt, or load its real payload during runtime.
I used the following WinDbg command to inspect the memory protection of the allocated region:
0:000> !vprot eaxThe output showed:
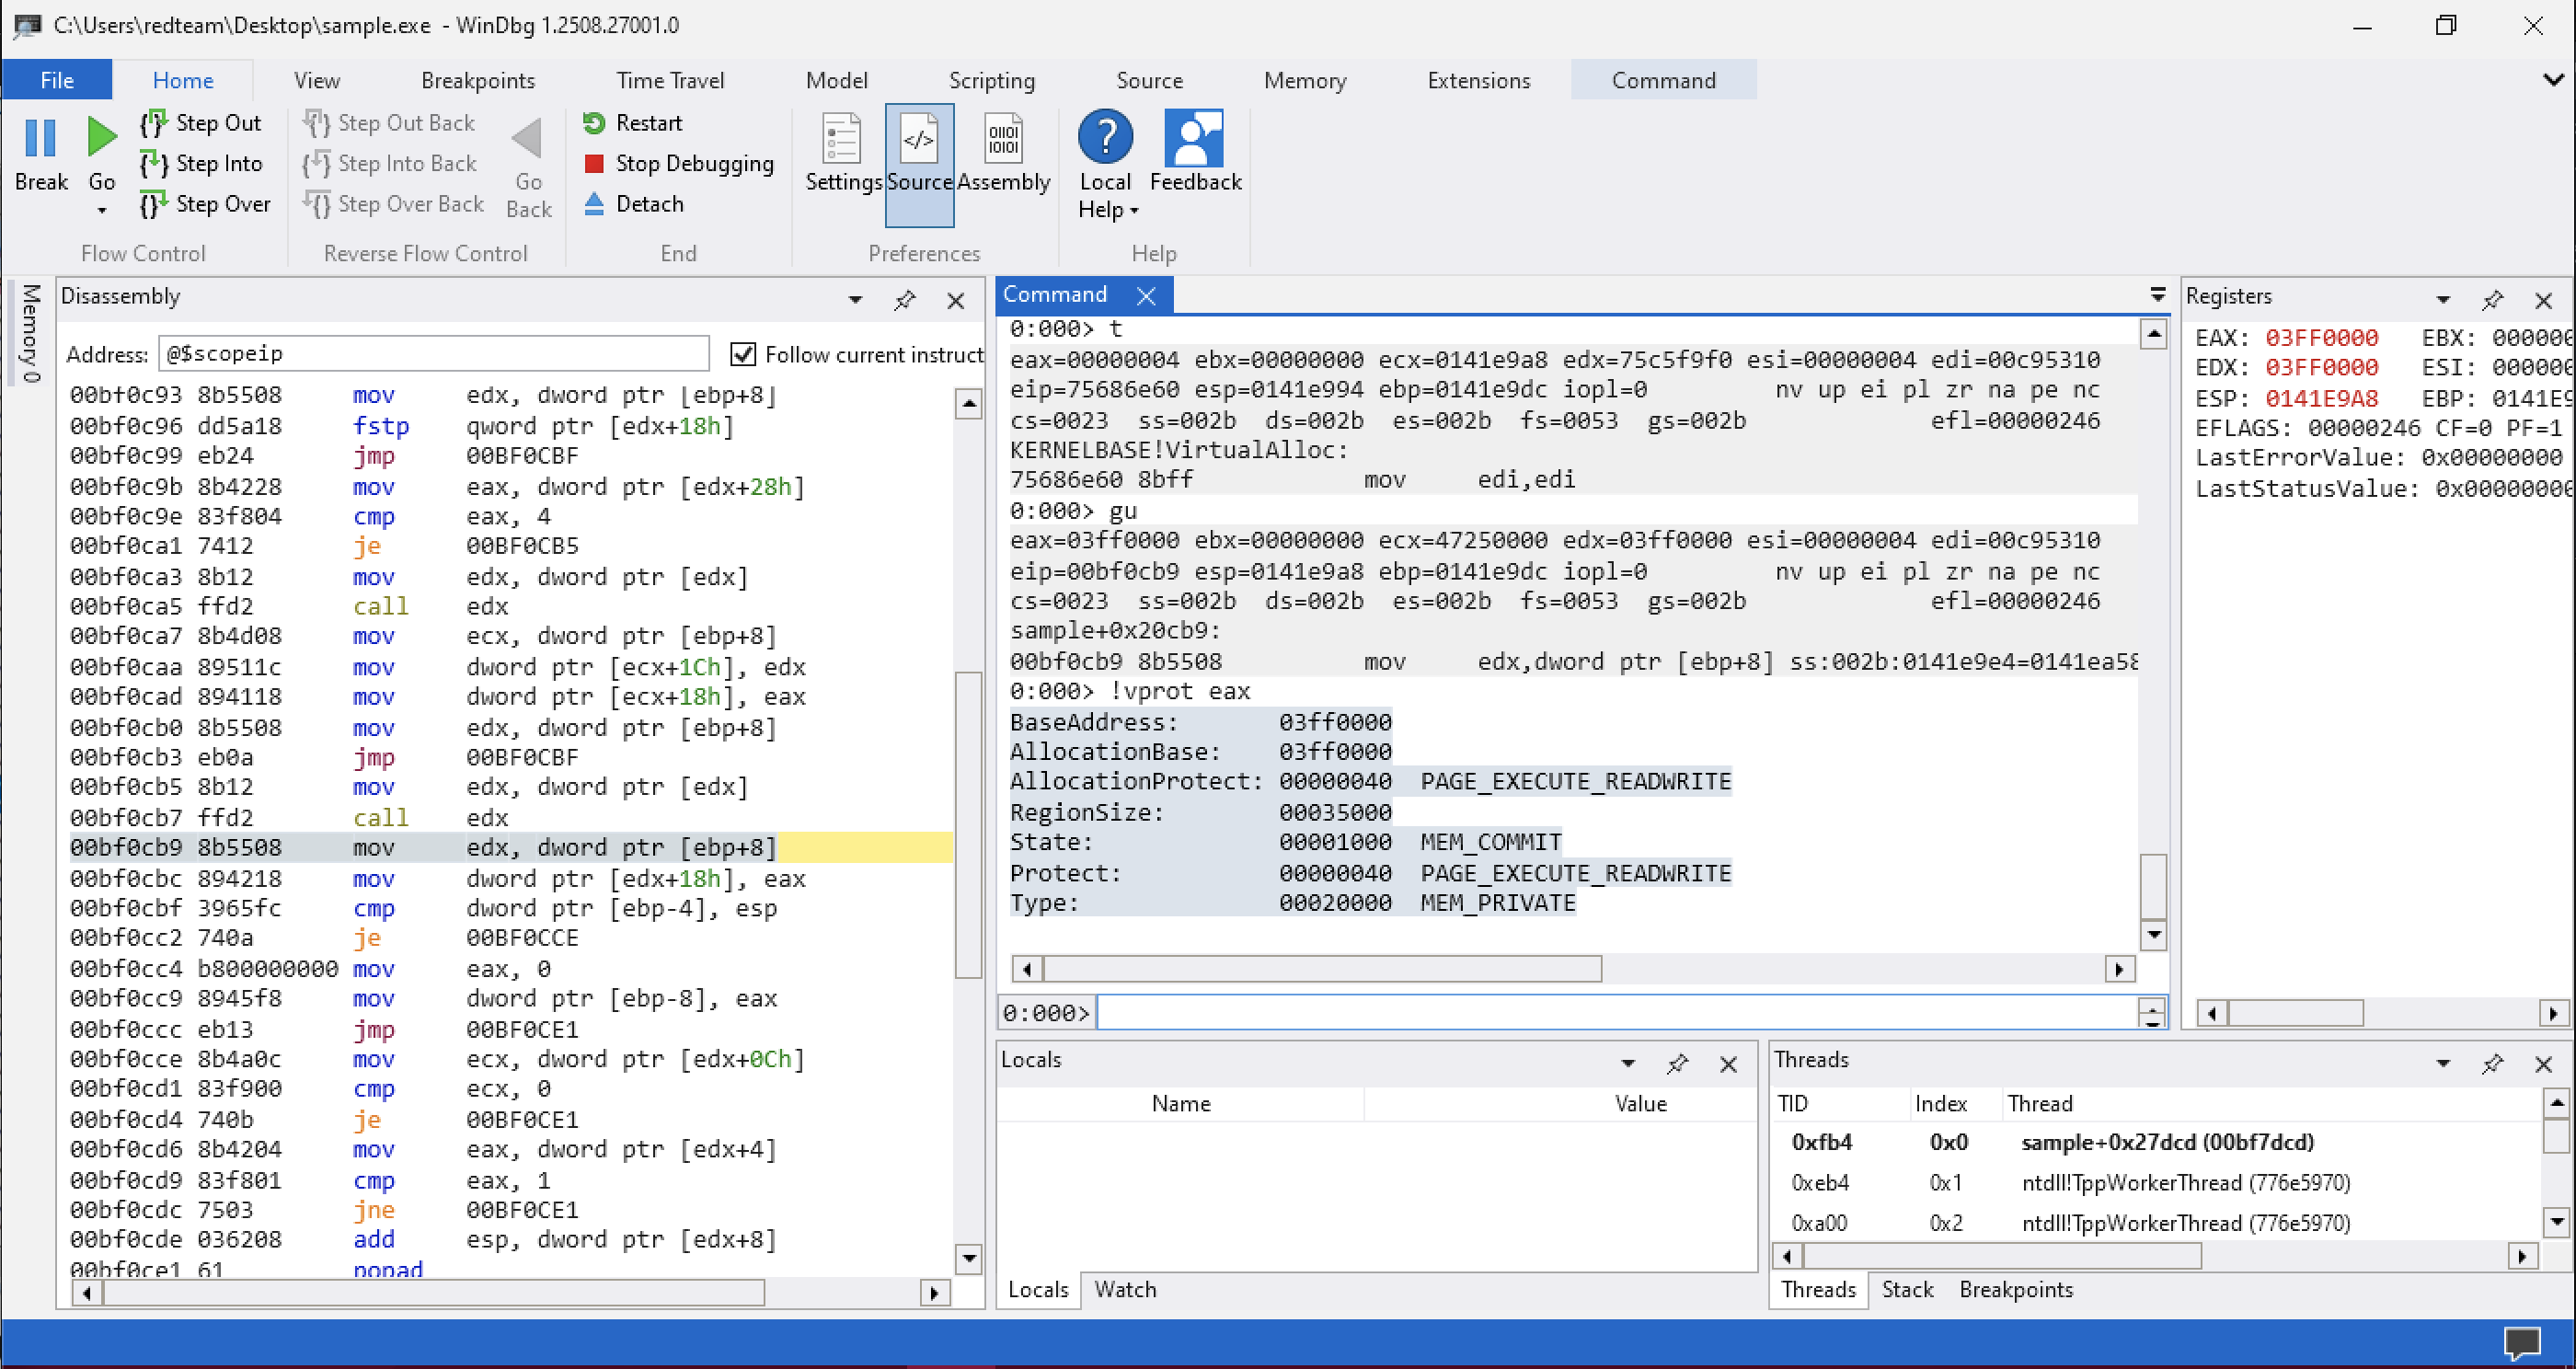
BaseAddress:       03ff0000
AllocationBase:    03ff0000
AllocationProtect: 00000040  PAGE_EXECUTE_READWRITE
RegionSize:        00035000
State:             00001000  MEM_COMMIT
Protect:           00000040  PAGE_EXECUTE_READWRITE
Type:              00020000  MEM_PRIVATE
This means the allocated memory region has:
Memory regions with PAGE_EXECUTE_READWRITE permissions are highly suspicious because malware commonly uses them for:
The memory was also marked as:
MEM_PRIVATEwhich indicates that the region was dynamically allocated during runtime rather than being part of the original executable. This suggests that the malware is likely preparing to unpack or execute additional code in memory.
Observing Additional Memory Allocations
During further debugging, the malware performed another call to VirtualAlloc(), indicating that additional memory was being allocated dynamically at runtime. This behavior is commonly seen in unpacking routines or shellcode loaders.
While analyzing the extracted AutoIt script, two different arrays were identified that appeared to contain encoded or embedded shellcode data. This strongly suggested that the malware was allocating memory in order to copy and execute these payloads dynamically.
To continue the analysis, I followed the same approach as before:
VirtualAlloc,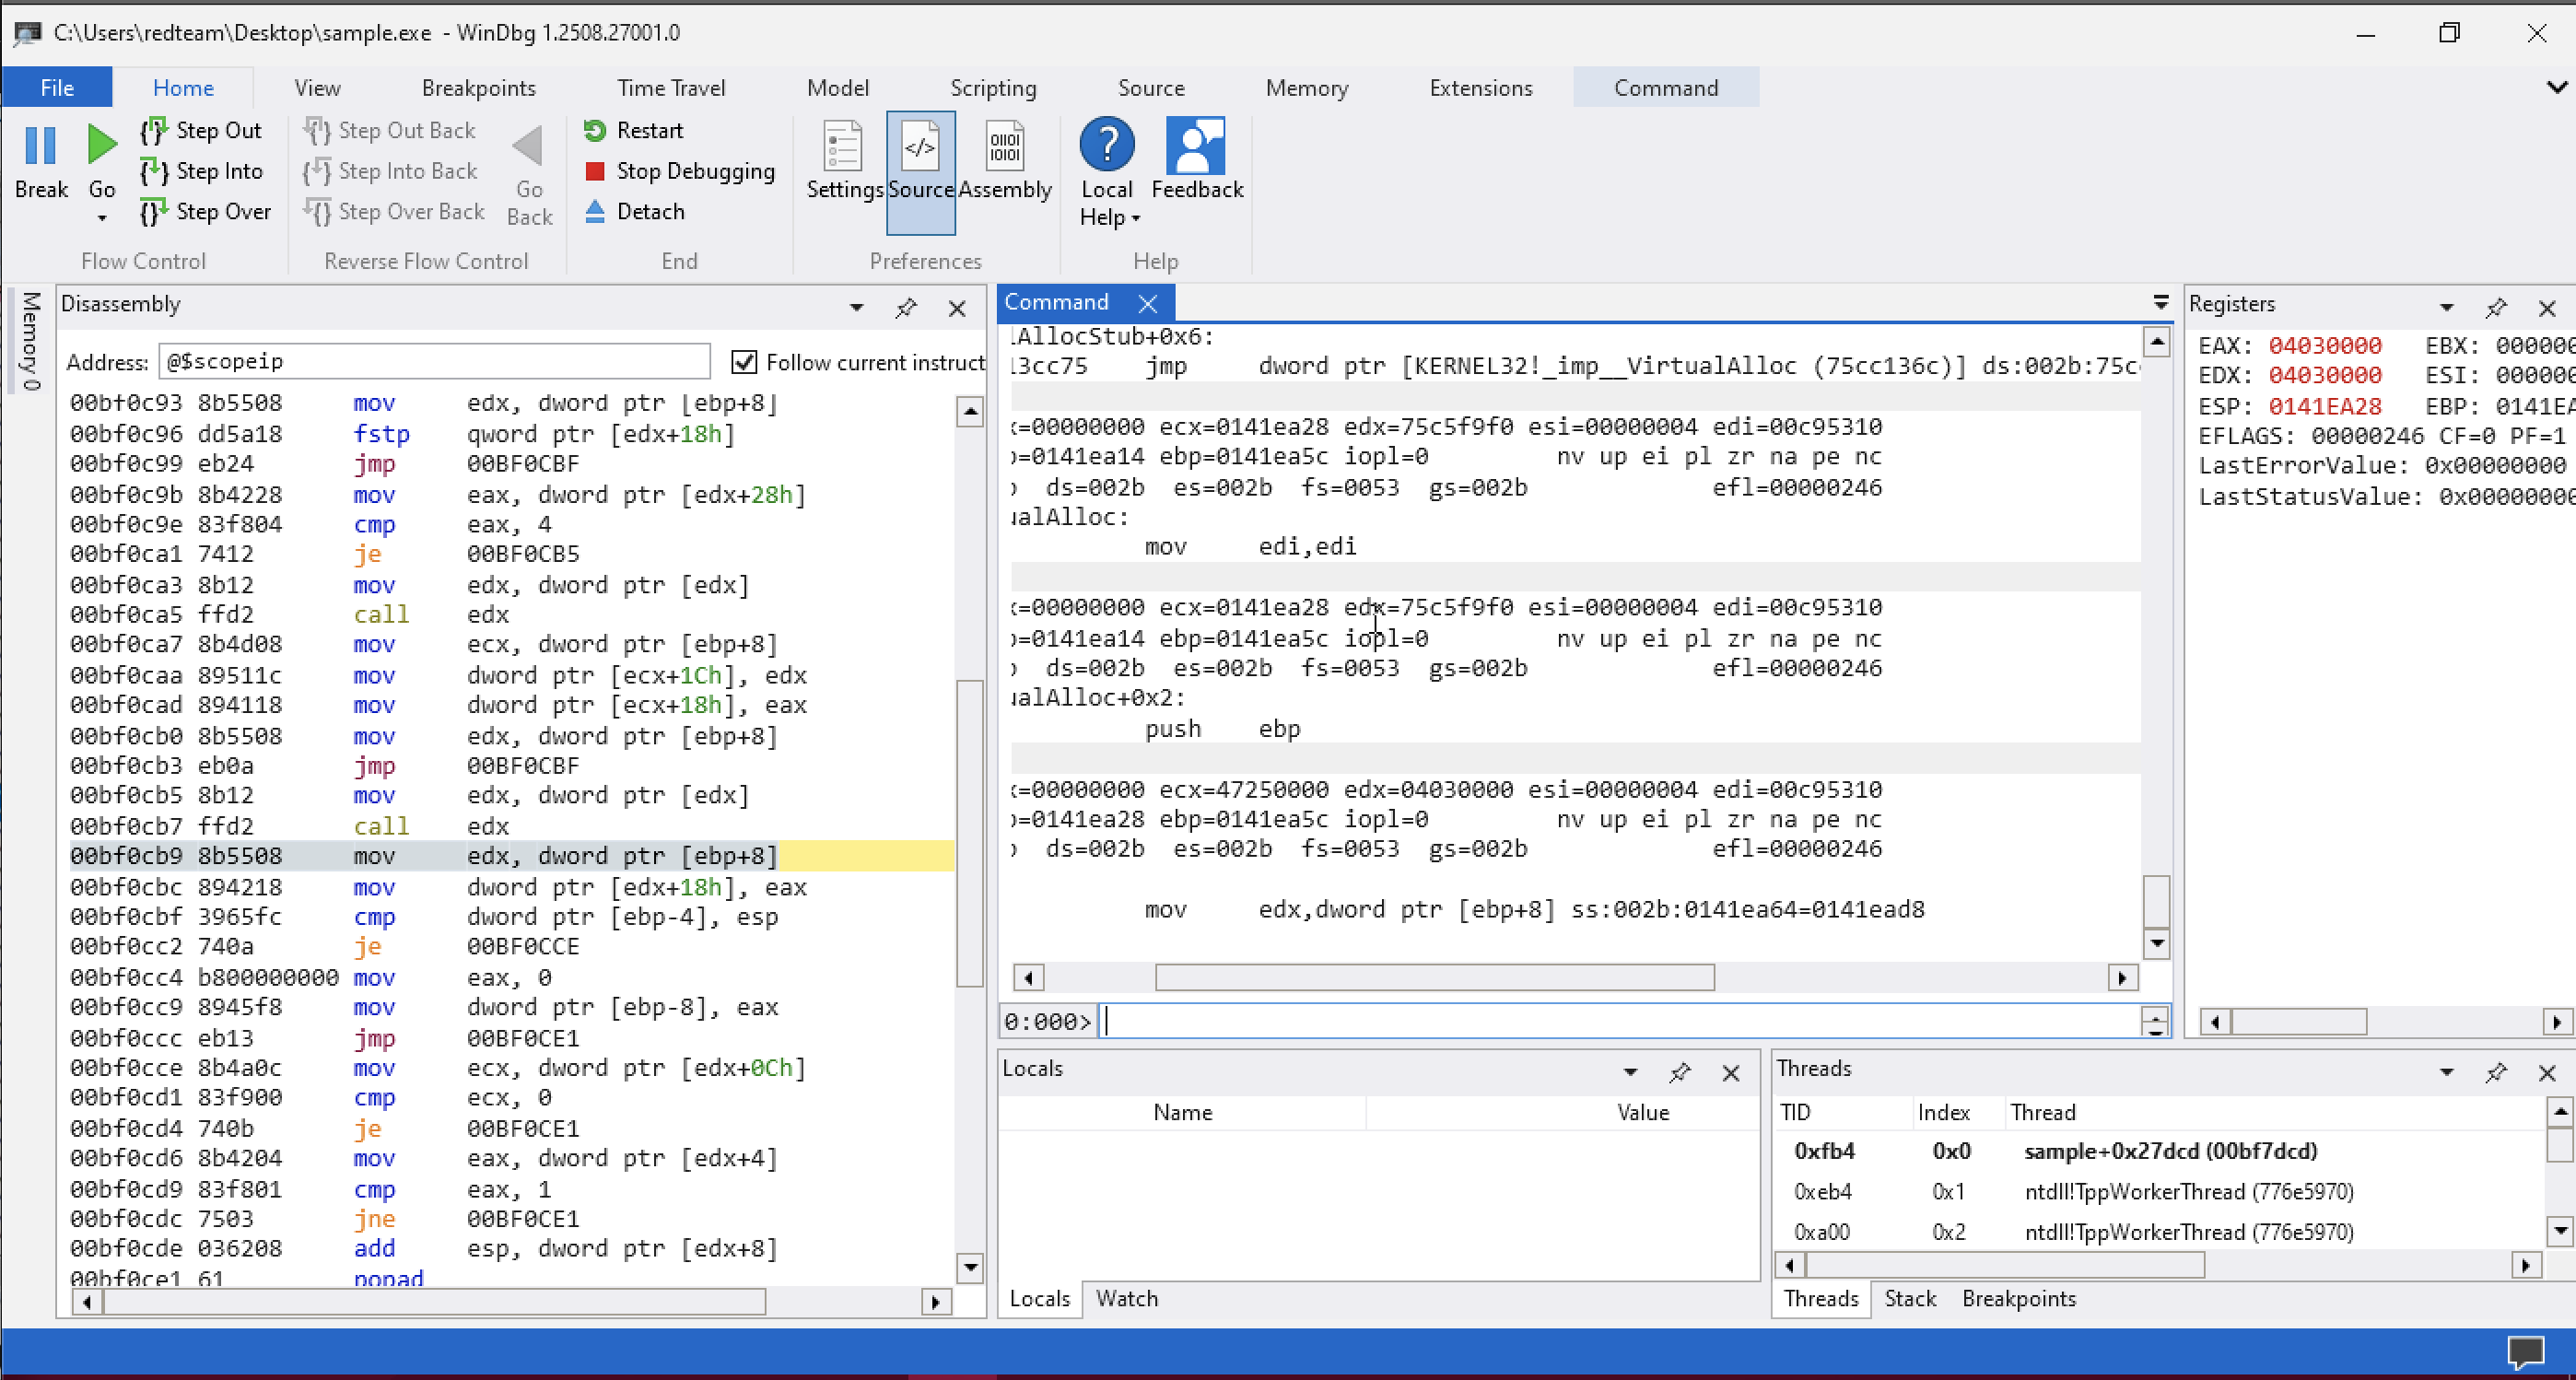
Detecting Another Executable Memory Region
After stepping out, the newly allocated memory address could again be observed in the EAX register, allowing further inspection of the memory region and the payload being written into it.
The malware later performed another VirtualAlloc() call, creating a second dynamically allocated executable memory region. After stepping out of the API call, I again inspected the returned address stored in the EAX register using:
0:000> !vprot eaxThe output showed:
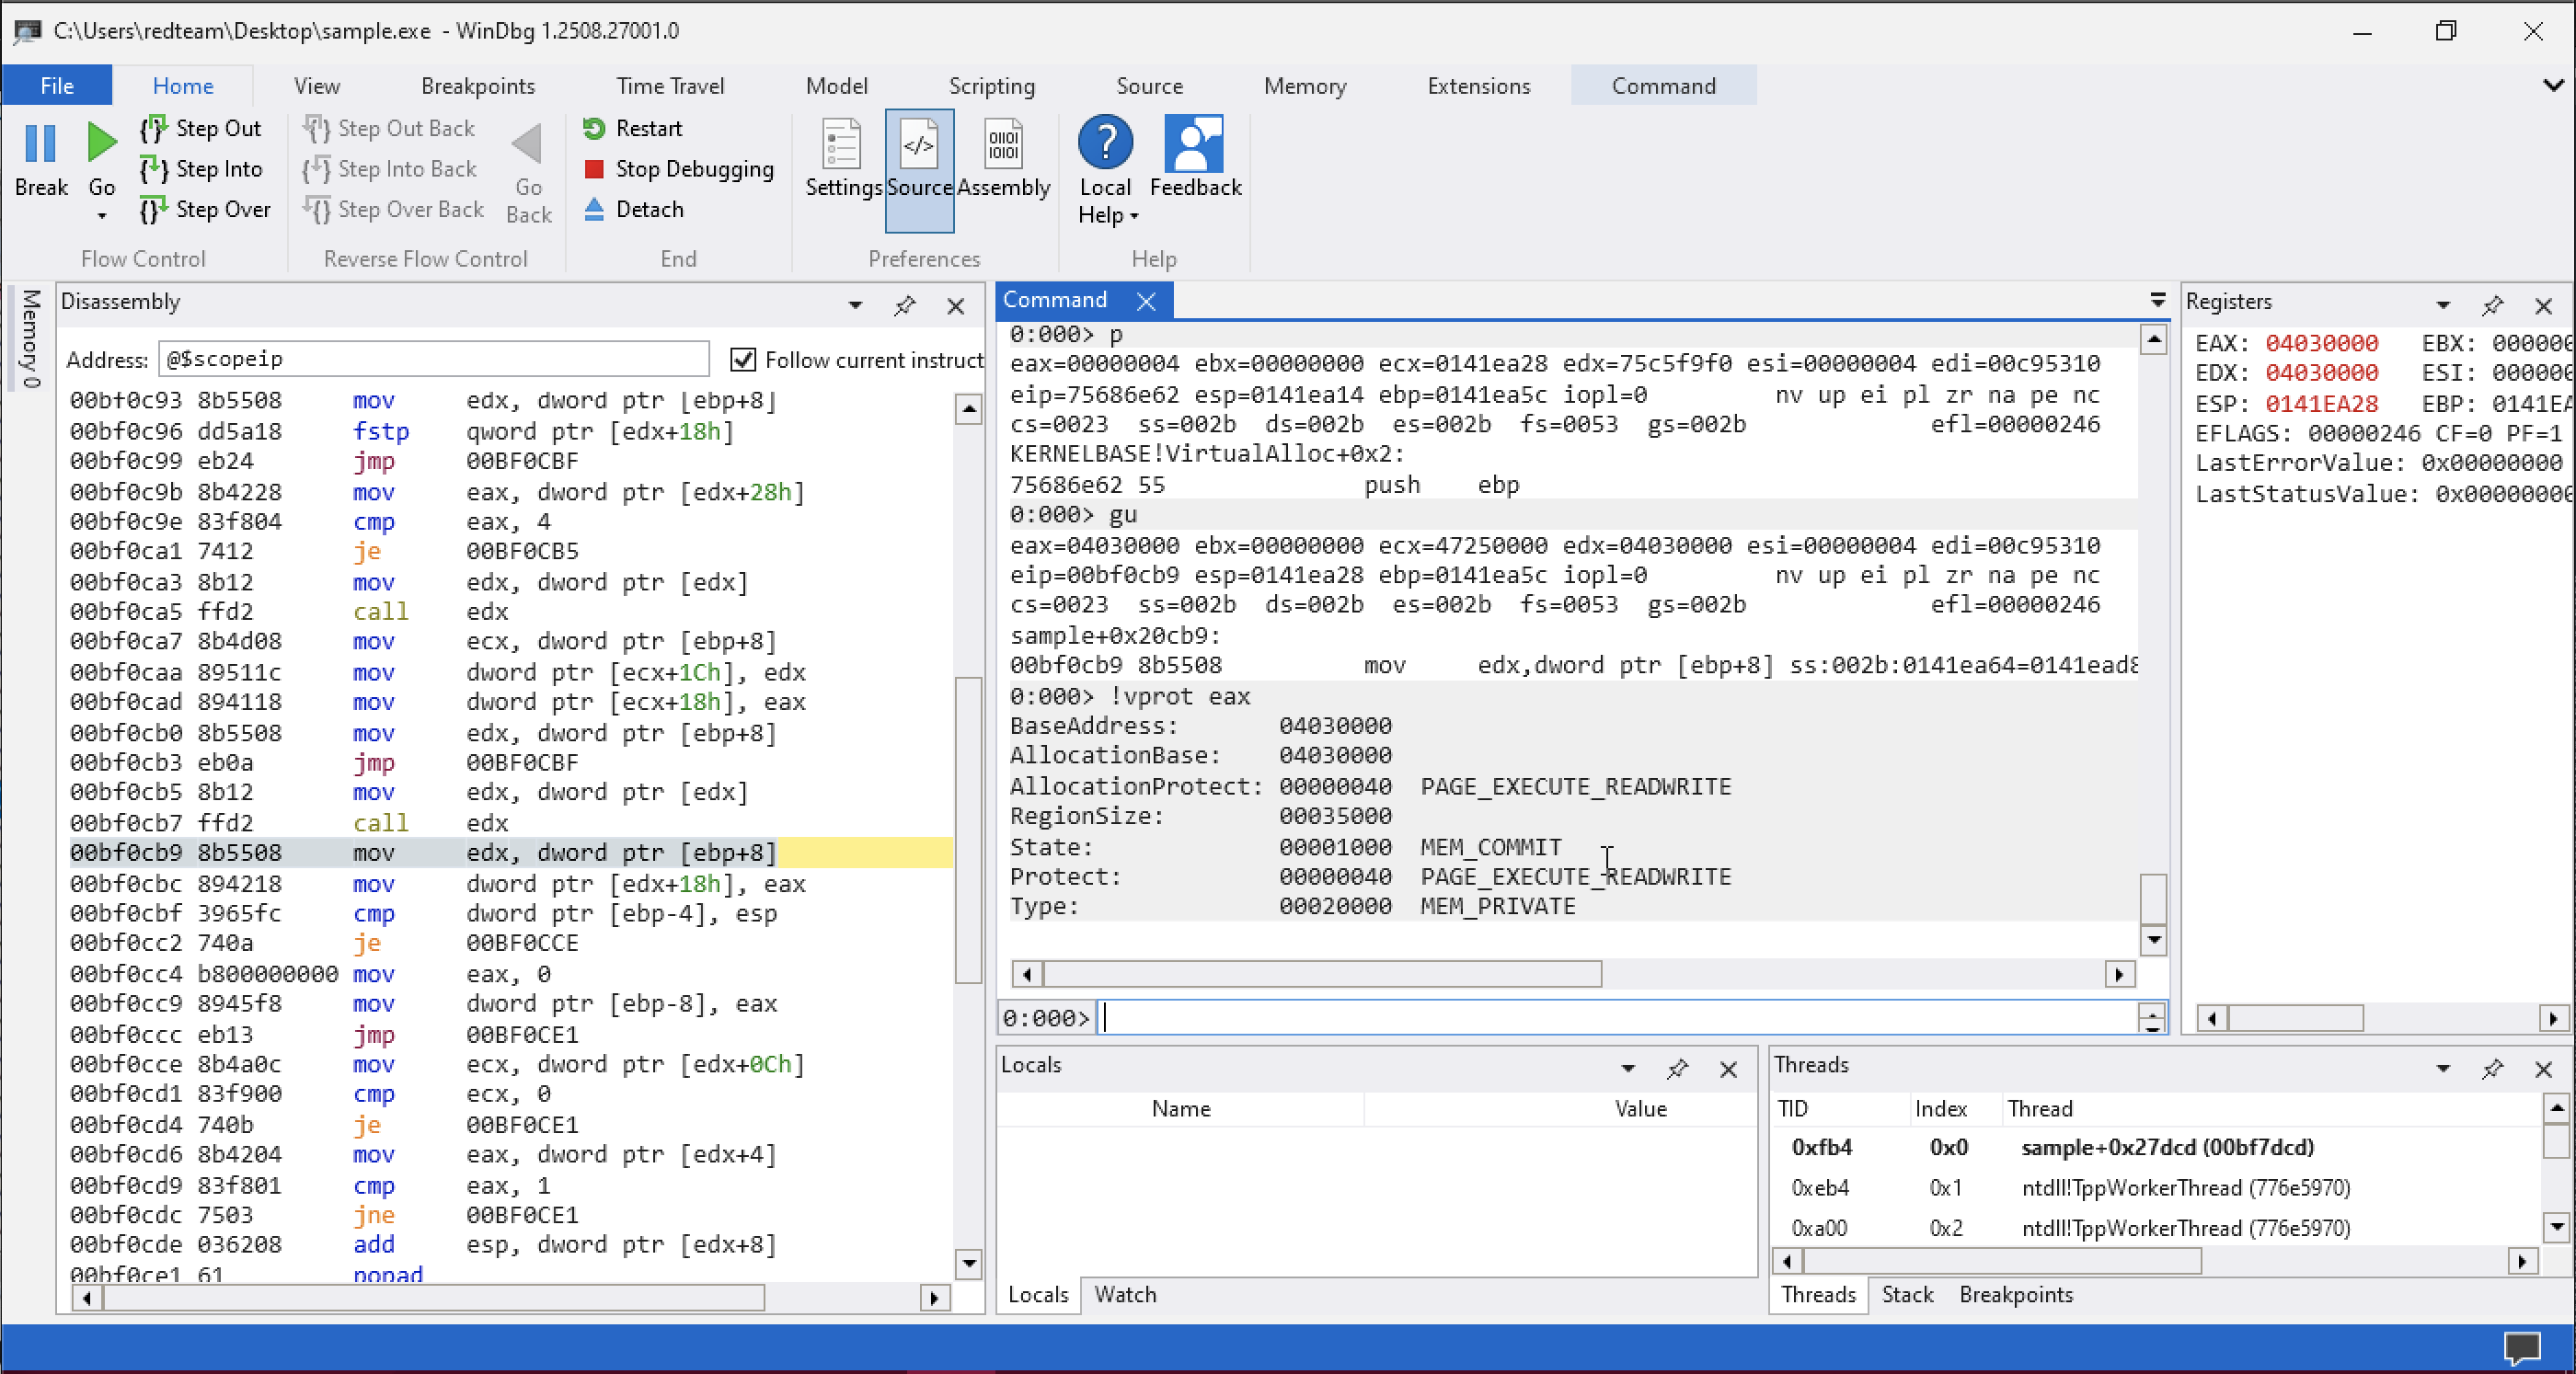
BaseAddress:       04030000
AllocationBase:    04030000
AllocationProtect: 00000040  PAGE_EXECUTE_READWRITE
RegionSize:        00035000
State:             00001000  MEM_COMMIT
Protect:           00000040  PAGE_EXECUTE_READWRITE
Type:              00020000  MEM_PRIVATE
Once again, the allocated memory region had PAGE_EXECUTE_READWRITE permissions, meaning the memory could be read from, written to, and executed. Malware commonly uses this type of memory allocation for unpacking payloads, storing shellcode, or executing dynamically generated code.
Since the extracted AutoIt script contained two suspicious arrays that appeared to store shellcode data, this second executable memory region likely corresponds to another stage of payload loading or shellcode execution performed at runtime.
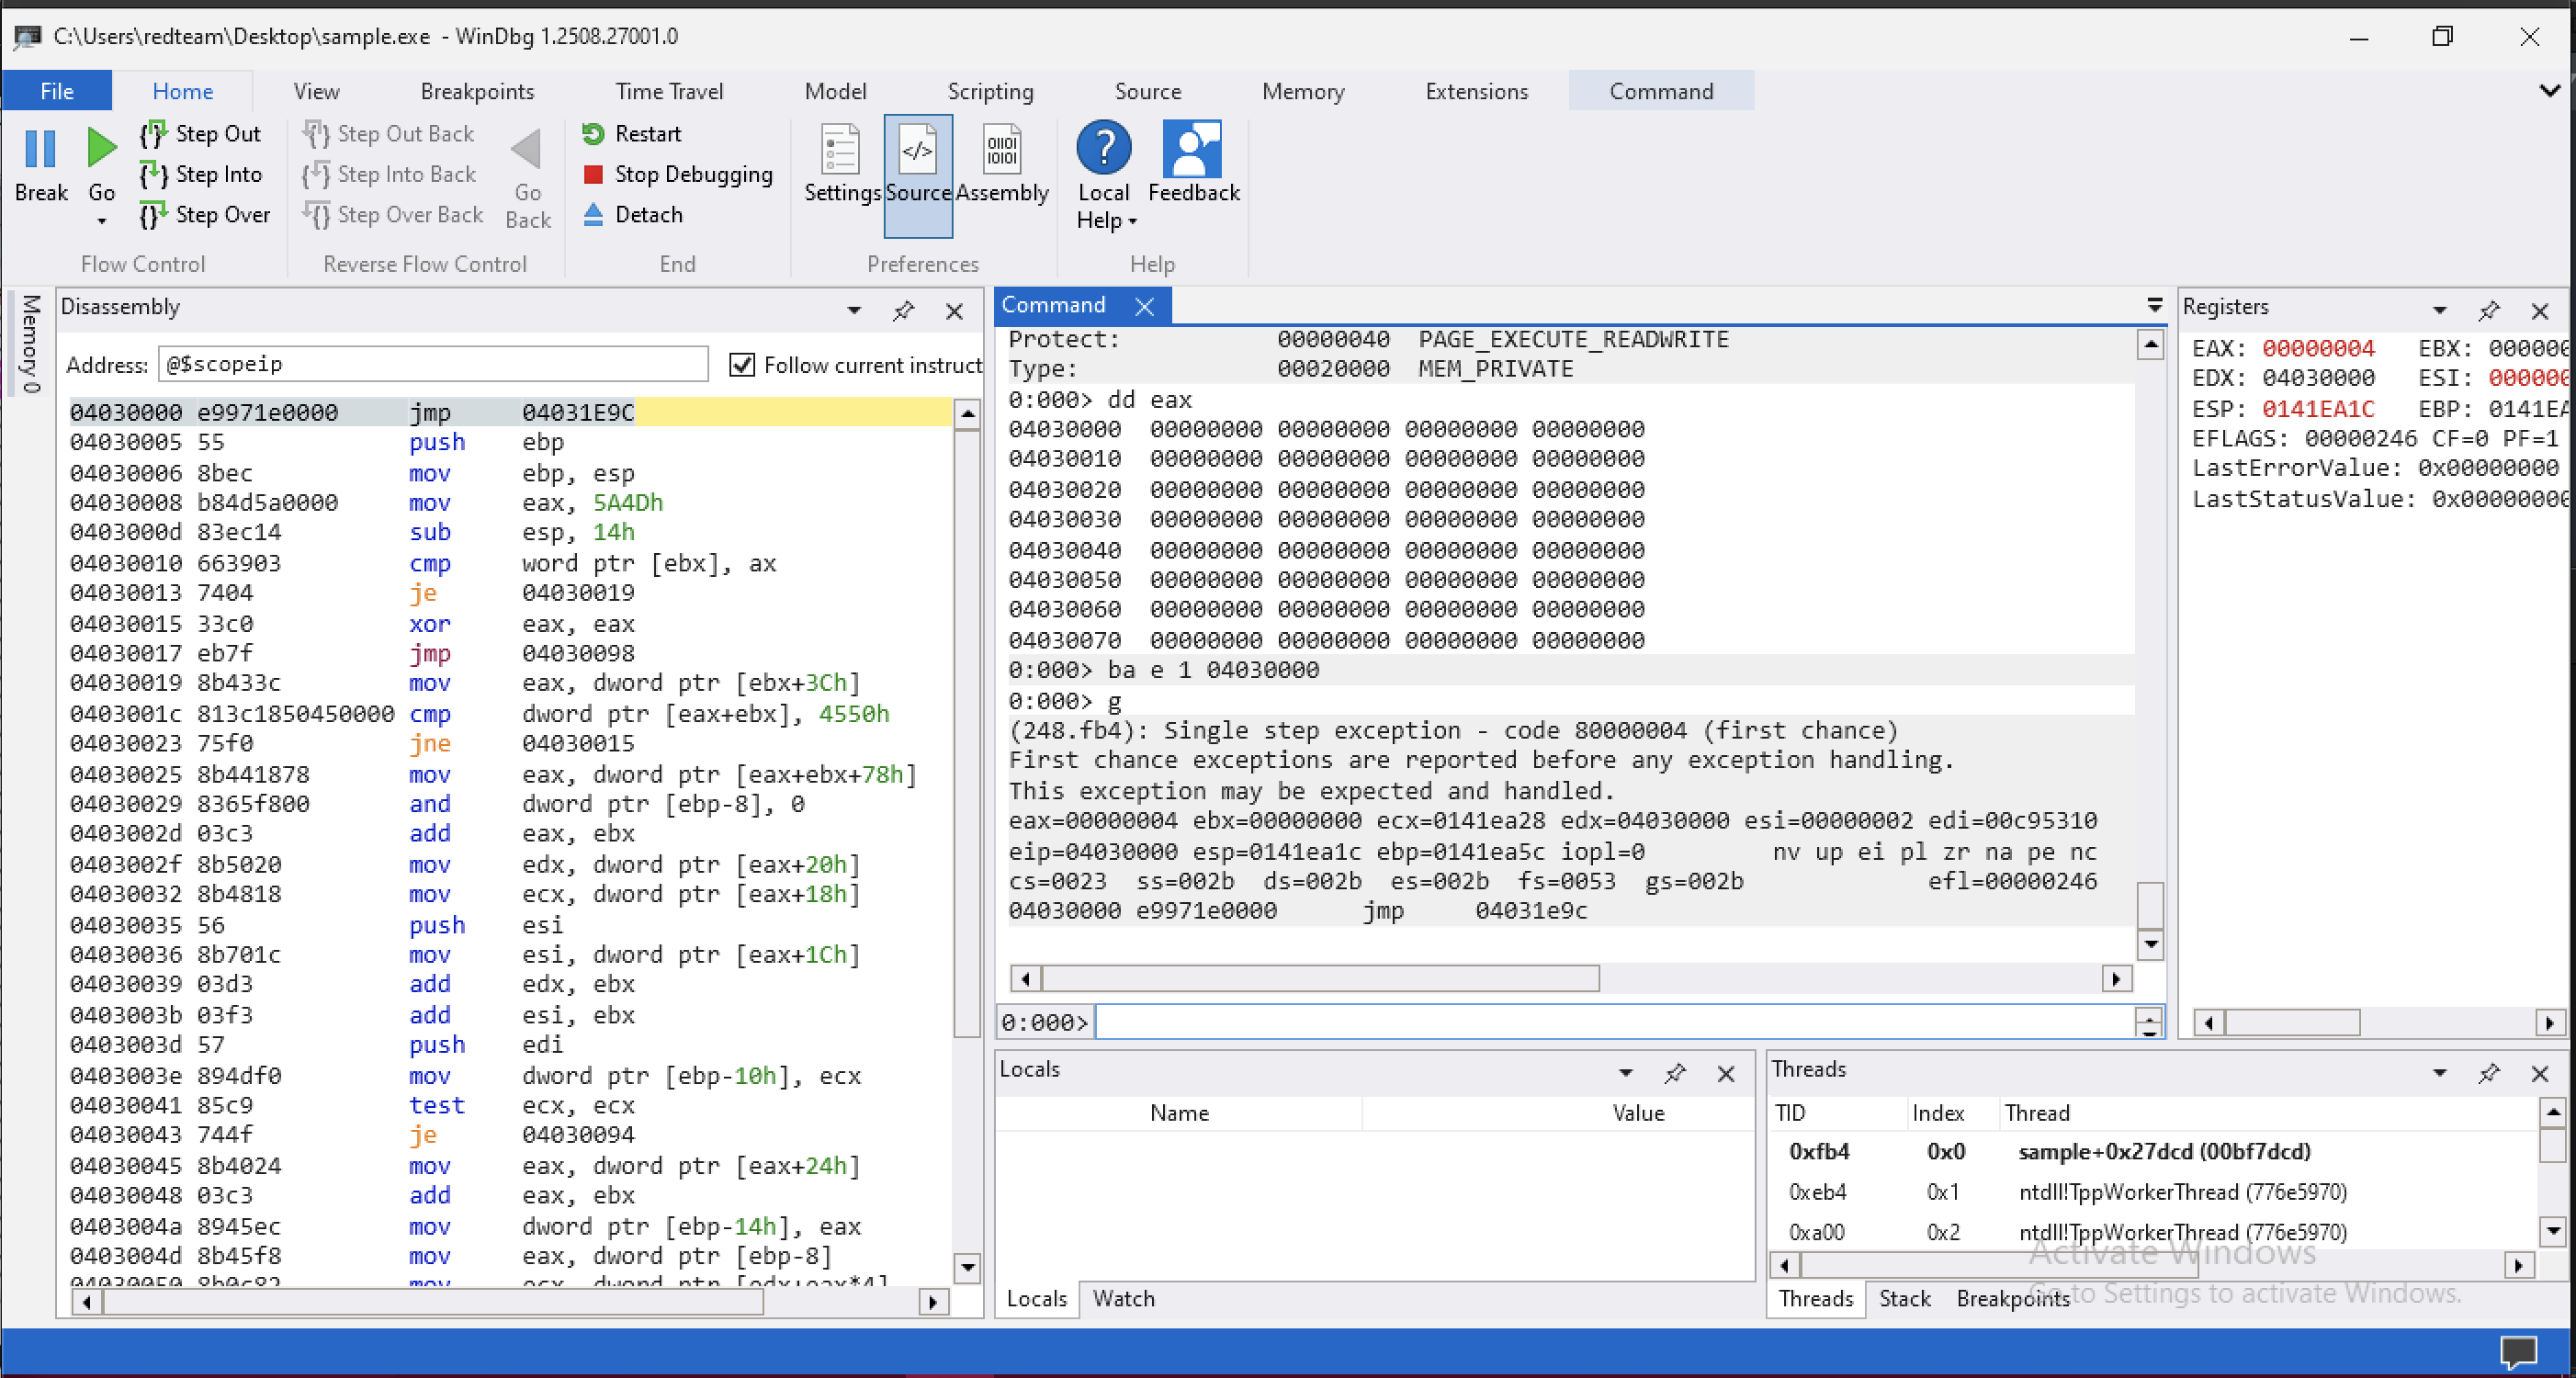
Setting an Execution Breakpoint on the Shellcode
After inspecting the allocated memory region using:
0:000> dd eaxthe memory contents were completely empty:
04030000  00000000 00000000 00000000 00000000
04030010  00000000 00000000 00000000 00000000
04030020  00000000 00000000 00000000 00000000
...
At this point, the malware had only reserved executable memory, but the shellcode had not yet been written into it. What we are really interested in is the moment when the shellcode is copied into memory and execution begins.
By analyzing the extracted AutoIt script, it became clear that execution would begin at the start of the allocated memory region:
04030000To catch the exact moment when the CPU starts executing code from this memory region, I set a hardware execution breakpoint on the first byte of the allocation using WinDbg:
0:000> ba e 1 04030000Where:
ba → sets a hardware breakpoint,e → triggers on execution,1 → monitors 1 byte,04030000 → start address of the allocated memory region.Then resume execution.
Inspecting the Allocated Memory with Process Hacker
Now we can use a tool like process hacker to explore the content of memory and extract that.
Here are the two allocations.
0x3ff0000  Private  212 kB  RWX
0x4030000  Private  212 kB  RWX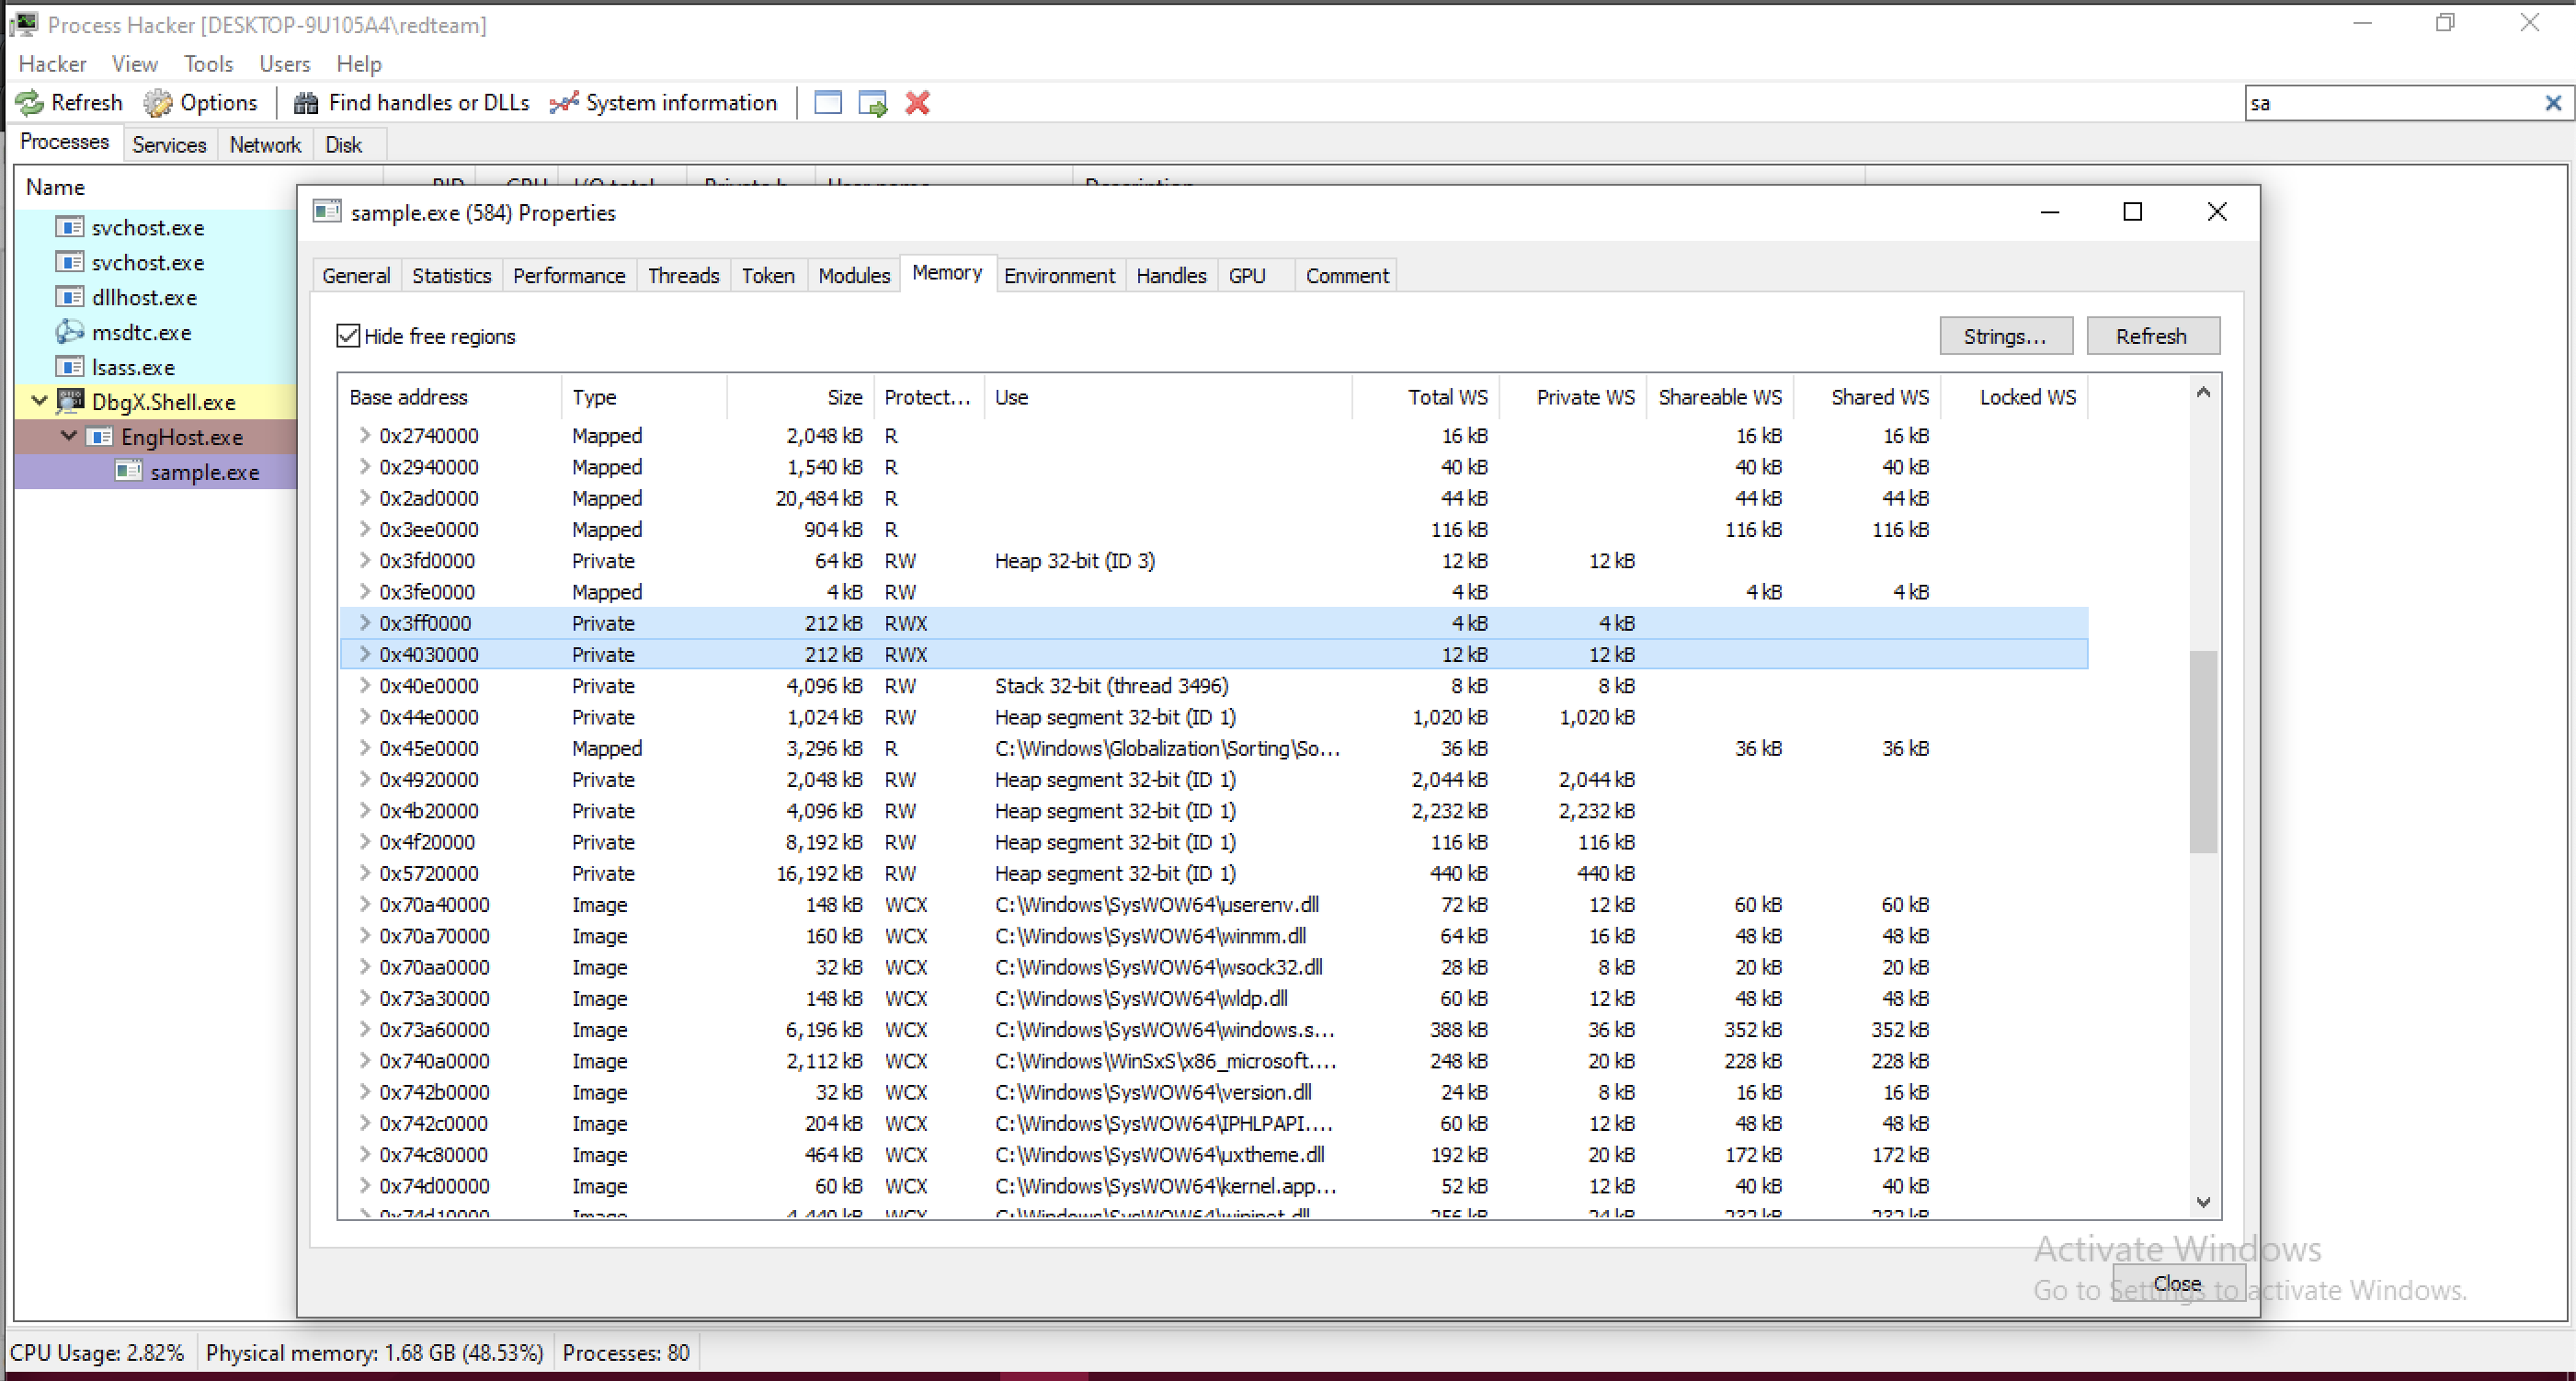
These regions are important because:
Private memory means the regions were dynamically allocated during runtime,RWX stands for:Memory regions with RWX permissions are highly suspicious and are commonly used by malware for:
These two allocations also match the memory regions previously observed through VirtualAlloc() in WinDbg, confirming that the malware is dynamically preparing executable memory for shellcode execution.
Dumping the Shellcode Memory Region
Actual content of the memory. Go on and save this.
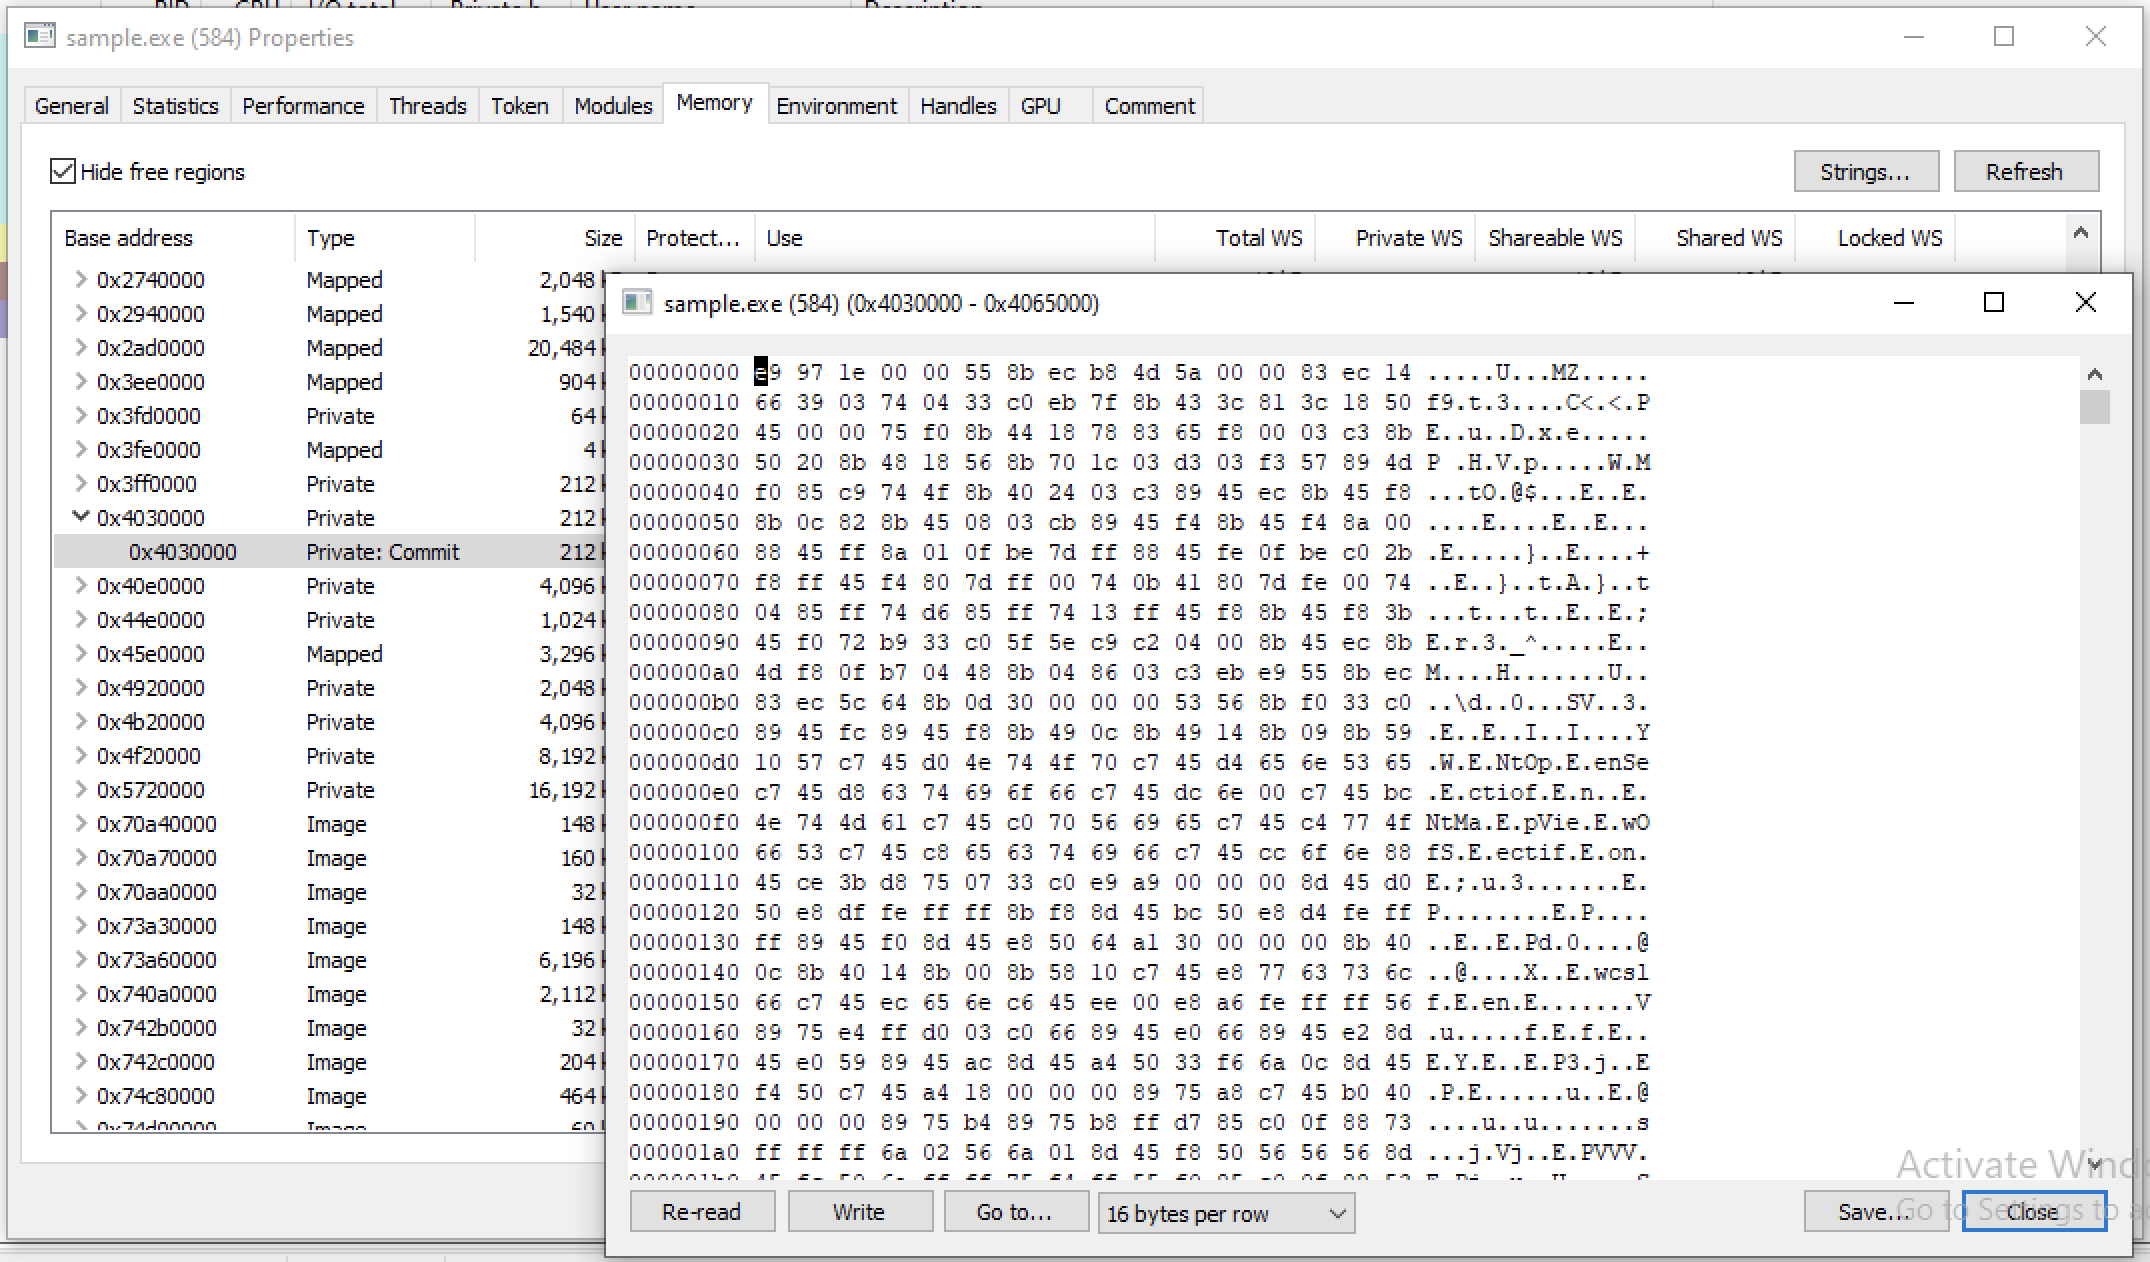
Once the dump was saved, it could be imported directly into Ghidra for deeper static analysis. Analyzing the dumped payload in Ghidra is much easier than reversing the original packed AutoIt executable because the shellcode is now already unpacked and present in executable memory.
Reversing the Unpacked Payload
Ghidra
Importing the dumped payload in ghidra.
Choose language: x86:LE:32:default:windows
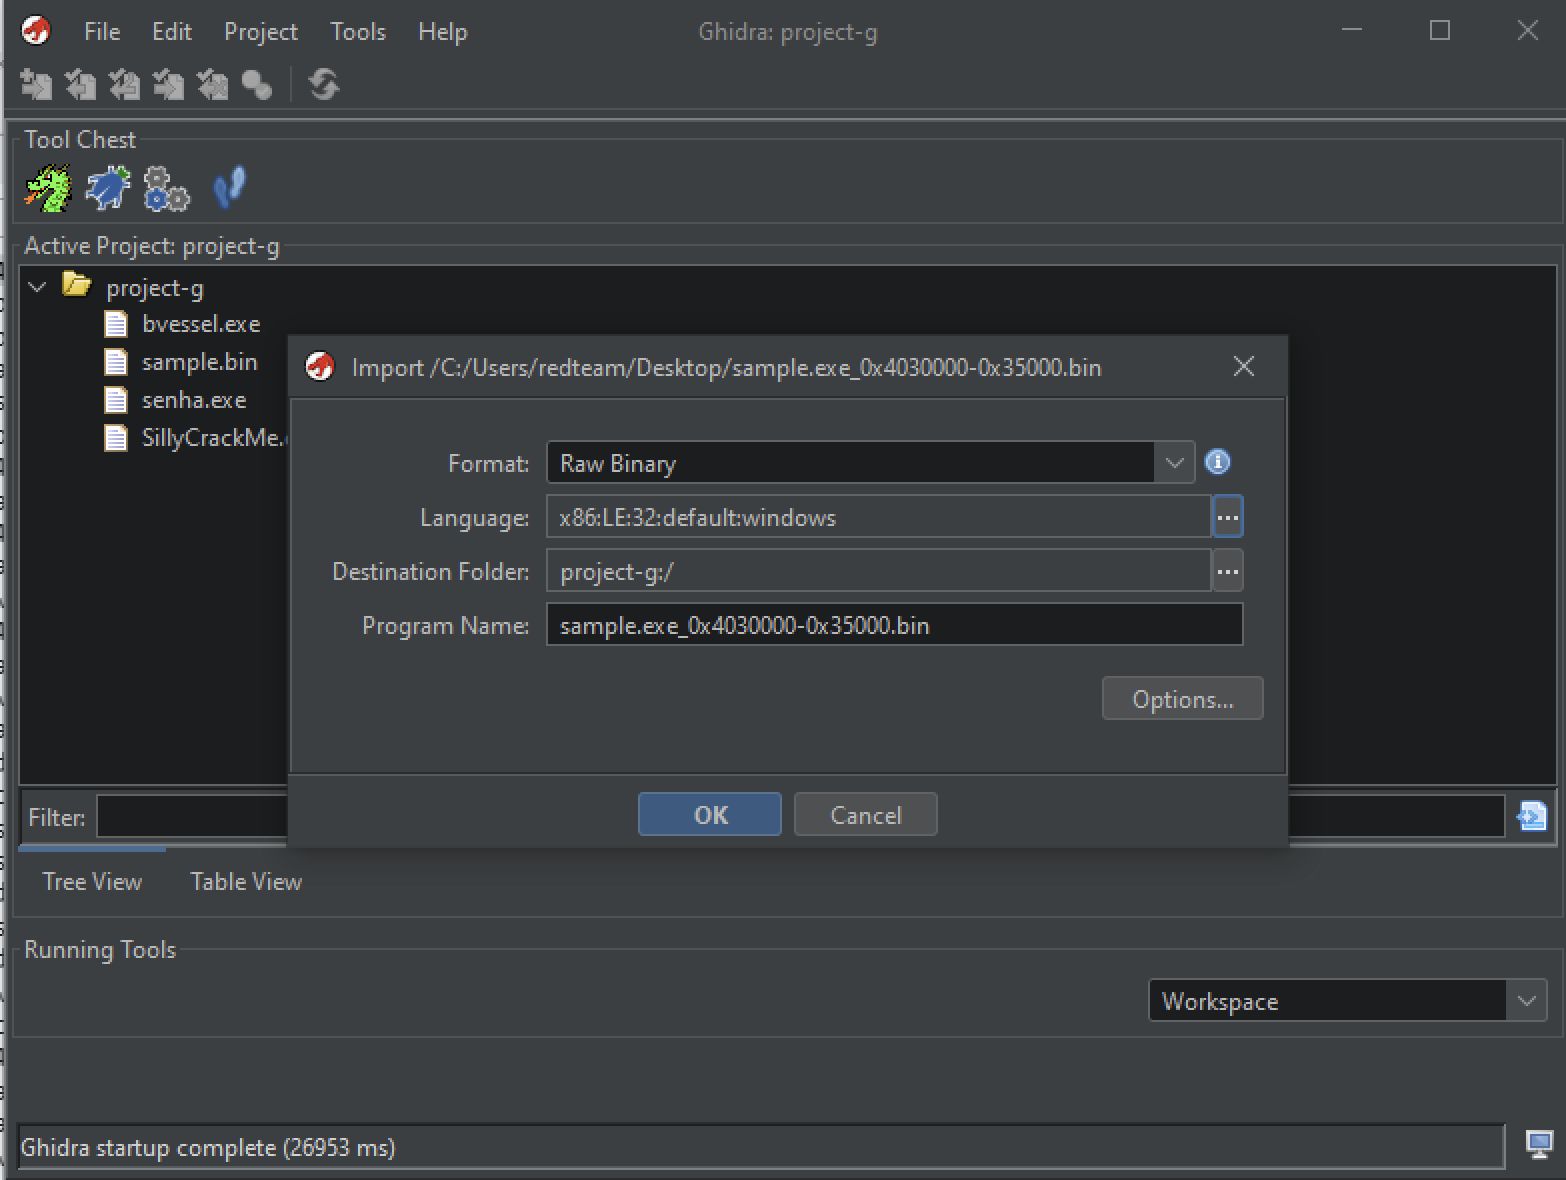
Auto analysis in ghidra is challenging since there’s no entry point to define.
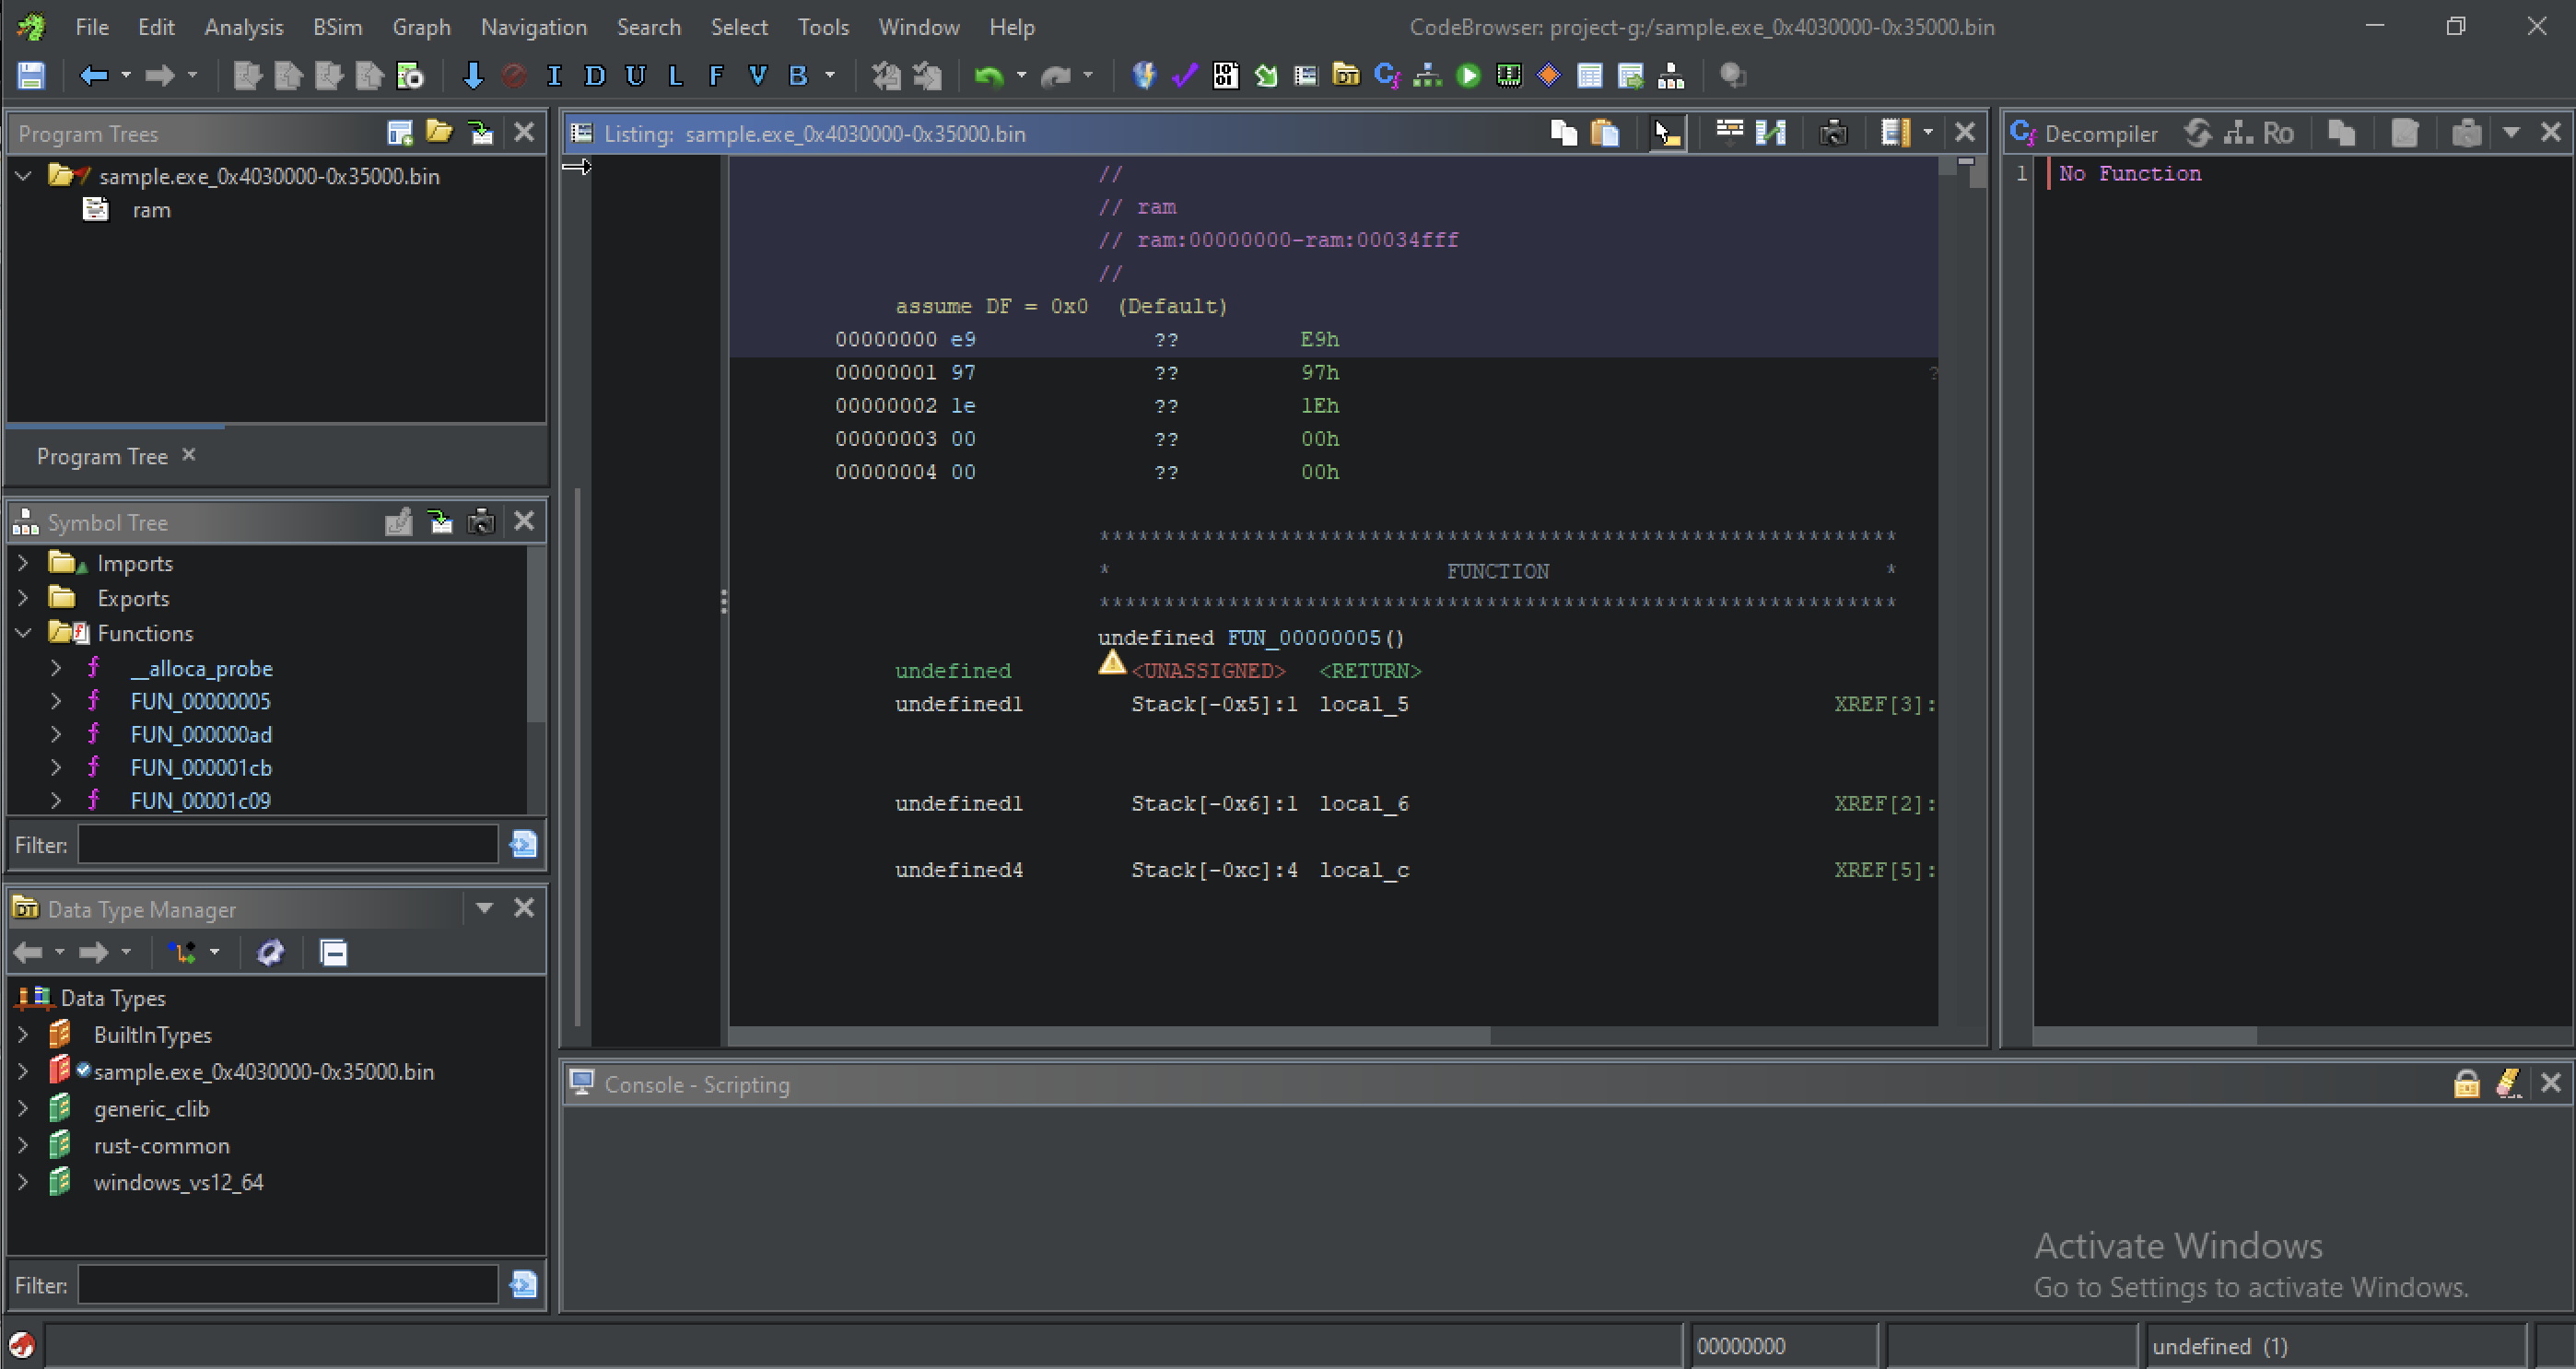
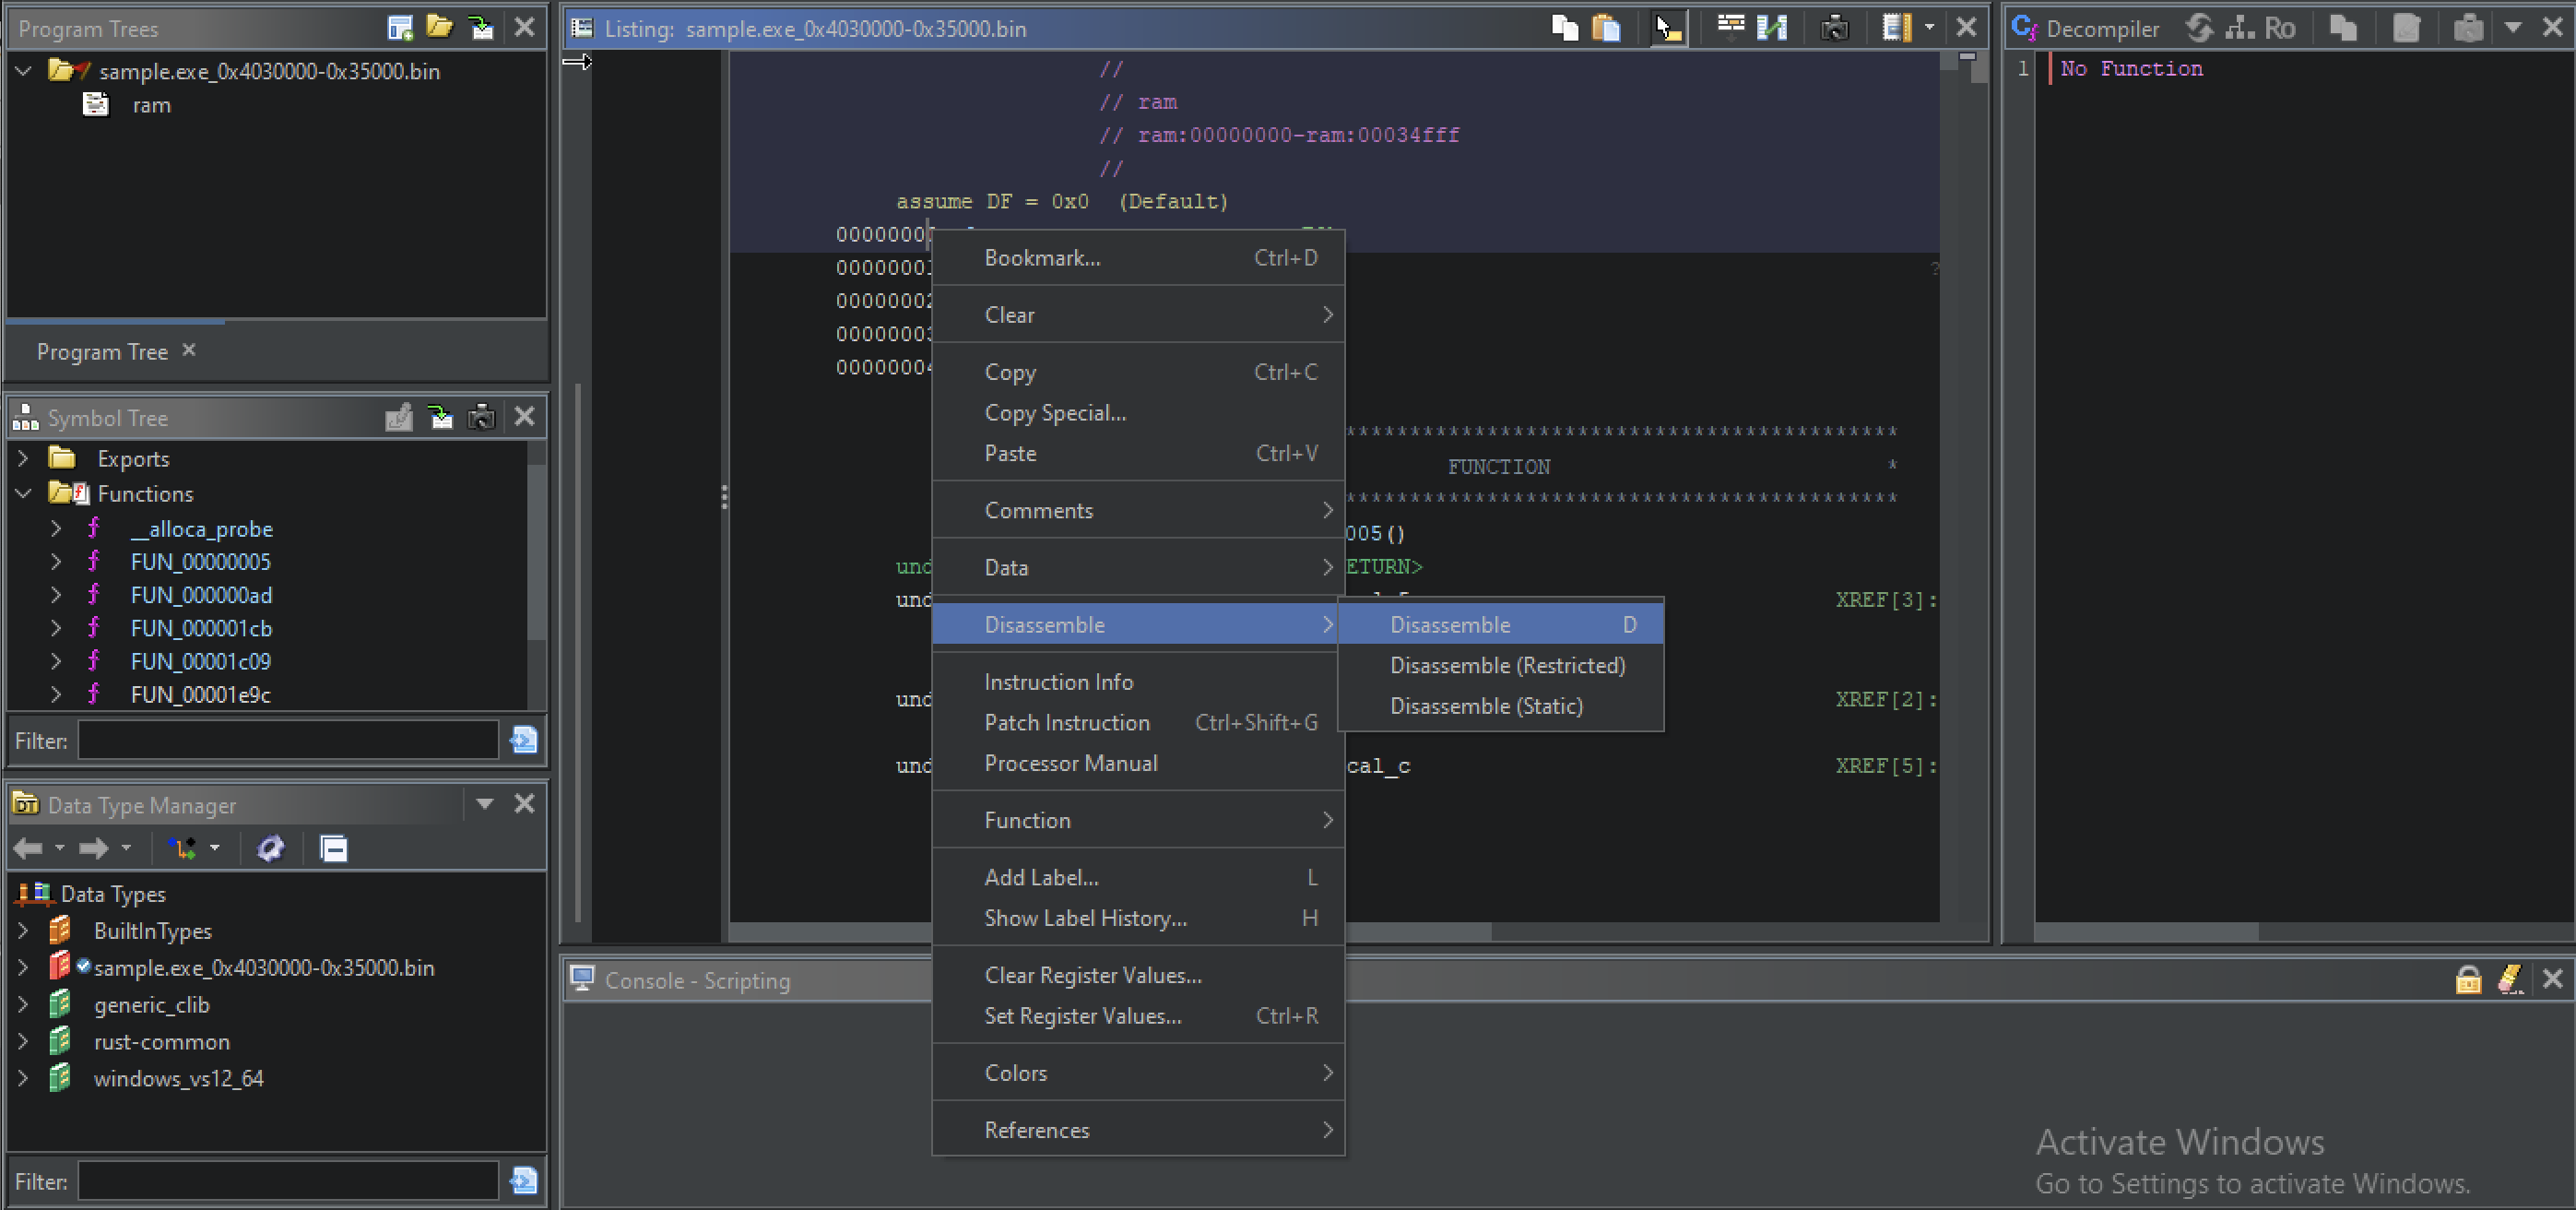
So just right click at offset 0 and disassemble.
Now it’s disassembled.
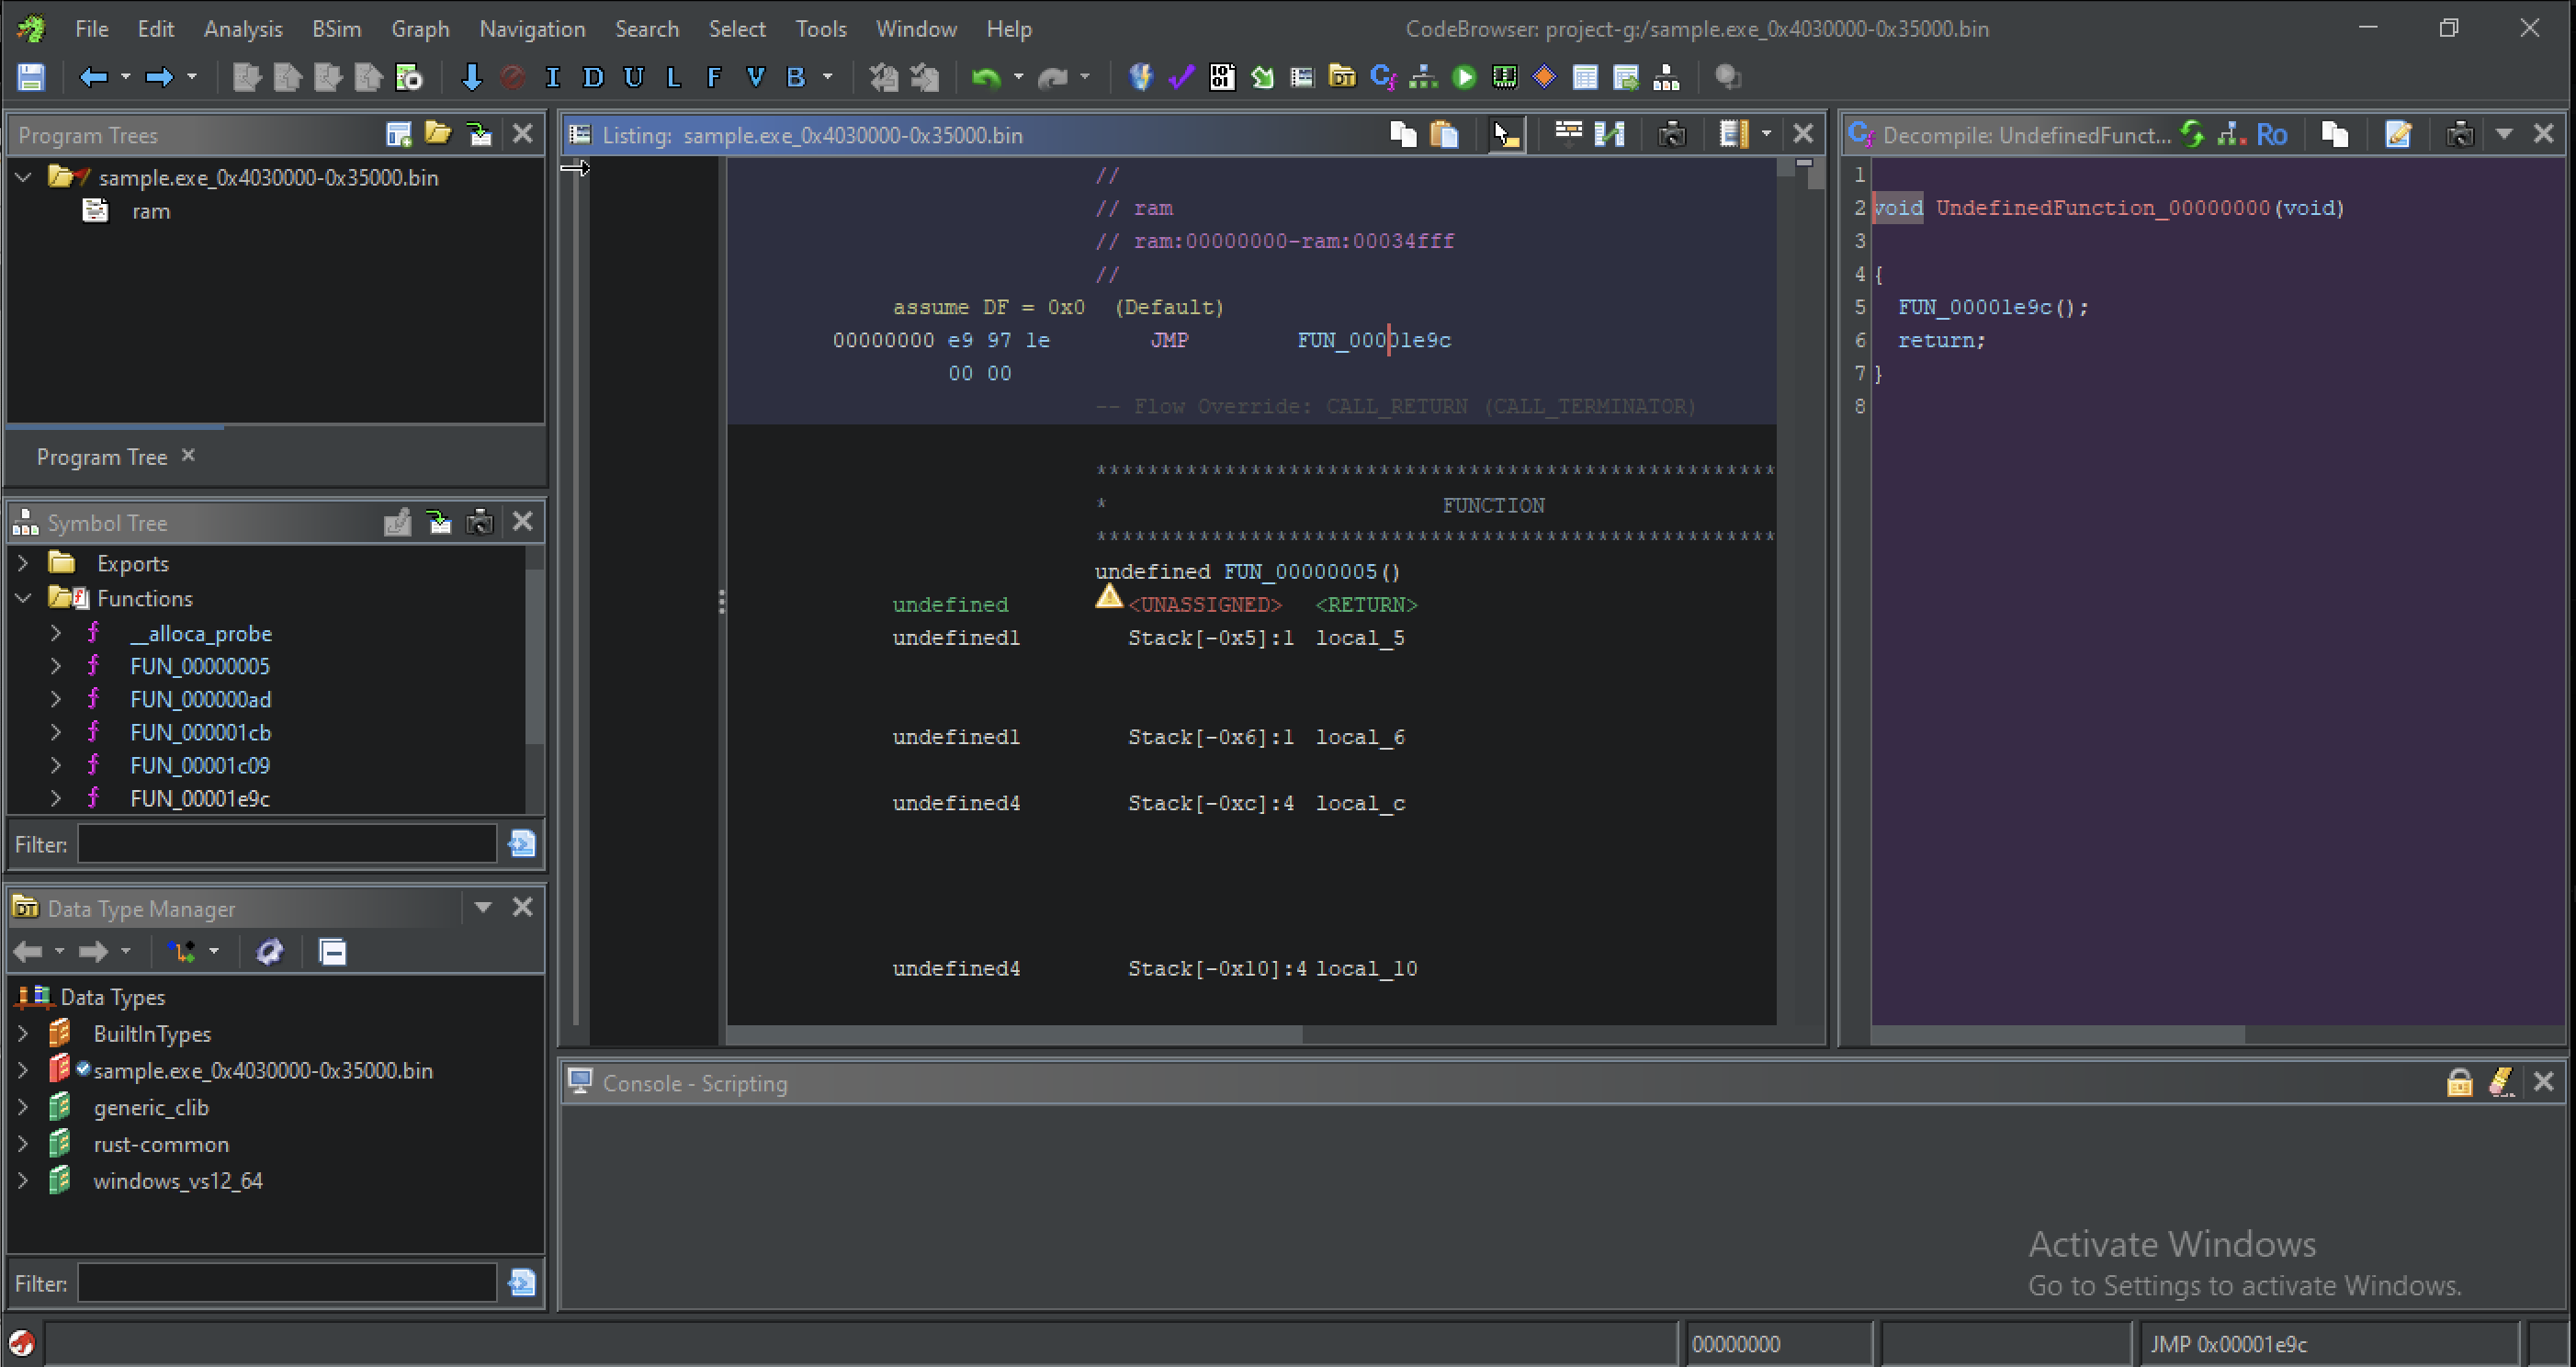
This is a shellcode, one of the first thing we want identify is how it’s resolving function pointer, once we get that, we have the ability to trace functionality and understand what the shellcode is doing.
let’s look for a function that is resolving function pointer.
There’s two function in: FUN_00001E9C()
1. FUN_000001cb(local_180);
2. iVar2 = FUN_00001c09(auStack_288,param_2);
let’s look the first one.
FUN000001cb(local180);
This function is too long, which is actually a good thing when it’s comes to shellcode. This could means that this is a primary function responsible for resolving API’s, and possibly the program is using stack strings and that’s account for some of the length in the function because the data of all of the strings that is using has to be defined here as well as move to the stack. in order create the pointer to the strings.
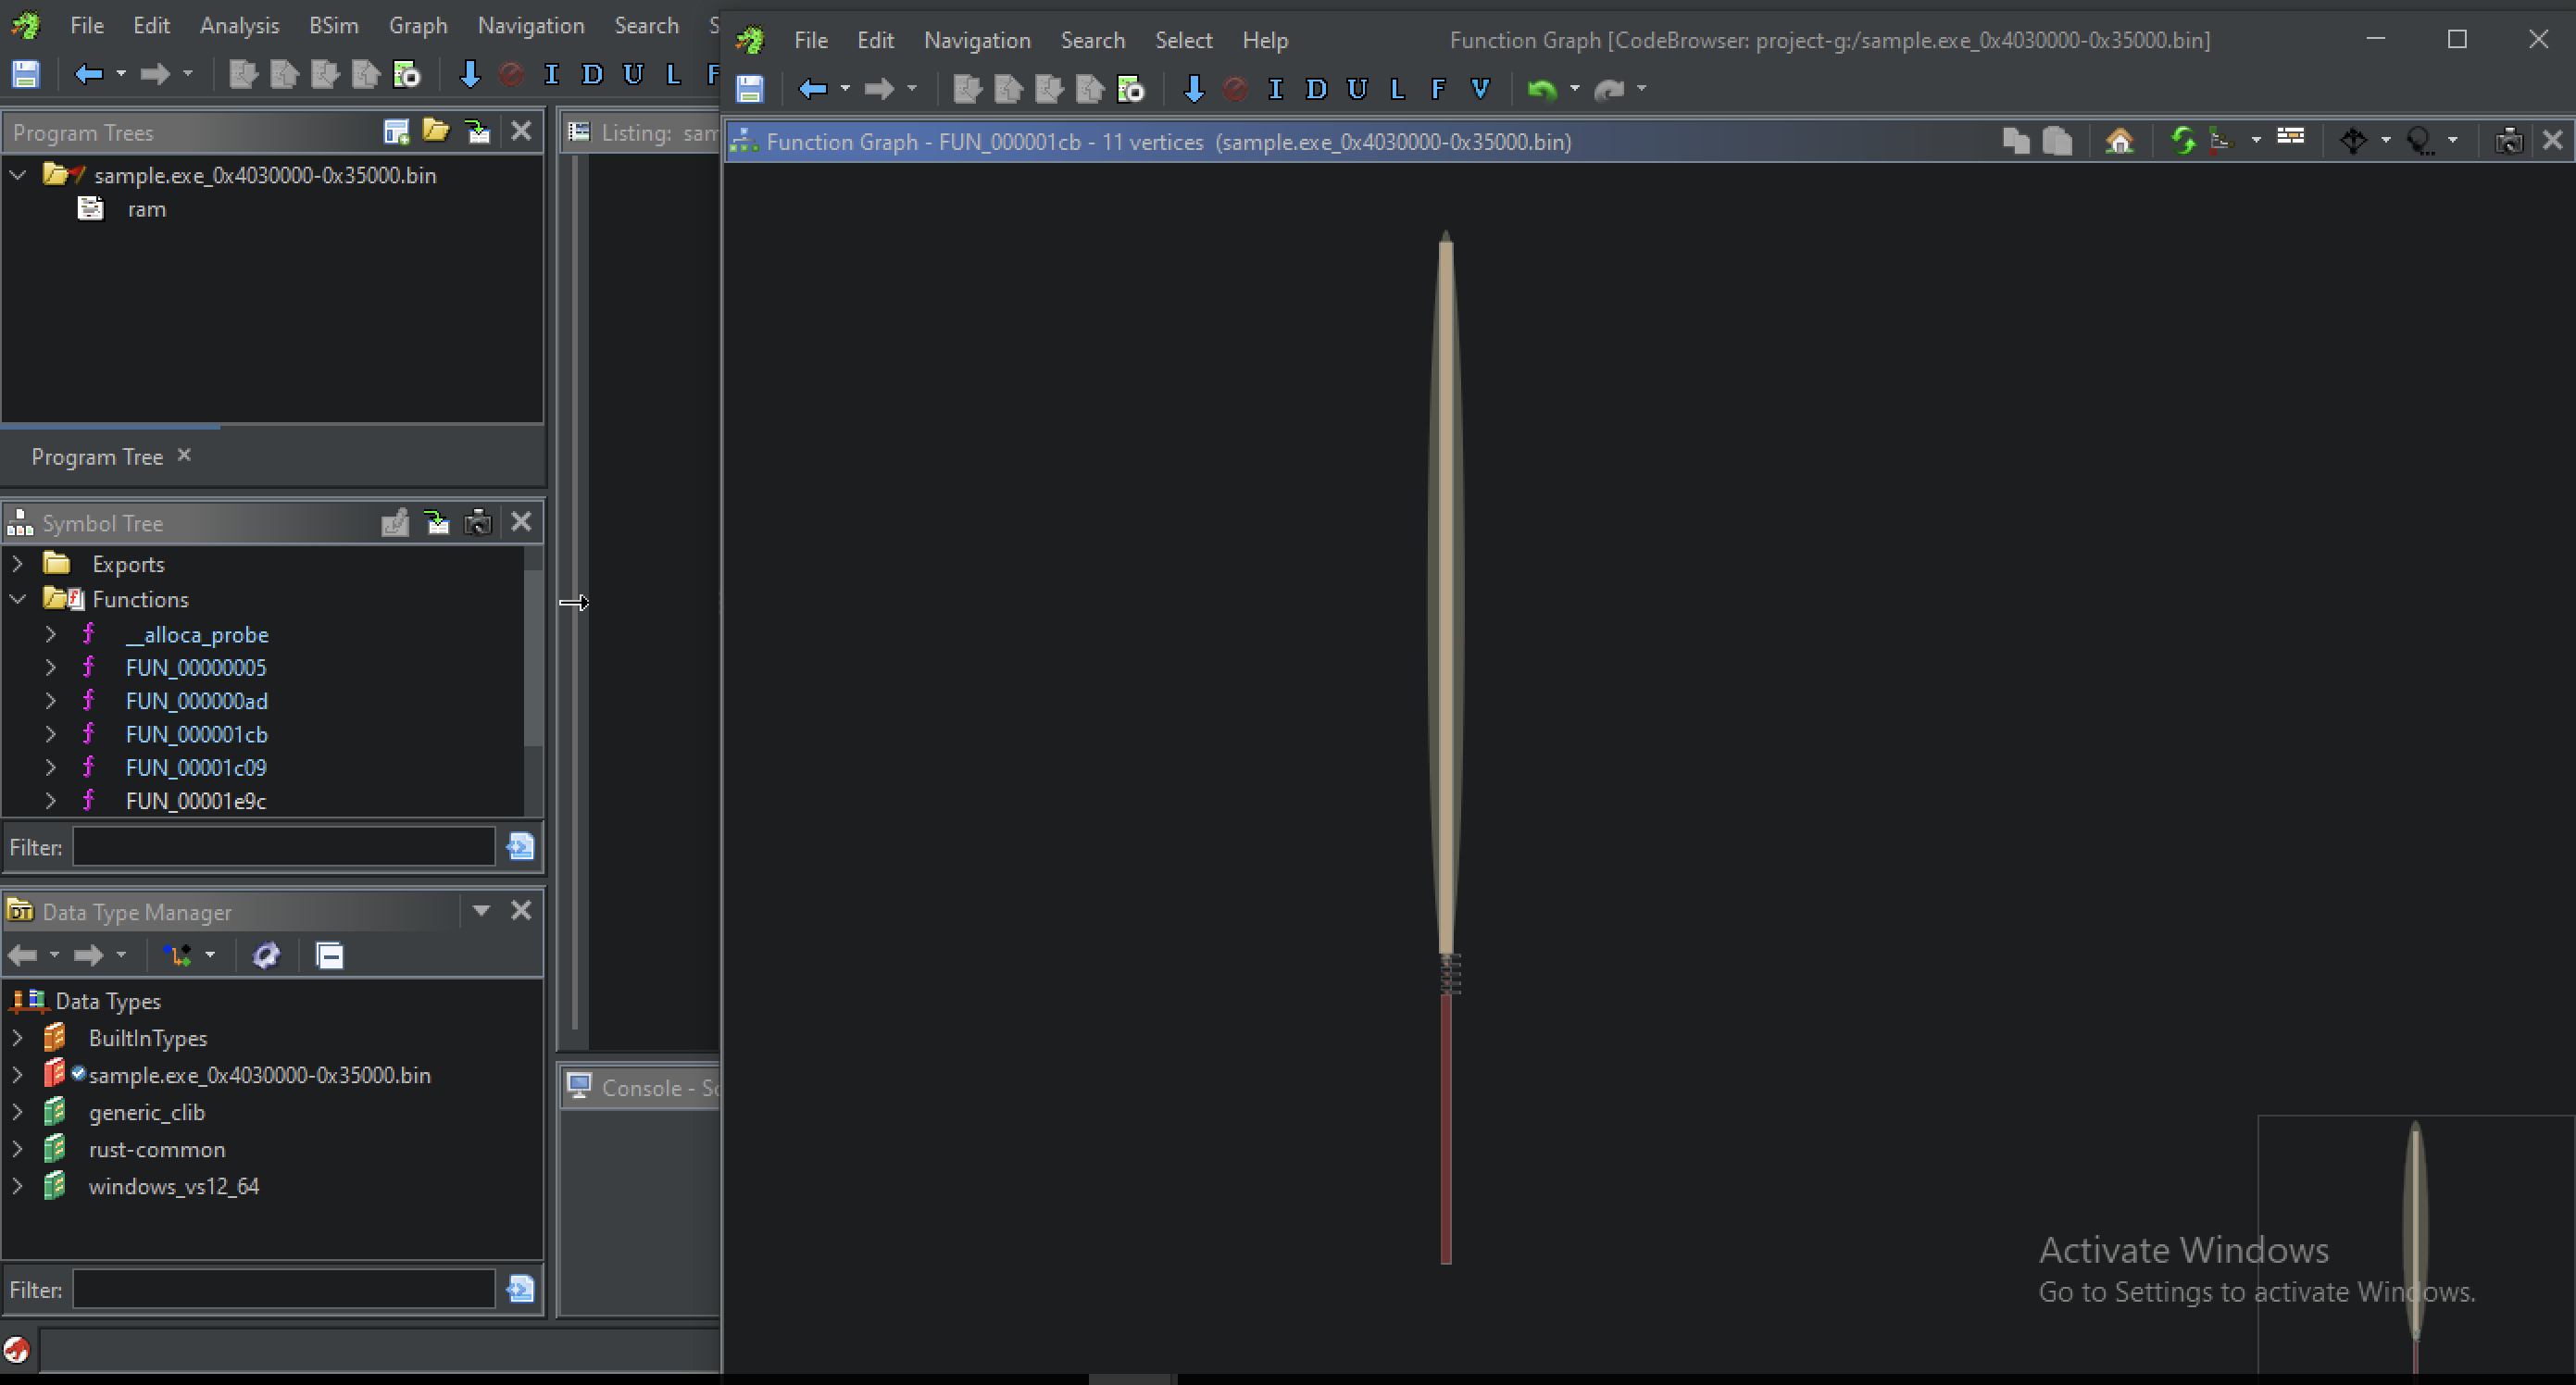
FUN_000001CB() appears to be a large API resolution and initialization function used by the unpacked payload. Instead of importing Windows APIs normally through the Import Address Table (IAT), the shellcode dynamically constructs API and DLL names in memory and resolves them at runtime. This is a very common malware technique used to evade static analysis and detection.
PEB
This instruction is important because it accesses the Windows Process Environment Block (PEB), which is a very common technique used by shellcode and malware.
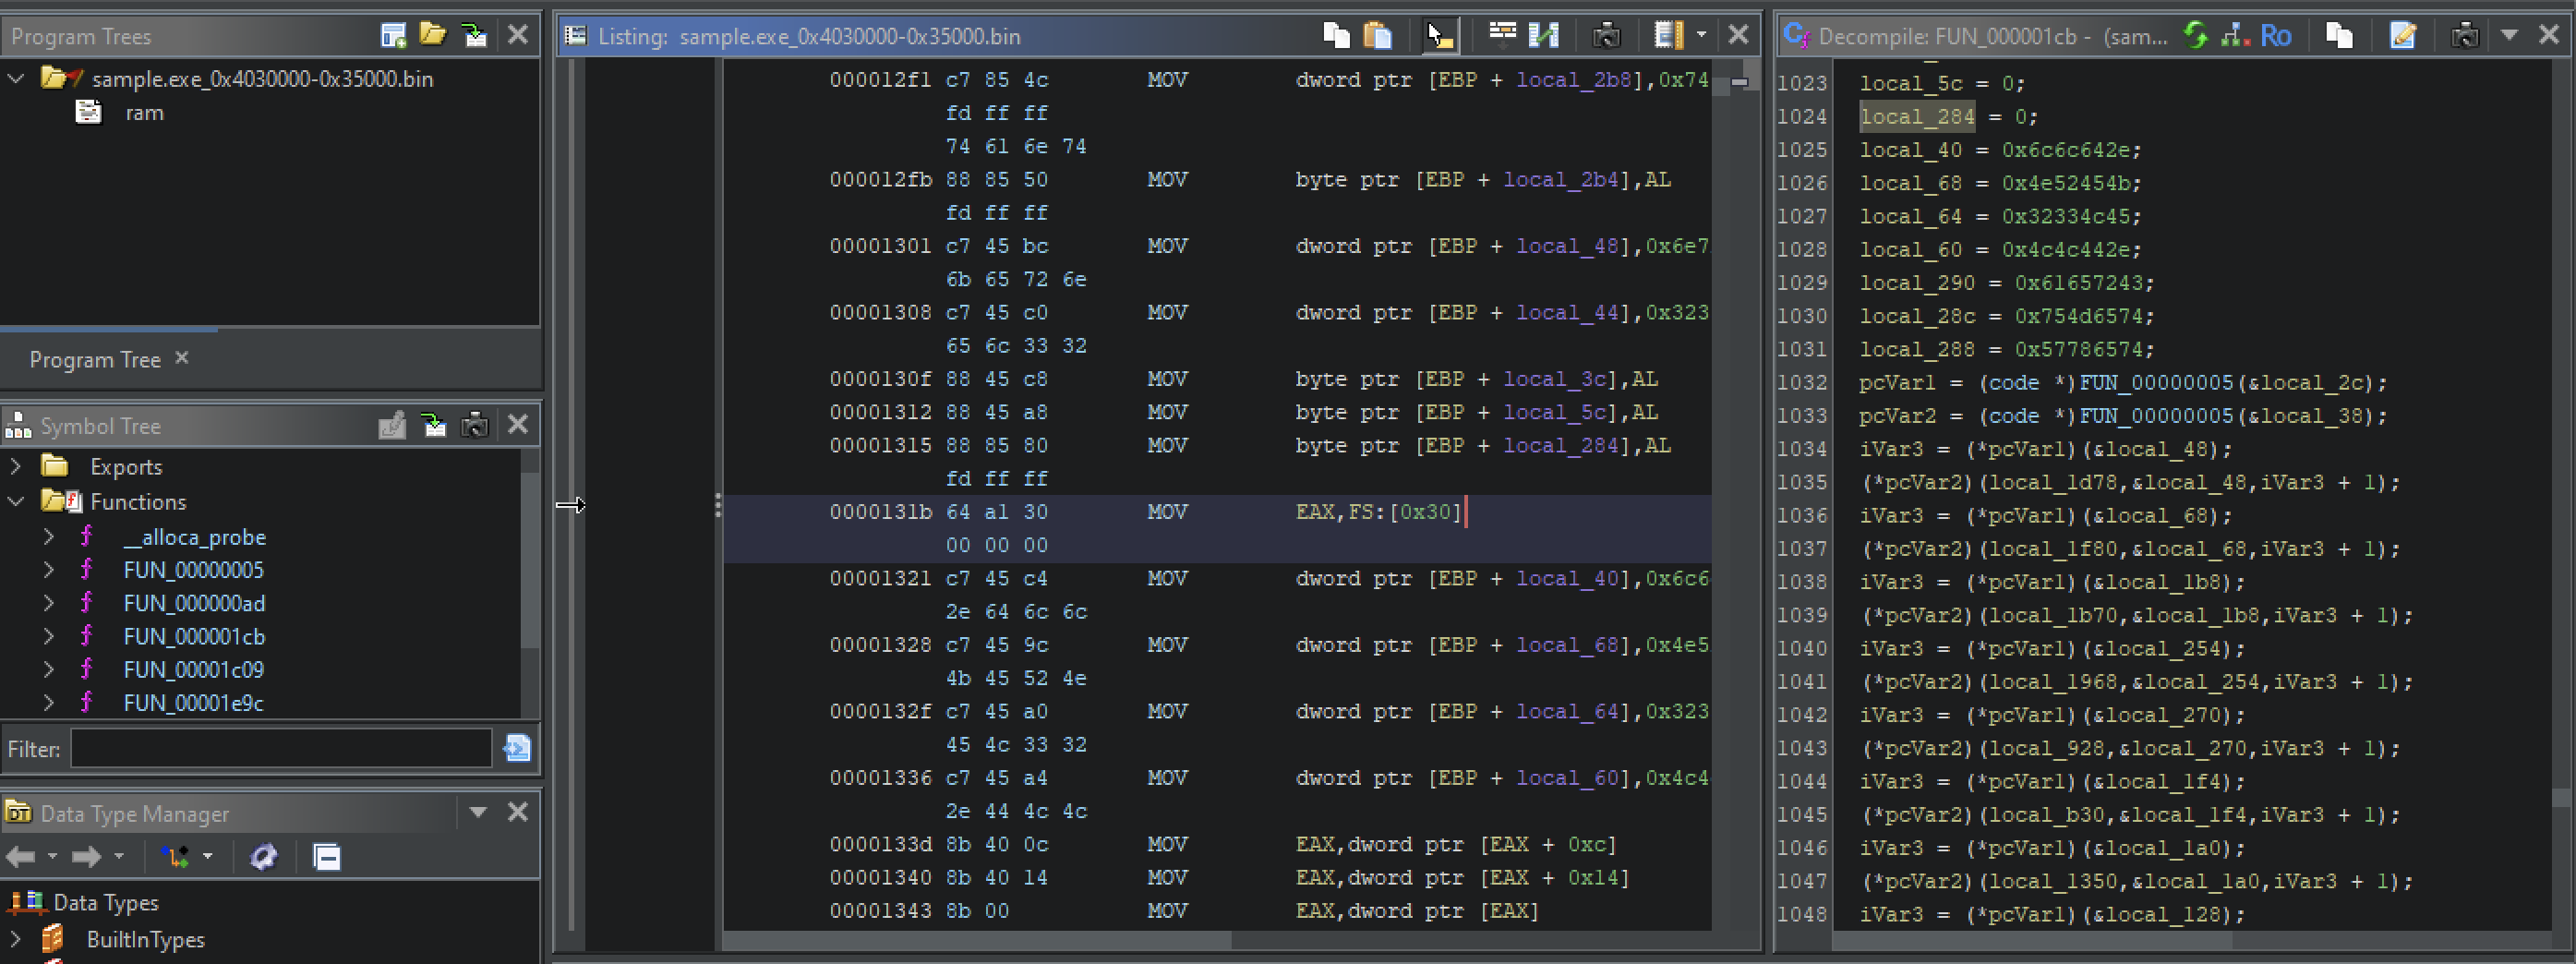
0000131b MOV EAX, FS:[0x30]In 32-bit Windows processes, FS:[0x30] points directly to the PEB (Process Environment Block). The PEB contains useful information about the running process, including:
Malware and shellcode commonly access the PEB directly to:
This strongly supports the earlier observation that the payload is dynamically resolving Windows APIs at runtime instead of relying on normal imports.
FUN00000005()
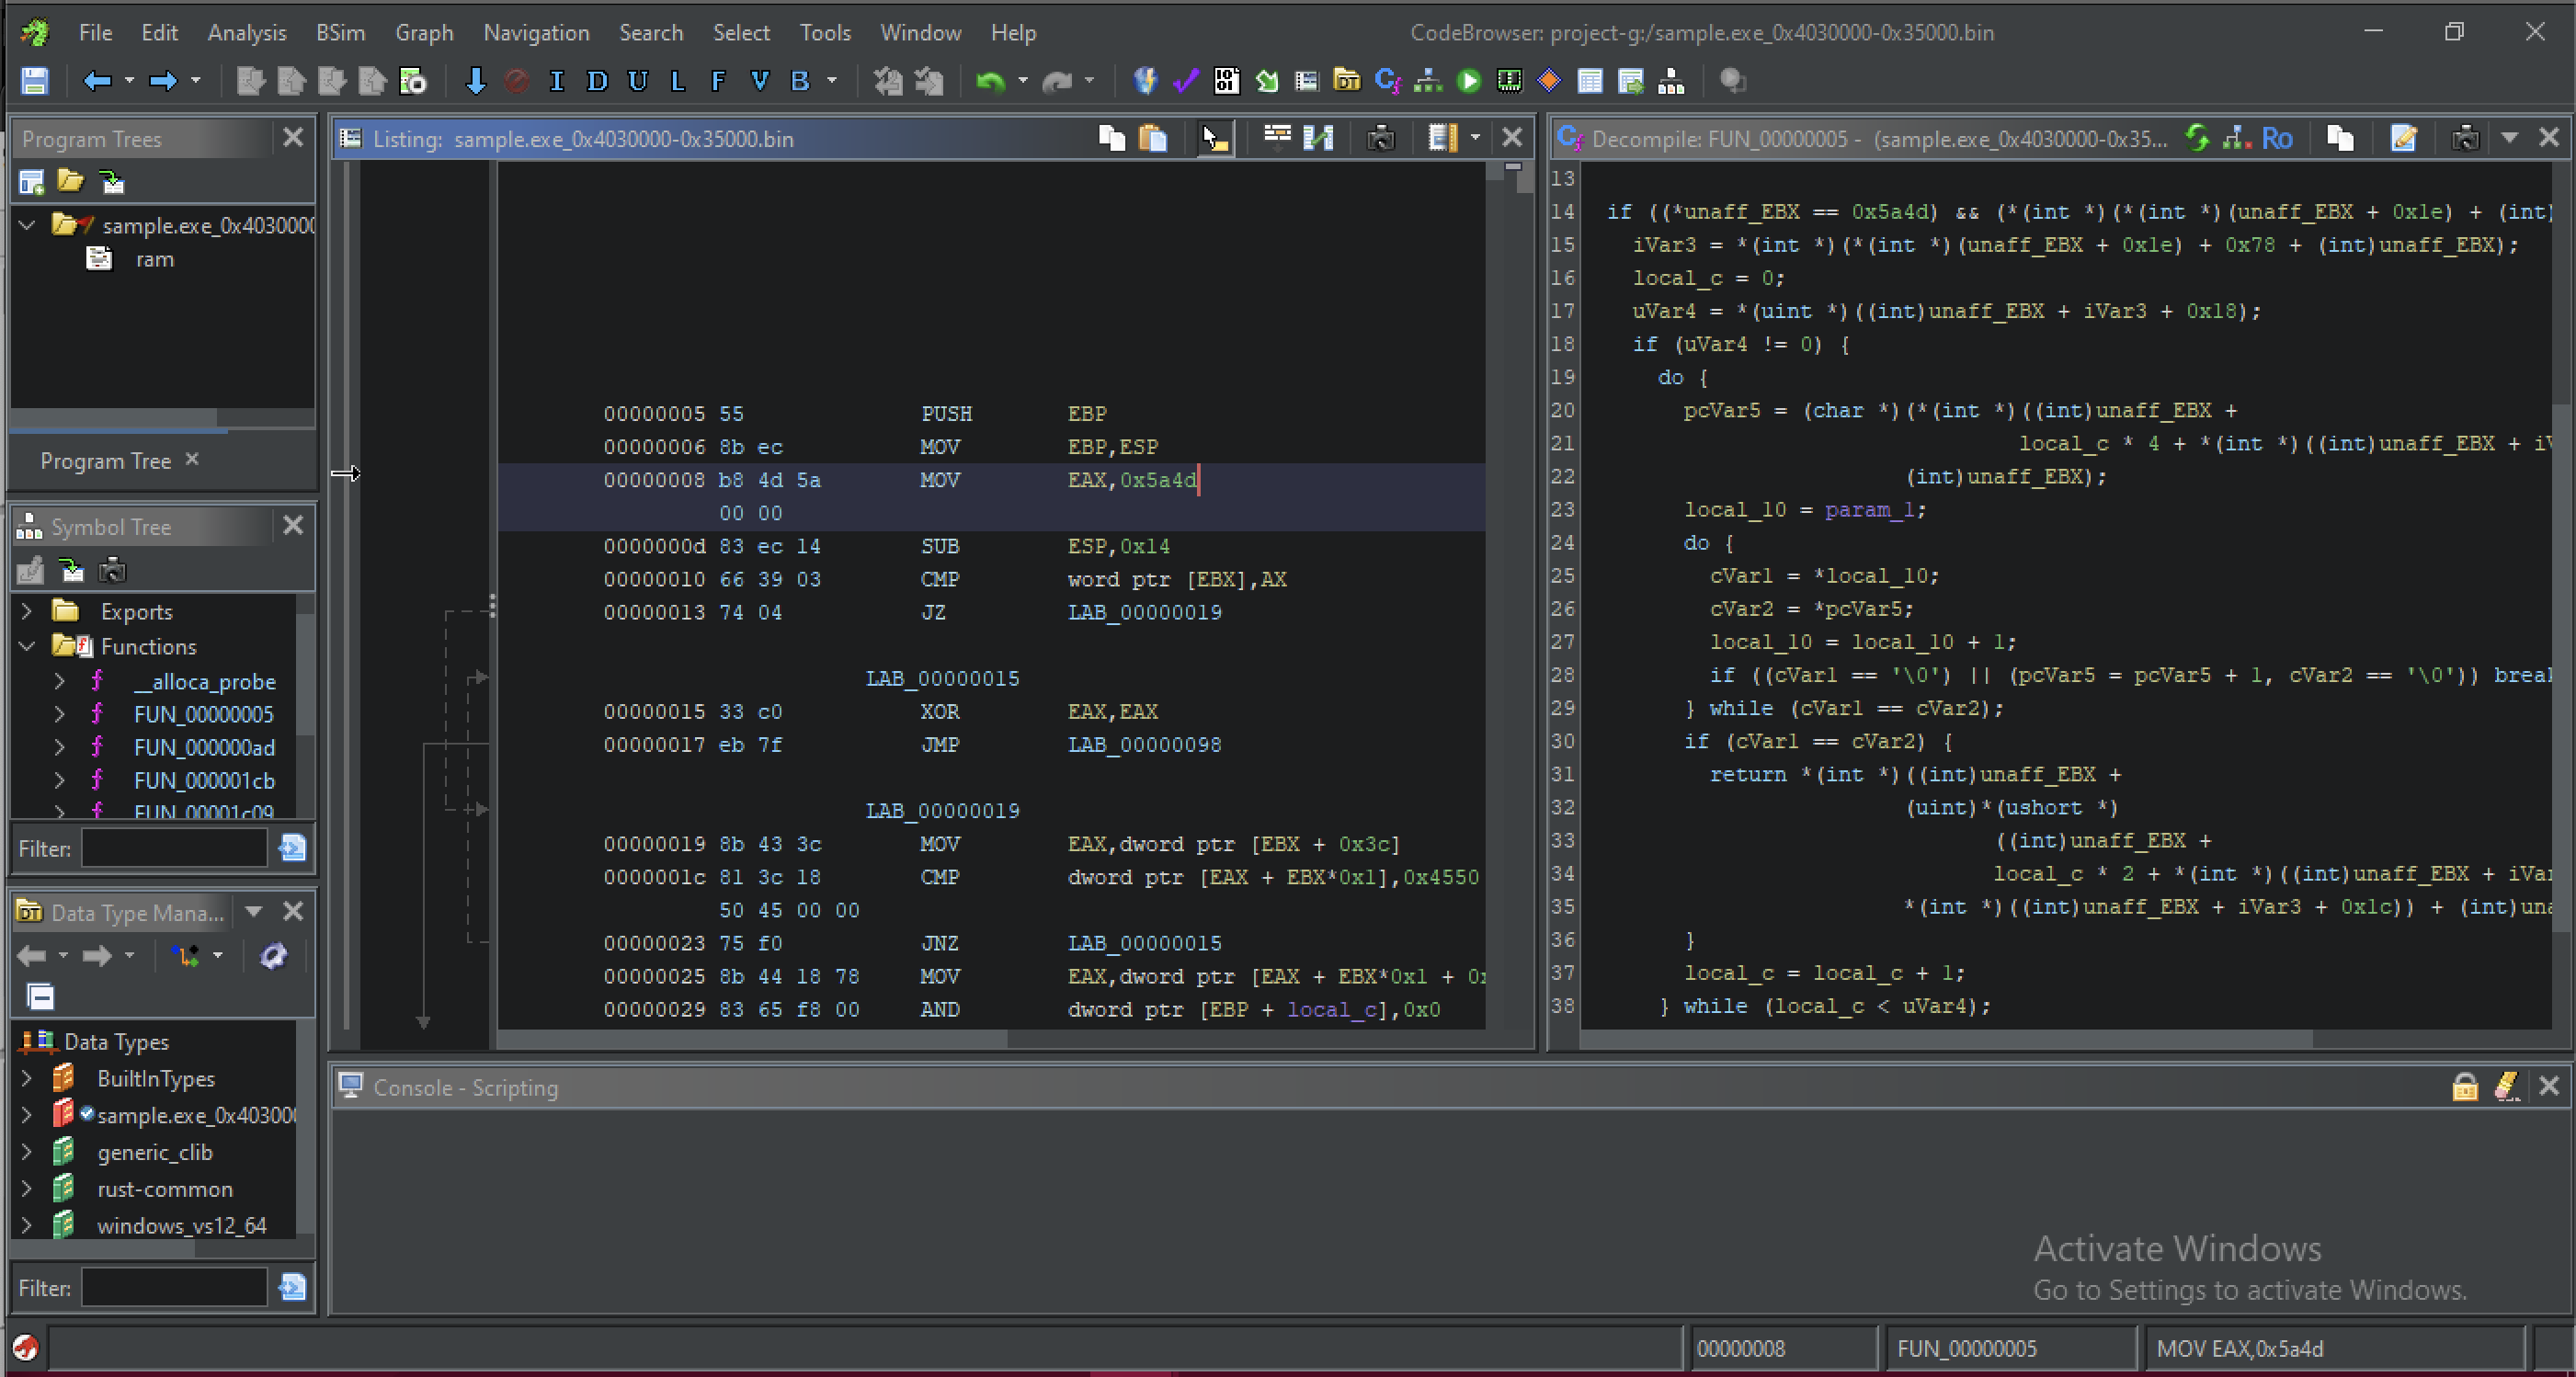
FUN_00000005() is a classic dynamic API resolution function commonly seen in shellcode and malware. Instead of using the normal Windows Import Address Table (IAT), the malware manually searches for API addresses inside loaded DLLs at runtime.
The function first verifies that the module in memory is a valid PE file by checking:
0x5A4D (MZ) → DOS header0x4550 (PE) → PE headerIt then locates the Export Address Table (EAT) of the DLL and begins iterating through exported function names. The input parameter param_1 contains the API name the malware is searching for.
The function compares each exported API name character-by-character:
while (cVar1 == cVar2)If a match is found, the function retrieves and returns the actual memory address of the API:
return API_address;/*
FUN_00000005()
Purpose:
Dynamically resolves API addresses from a loaded DLL by manually
parsing the Export Address Table (EAT).
This technique is commonly used in shellcode and malware to avoid
importing suspicious APIs through the normal Import Address Table (IAT).
*/
int FUN_00000005(char *param_1)
{
char cVar1;
char cVar2;
int iVar3;
uint uVar4;
char *pcVar5;
// Points to the base address of a loaded module/DLL
short *unaff_EBX;
char *local_10;
// Loop counter
uint local_c;
/*
Validate DOS Header
0x5A4D = "MZ"
*/
if ((*unaff_EBX == 0x5a4d)
&&
/*
Validate PE Header
0x4550 = "PE"
*/
(*(int *)(*(int *)(unaff_EBX + 0x1e)
+ (int)unaff_EBX) == 0x4550))
{
/*
Locate the Export Address Table (EAT)
PE Optional Header + Export Directory RVA
*/
iVar3 =
*(int *)(*(int *)(unaff_EBX + 0x1e)
+ 0x78
+ (int)unaff_EBX);
// Start from first exported function
local_c = 0;
/*
Number of exported APIs
*/
uVar4 =
*(uint *)((int)unaff_EBX
+ iVar3
+ 0x18);
// Continue only if exports exist
if (uVar4 != 0) {
do {
/*
Get current exported API name
*/
pcVar5 =
(char *)(
*(int *)(
(int)unaff_EBX
+ local_c * 4
+ *(int *)(
(int)unaff_EBX
+ iVar3
+ 0x20
)
)
+ (int)unaff_EBX
);
// API name we are searching for
local_10 = param_1;
/*
Compare strings character-by-character
*/
do {
cVar1 = *local_10;
cVar2 = *pcVar5;
local_10 = local_10 + 1;
/*
Stop comparison if NULL terminator reached
*/
if ((cVar1 == '\0')
||
(
pcVar5 = pcVar5 + 1,
cVar2 == '\0'
))
break;
} while (cVar1 == cVar2);
/*
If strings match -> API found
*/
if (cVar1 == cVar2) {
/*
Return resolved API address
Uses:
- Export Name Table
- Ordinal Table
- Export Address Table
*/
return
*(int *)(
(int)unaff_EBX
+
(uint)*(ushort *)(
(int)unaff_EBX
+
local_c * 2
+
*(int *)(
(int)unaff_EBX
+ iVar3
+ 0x24
)
) * 4
+
*(int *)(
(int)unaff_EBX
+ iVar3
+ 0x1c
)
)
+ (int)unaff_EBX;
}
// Move to next exported API
local_c = local_c + 1;
} while (local_c < uVar4);
}
}
// API not found
return 0;
}
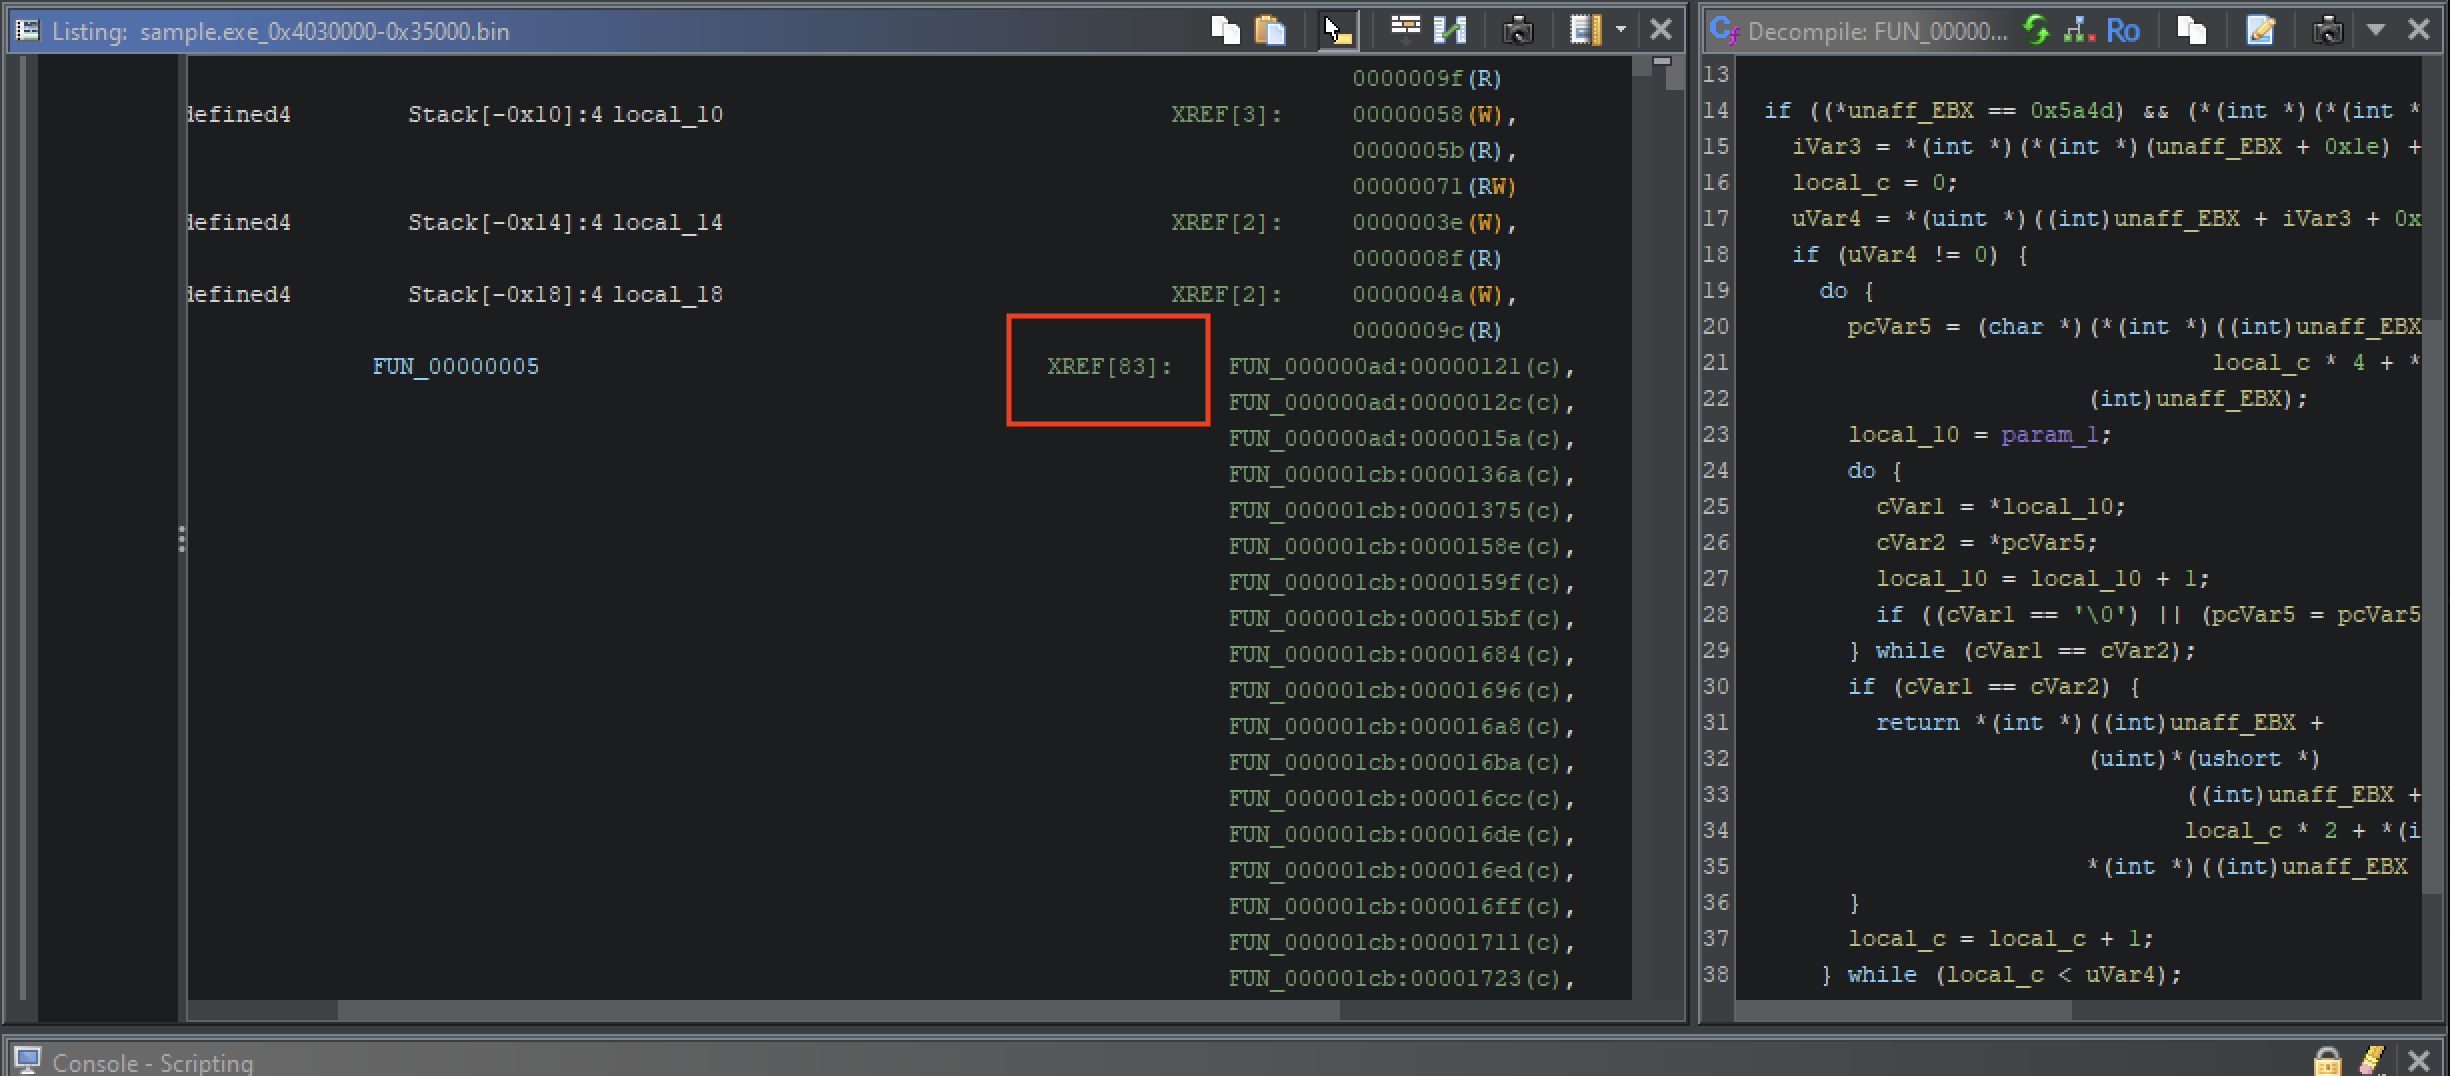
The function FUN_00000005() has 83 cross refrences.
This will convey a sense of importance, One of the most important things a shellcode needs to do is to make function calls.
This just continues to support our analysis, responsible for resolving those function pointer.
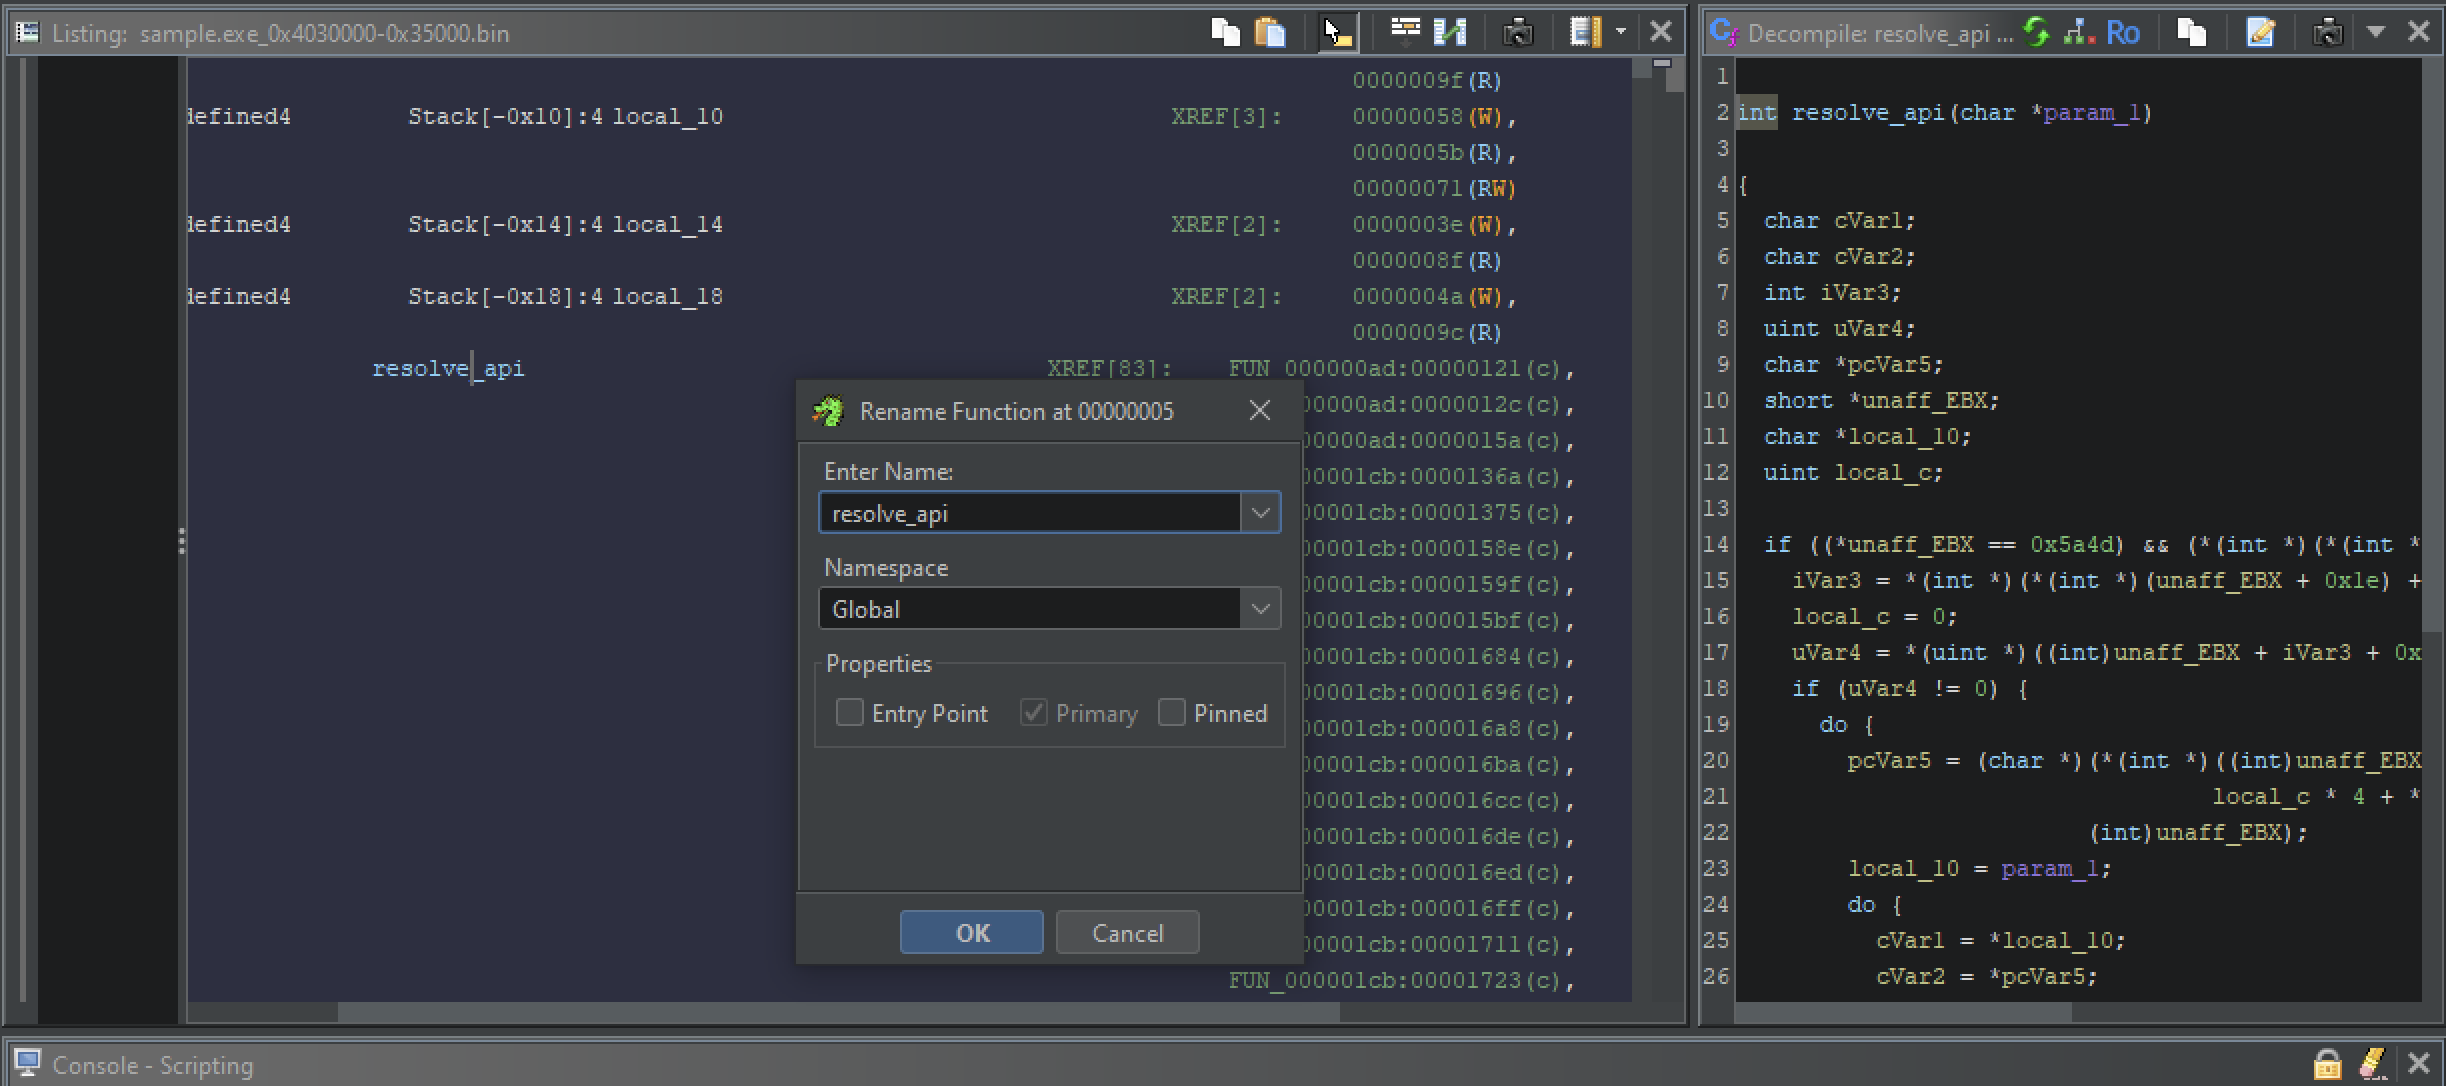
Let’s just change the label from FUN_00000005 to resolve_api
First, the program calls resolve_api() and stores the returned API address in the ESI register. It then resolves another API and stores that address in EDI. Later, the malware calls the resolved API indirectly using:
CALL ESI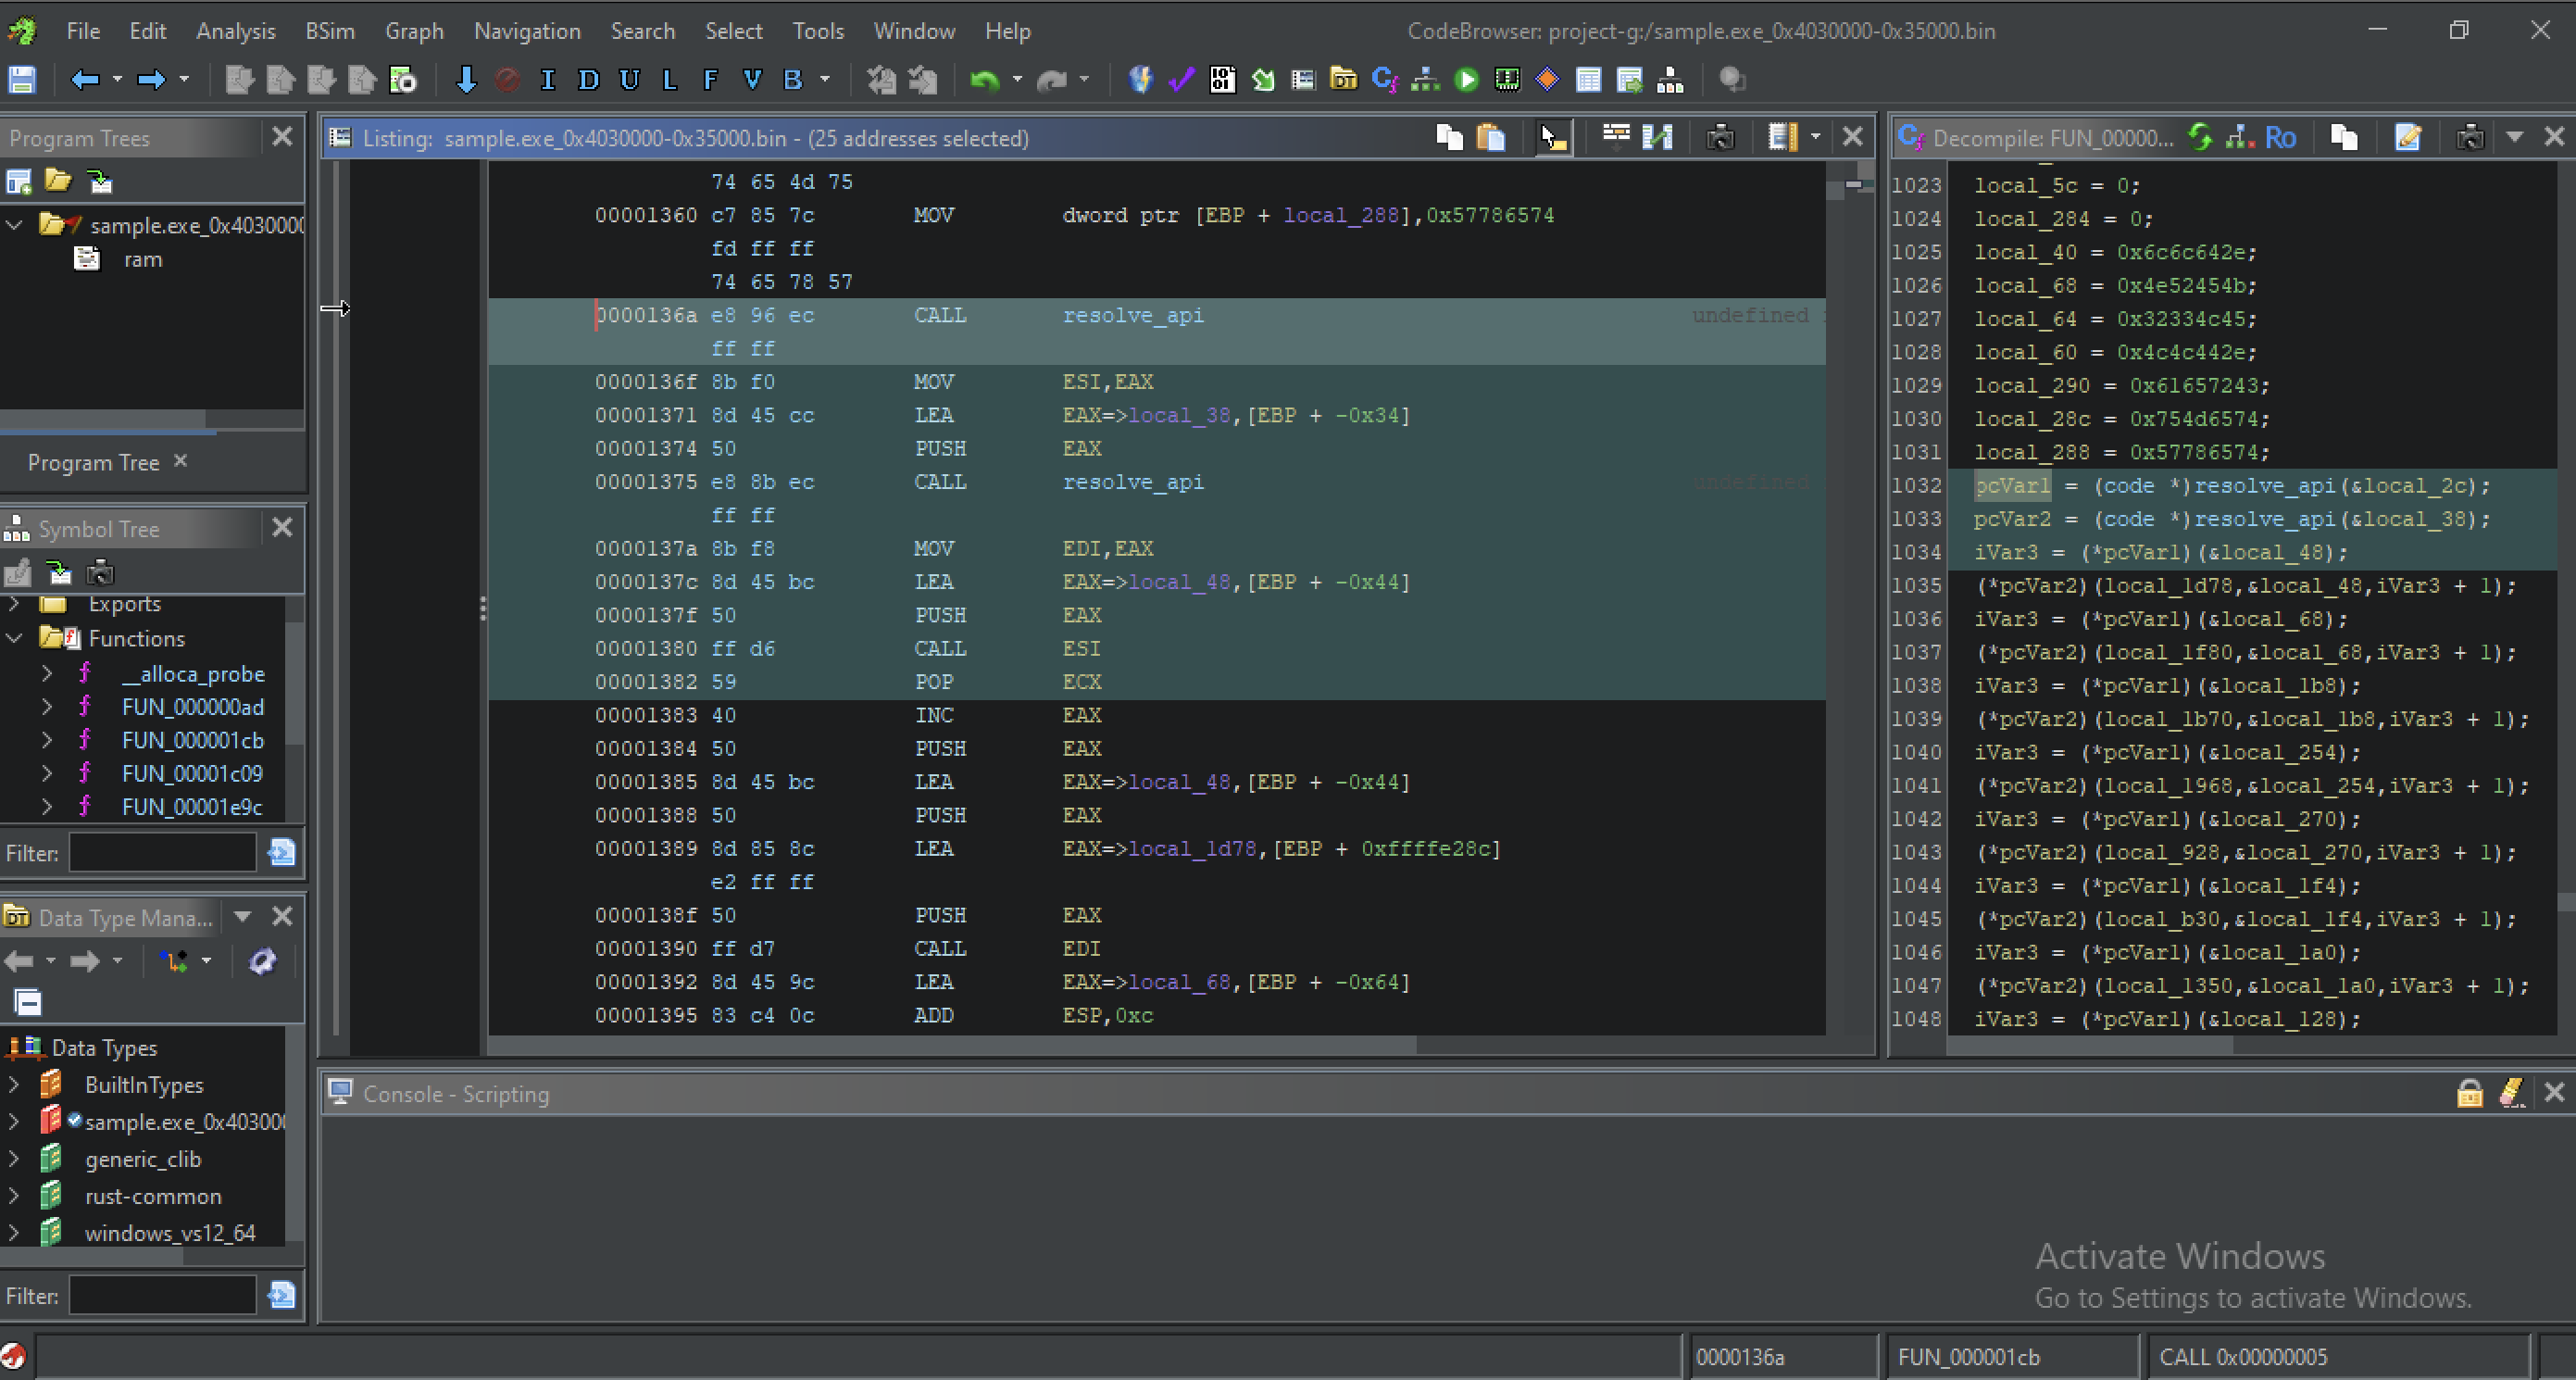
The value of the function pointer is returning an EAX
Then moved into ESI, a few instructions later there’s a call to ESI.
ESI is not changed or modify in between. So this confirms that this function is returning a pointer that is later called.