The majority of malware currently conceals essential code or information. One of the quickest methods to reveal what is truly occurring is by using a debugger. However, in the absence of a defined method, you may quickly find yourself navigating through code without understanding what truly matters. I’m Chandra, a malware analyst intern. I'll demonstrate how to uncover and extract a concealed Windows executable using a debugger.
SAMPLE
| Property | Value |
|---|---|
| MD5 | 9cc16d49ae878ee996aa62da9325a251 |
| SHA-1 | 81f1496ece08561f01c169cffd876c98ad3001ef |
| SHA-256 | bca3fca9b5d33f31e563c2a58c0d23e41a17c3ed9124b492ccd8fbe5dea2b05e |
| Vhash | 0350b76d7515151c0d1d1az221e=z |
| Authentihash | 0341eaa0c49dc1048b0fe124e1bb379af0e4631af4a451513f3761eaa47dfee4 |
| Imphash | e5313df3be14d29a8a7a35aaad249a83 |
| SSDEEP | 6144:E1KzmclM+pNK2U2CJOf+UecVoYyoSqdhrjUEEl+O3+N3jaiIQPdPn0if7h+ClZuF:t3lM+DU2Cv94oYbSc7ElS3jaQPnNf7ho |
| TLSH | T1EC84ADE3F94624ECDE26C9307A63F1DF2923F52C305CE9F652179E23BA10CA44199879 |
| File type | Win32 EXE |
| Tags | executable, windows, win32, pe, peexe |
| Magic | PE32+ executable (GUI) x86-64 (stripped to external PDB), for MS Windows |
| TrID | Microsoft Visual C++ compiled executable (generic) (45.6%) Win64 Executable (generic) (18%) Win16 NE executable (generic) (13.9%) Windows Icons Library (generic) (5.6%) OS/2 Executable (generic) (5.6%) |
| Magika | PEBIN |
| File size | 380.50 KB (389632 bytes) |
DIE
To get some basic information about the file, let me go here and drop explorer.exe onto the DIE
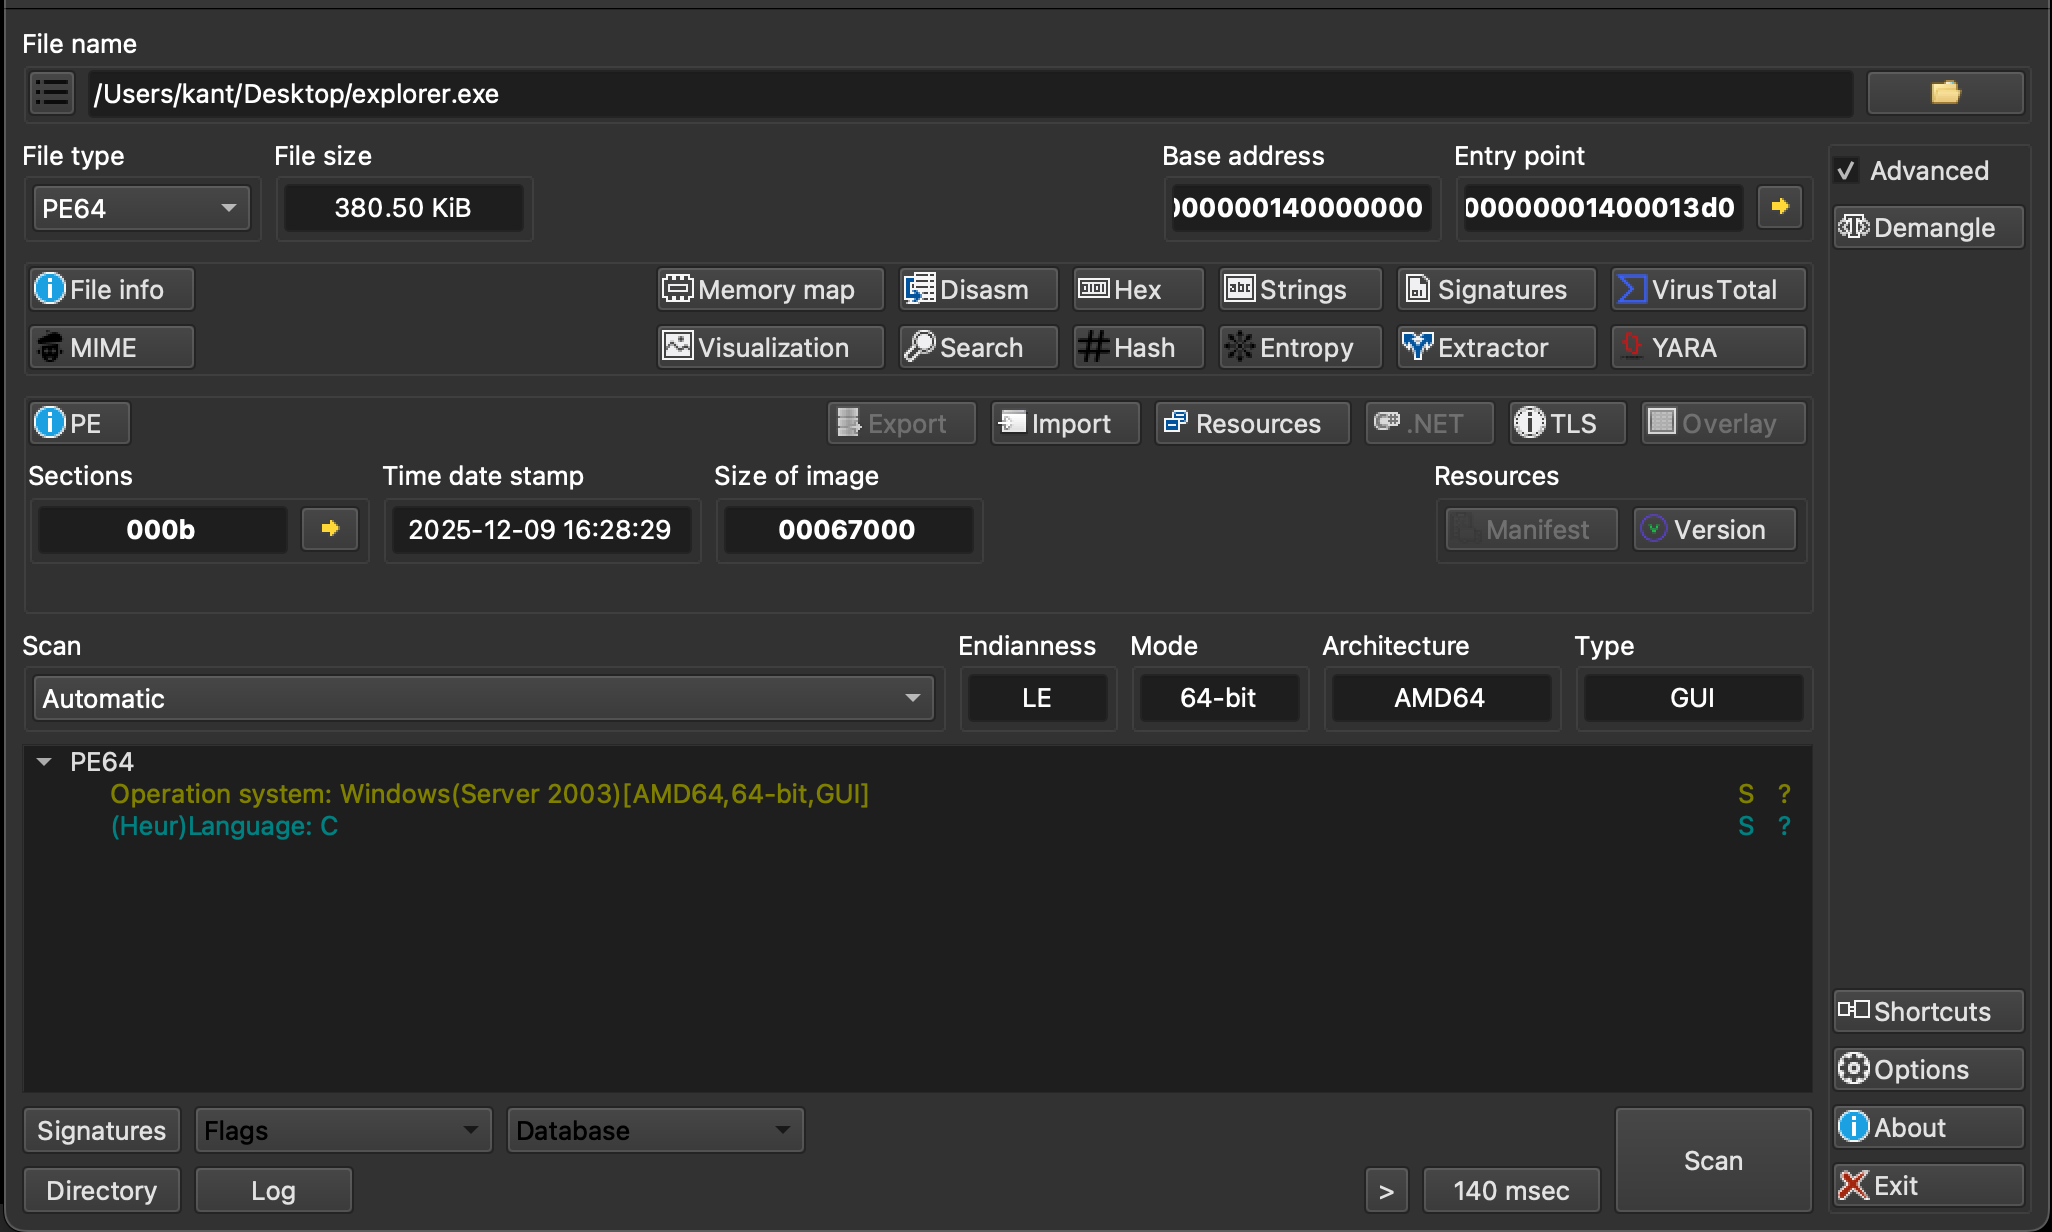
Immediately, I can tell that this is a 64-bit Windows executable and it’s probably written in C. Detected easy can likewise determine if a file is packed or obfuscated by utilizing recognized packers through their signatures. However, in this situation, nothing apparent is identified because if it were, you would observe it in this empty space under the current text.
Another aspect I prefer to examine initially is the entropy of the files, which indicates the level of randomness. The greater the randomness of the bite distribution, whether throughout the entire file or in particular sections, the higher the probability that some data has been obfuscated.
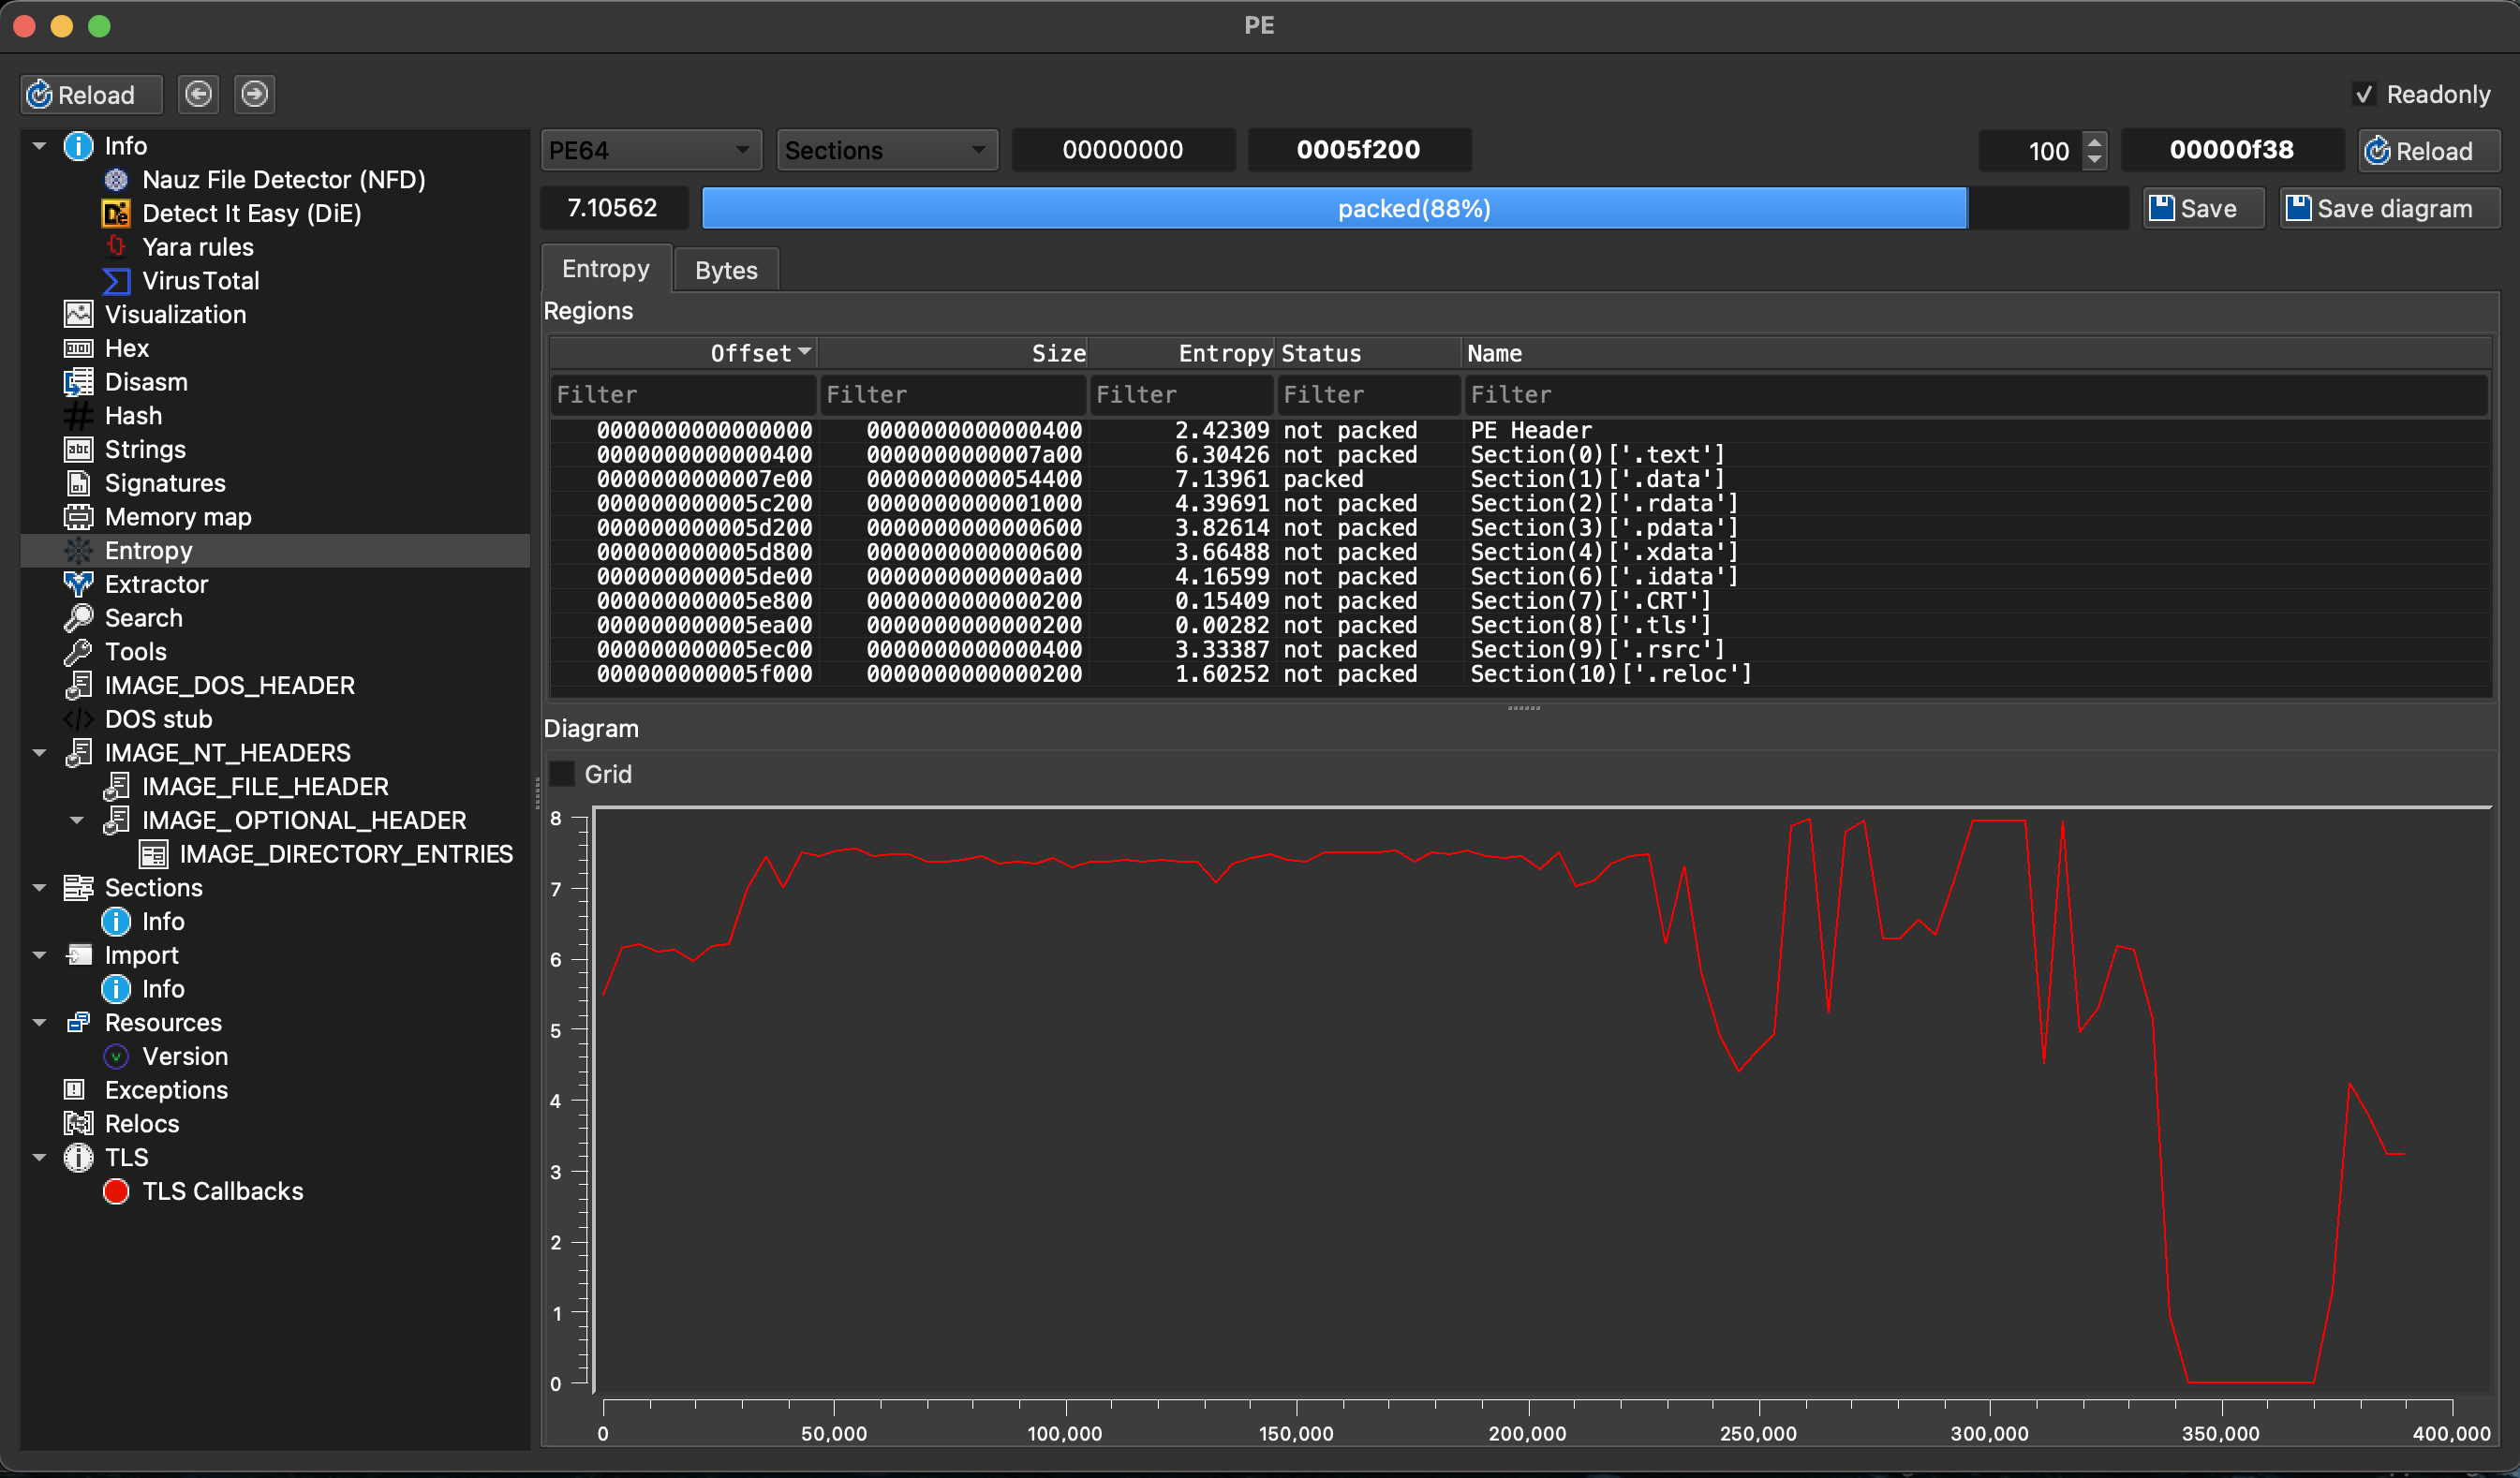
This displays the entropy values for the separate segments that comprise this executable. Currently, every section features an entropy value ranging from 0 to 8, with lower values suggesting more organized data and higher values signifying greater randomness.
In this instance, you can observe that there is solely one part, the data section, marked as packed.
If I want to examine the data section more closely, I can click on sections over here on the left side. I can then select the data section located at the top. At the bottom, there's a hex dump of that specific section.
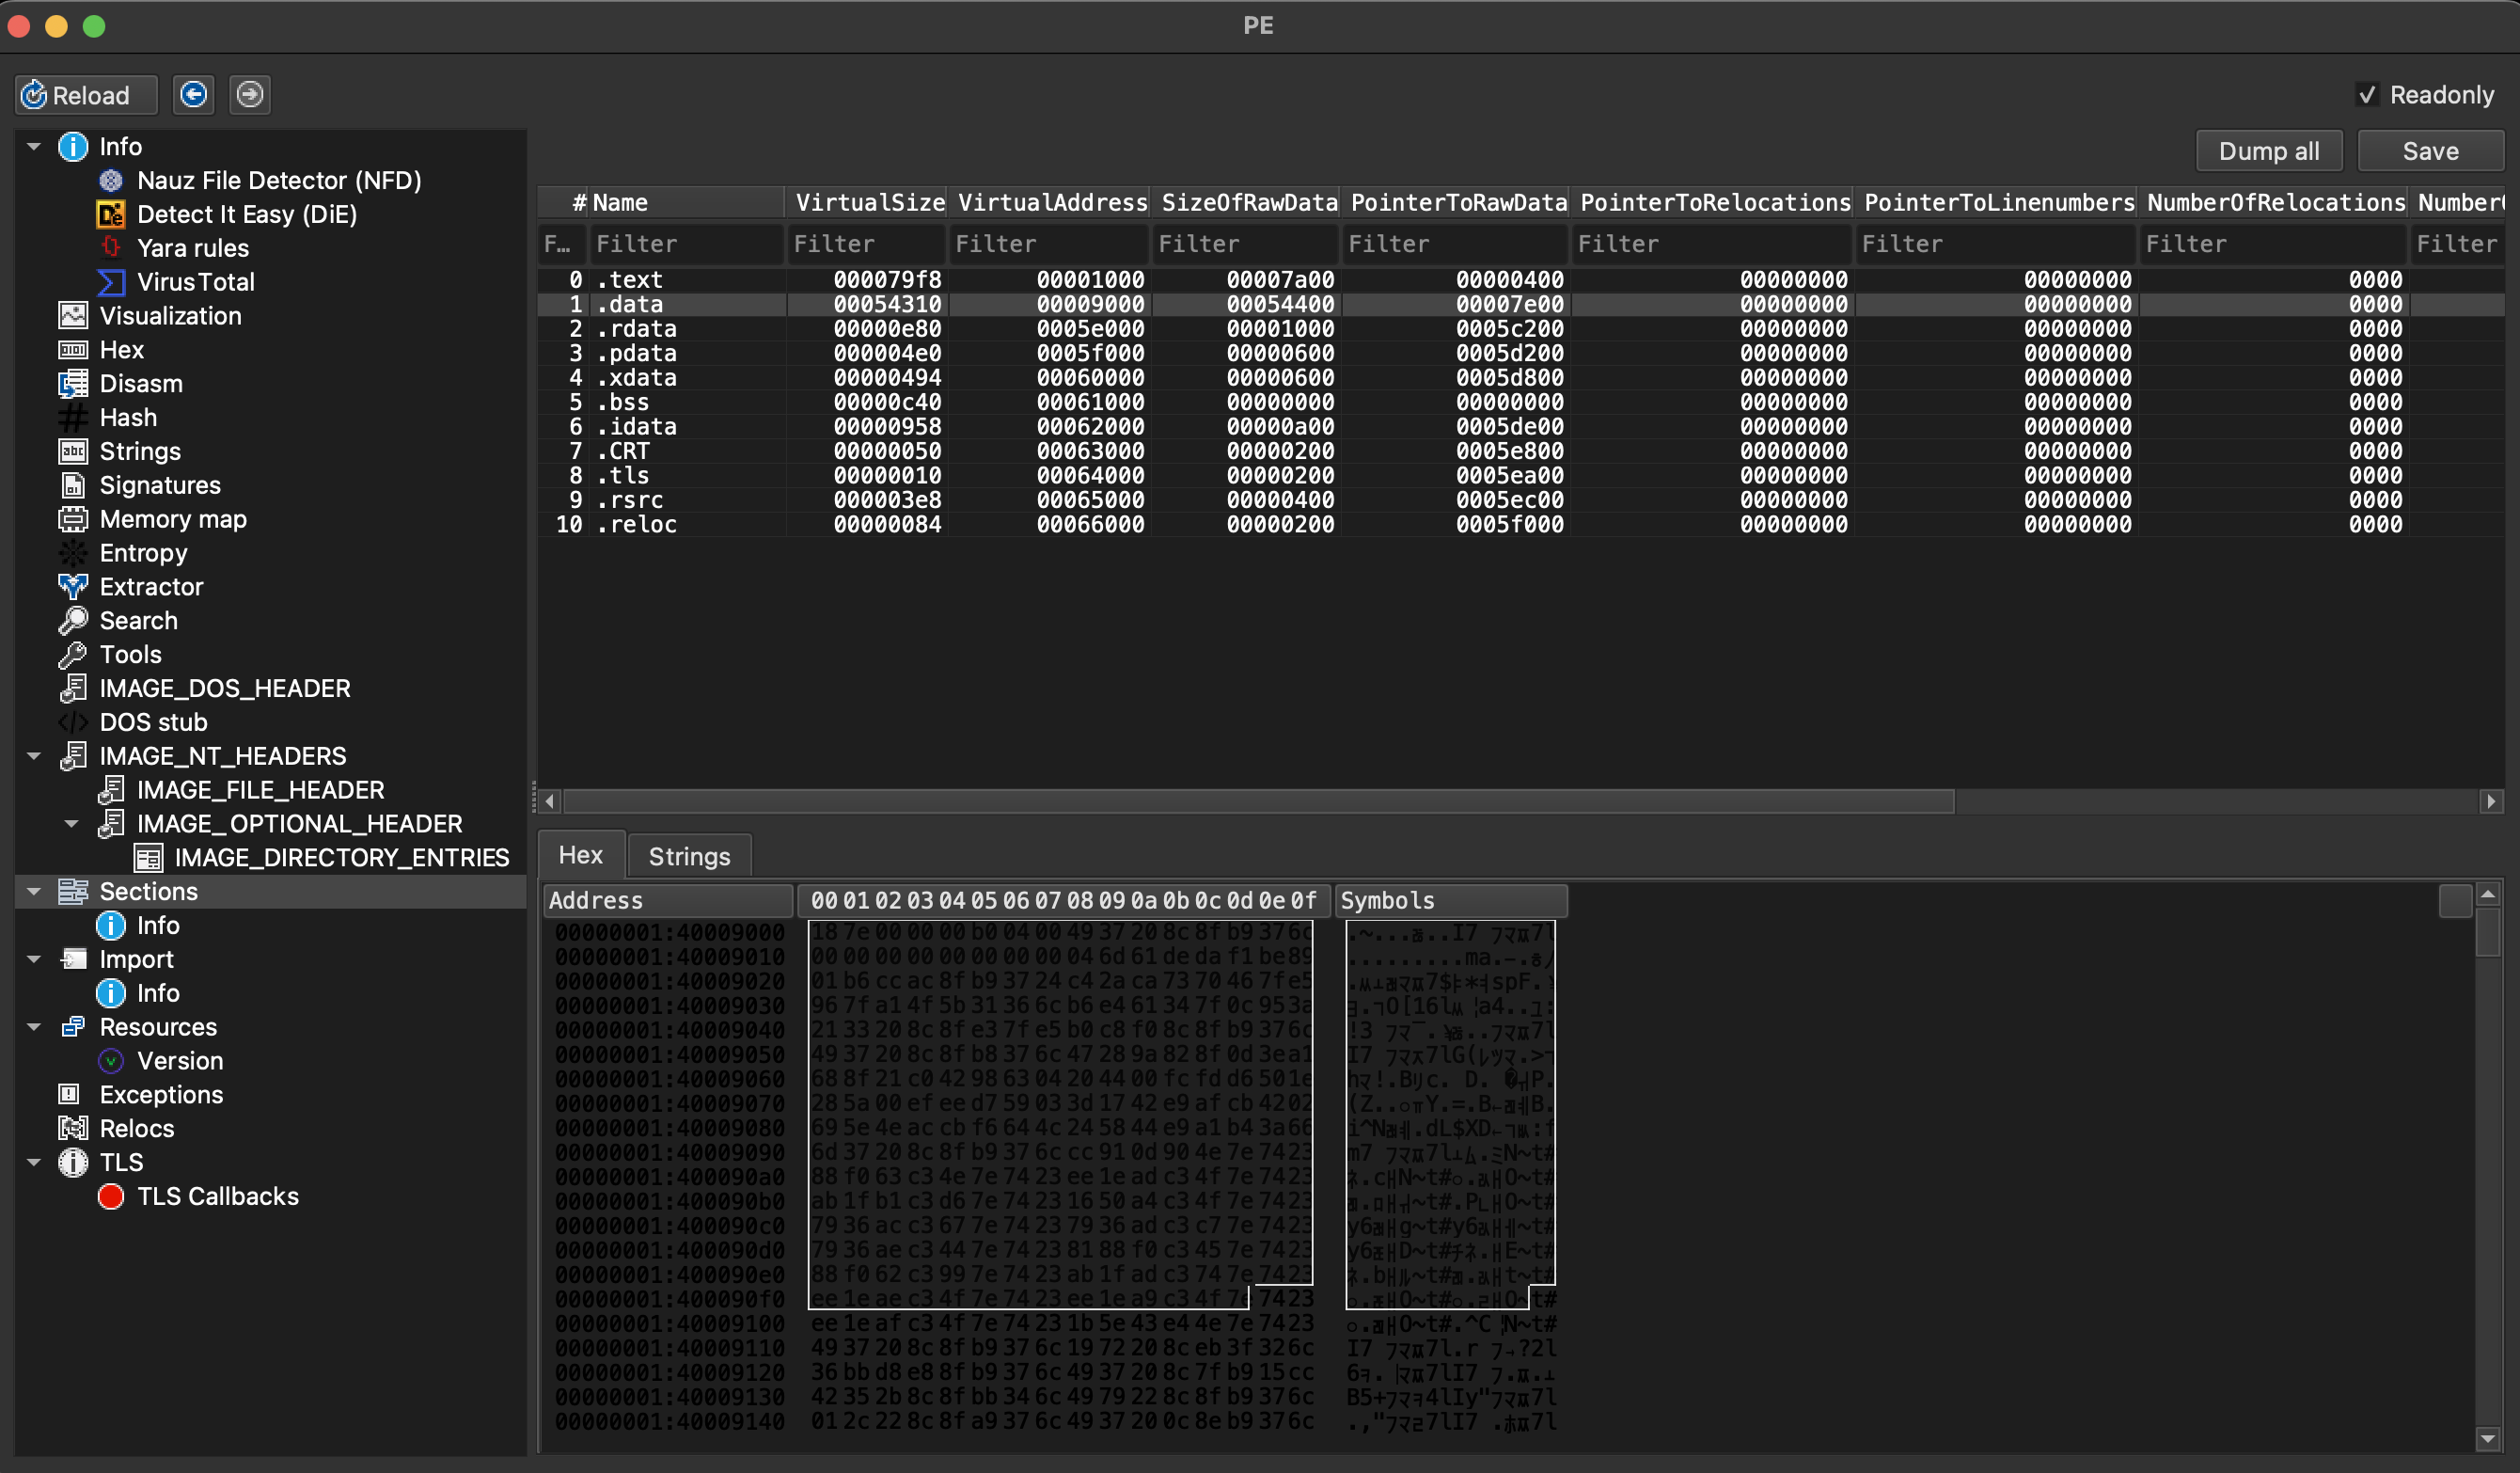
As I continue to scroll down, you'll begin to notice certain patterns. However, as I continue scrolling beyond those initial patterns, you'll notice that it consists mostly of random information. Examining the right side alongside the ASCII representation of the bytes on the left, it becomes evident that there isn't much readable information present. The information appears to be quite random. This serves as a strong sign that there could be some obfuscated material present.
The following question is what is it? When you encounter hidden data within a questionable program like this one, or at least what I refer to as a questionable program, it typically indicates that the data will be revealed during execution.
That is logical since the malware must expose the genuine coder information to effectively utilize it. A debugger is useful in this situation, as it allows us to pause execution at runtime and examine the actual coder data stored in memory when this content is exposed.
x64 debug is my preferred debugger for this type of work.
X64DBG Analysis
Let’s load the sample in dbg.
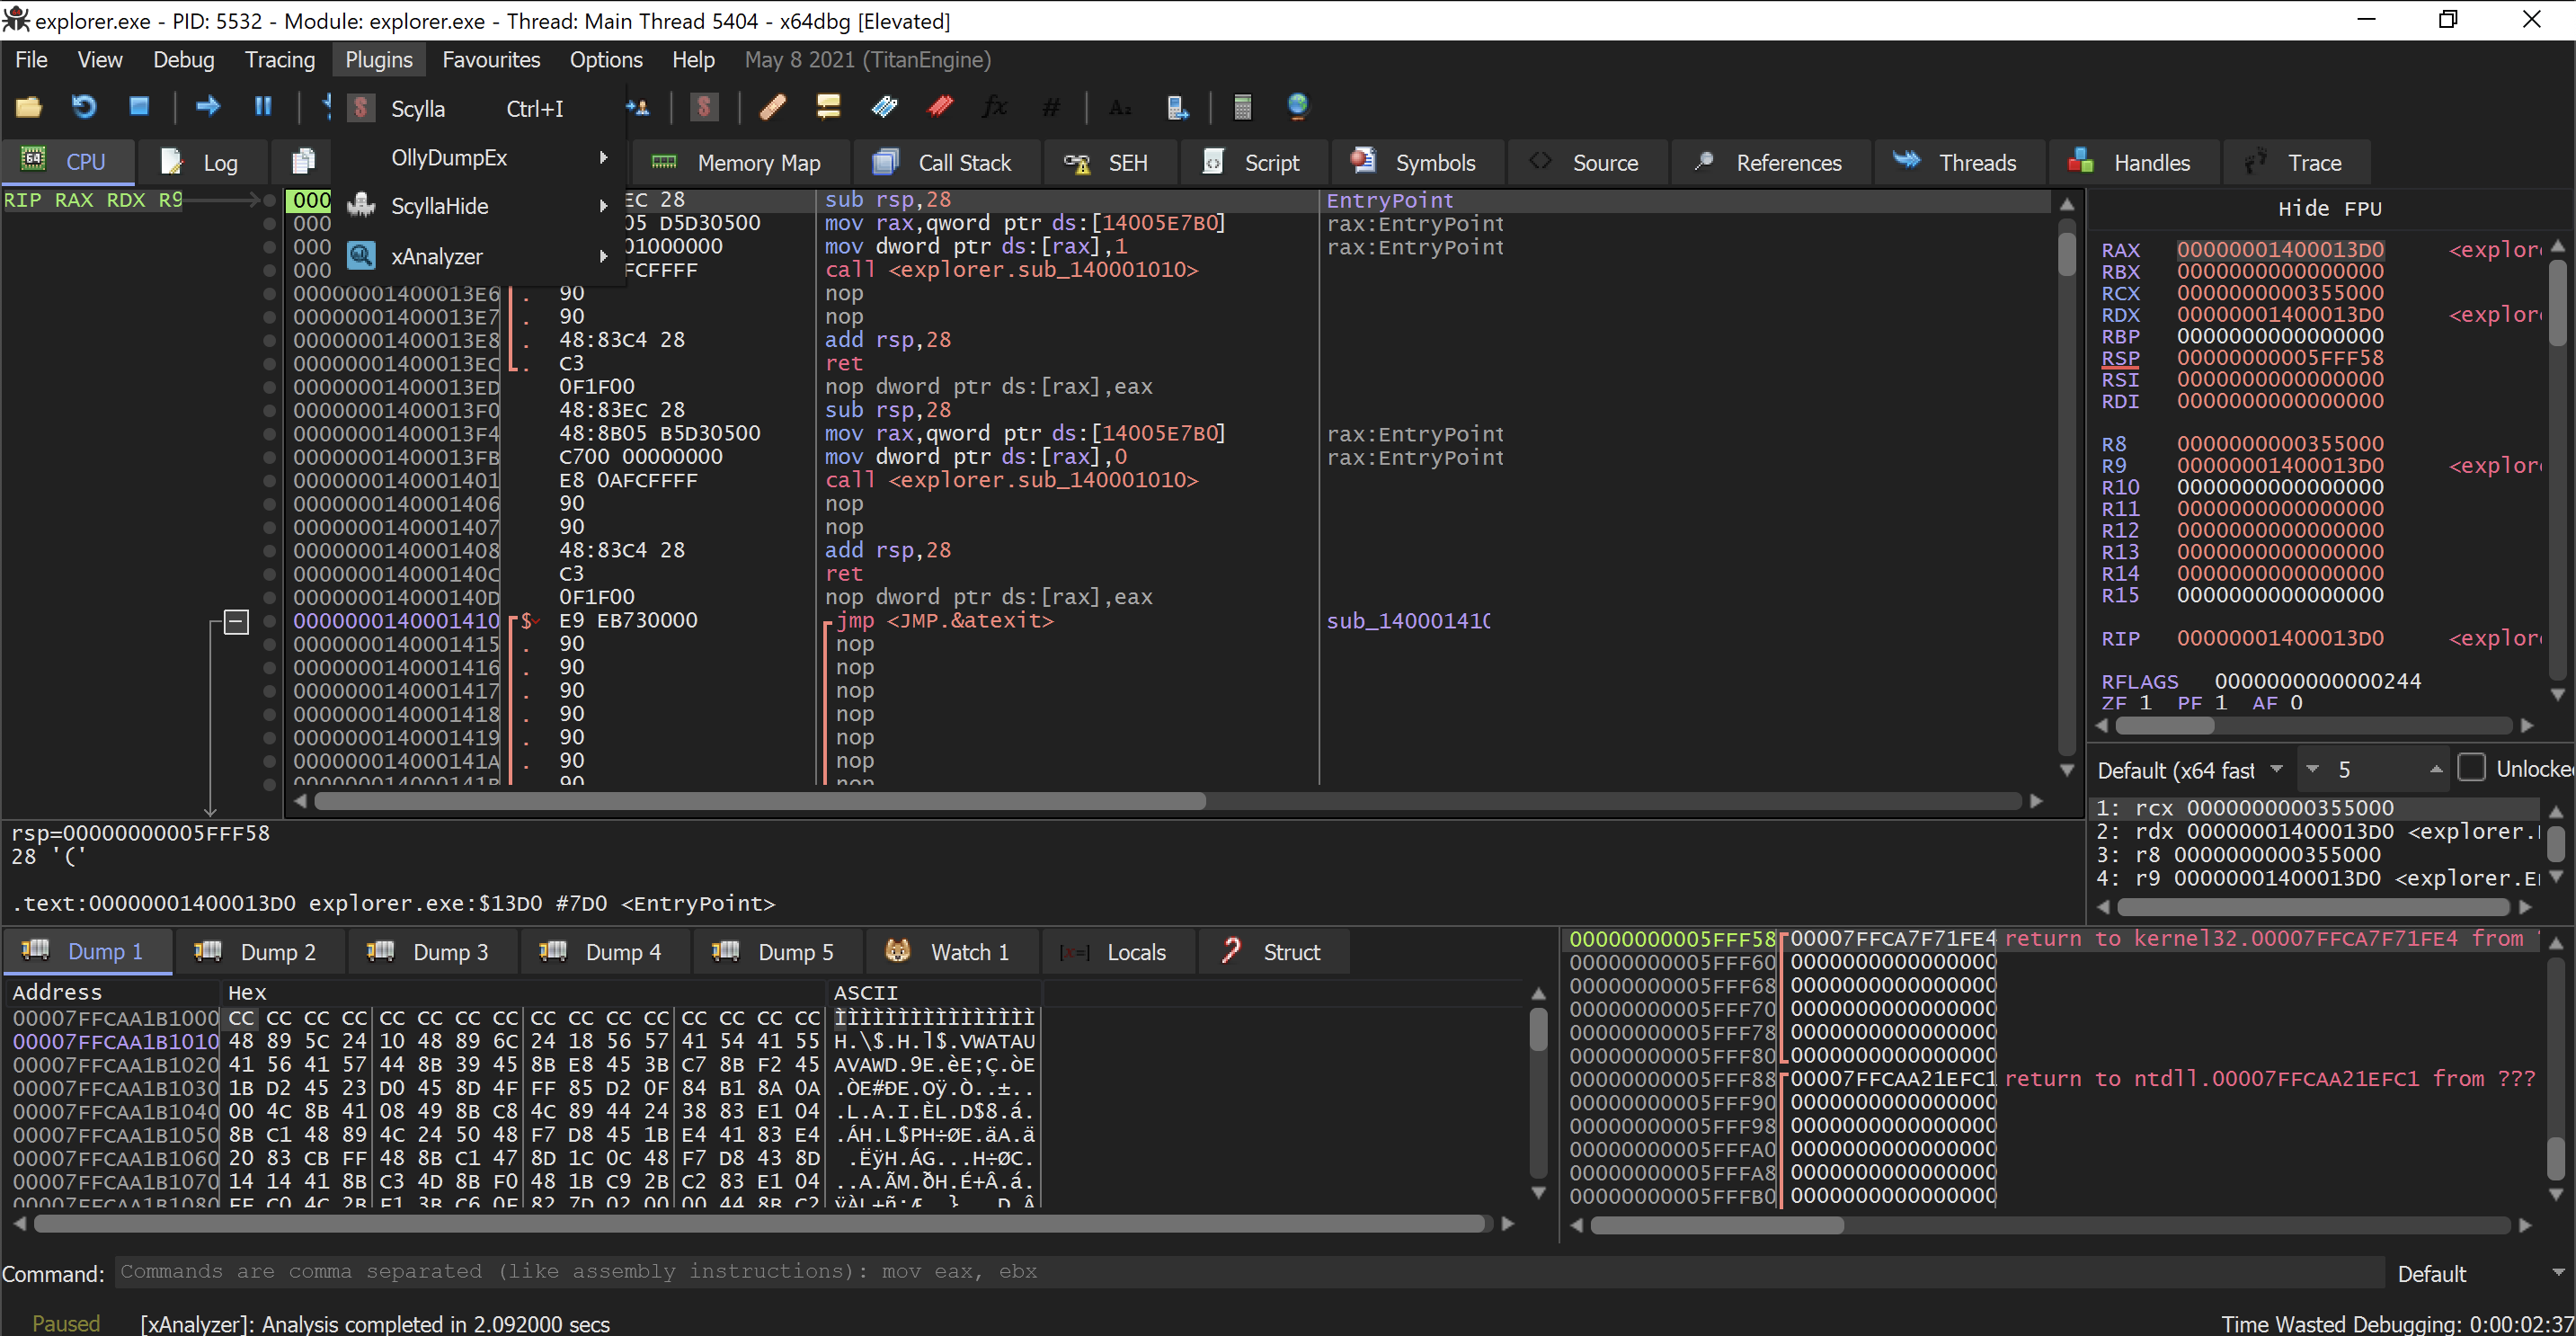
Entry point
execution is halted at the entry point. The entry point, incidentally, is the initial command in the program that the CPU will run. In the lower left corner, you can observe that x64 debug indicates we are currently paused.
The directive shaded in gray indicates the upcoming instruction to perform. In the rightmost column, it's evident that x64 debug has recognized this as the entry point.
There’s a lot to take in on this screen, but before we discuss anything further, I want to highlight a crucial configuration setting, particularly if you are keeping up, which I sincerely hope you will at some stage. I will go to the menu now and select options and then preferences. Under the events tab, please ensure that only the entry breakpoint checkbox is actively selected. If you possess any additional ones that are selected, feel free to deselect them. Go ahead and click save.
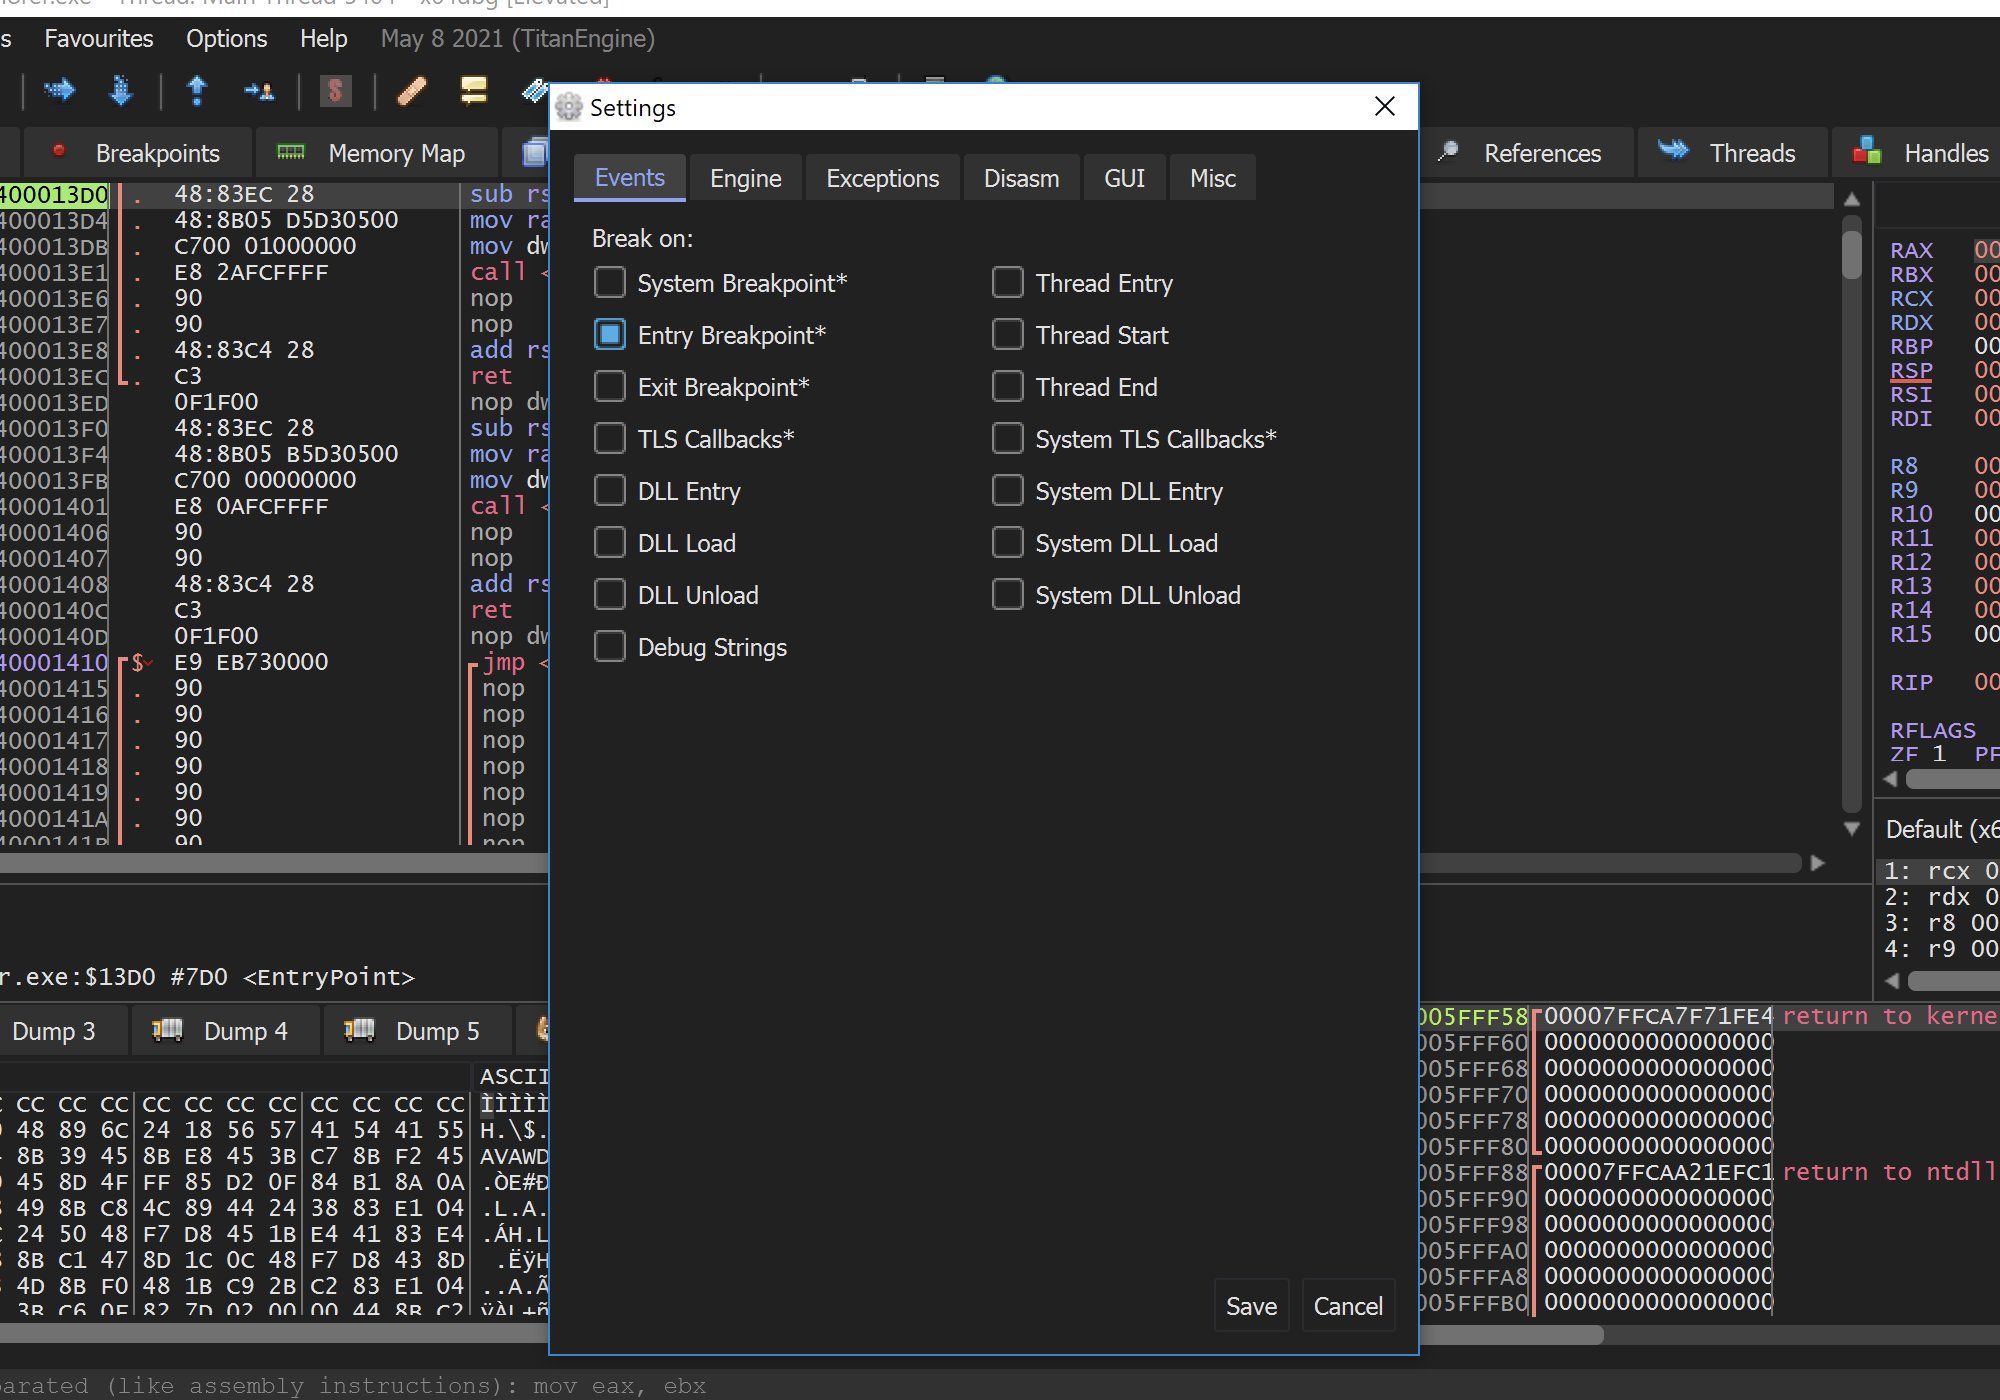
Next, from the menu bar, select debug and then click on restart, which will proceed to restart the program.
In the upper right corner, we find the registers window. Registers are quick, compact storage areas utilized by the CPU. Their dimensions align with the structure of the program. As we are examining a 64-bit executable, the registers have a width of 64 bits. Monitoring registers can provide you with understanding about the events occurring during execution. As instructions frequently read from and write to these registers, a register value turning red, similar to those shown in the image, indicates it has recently changed.
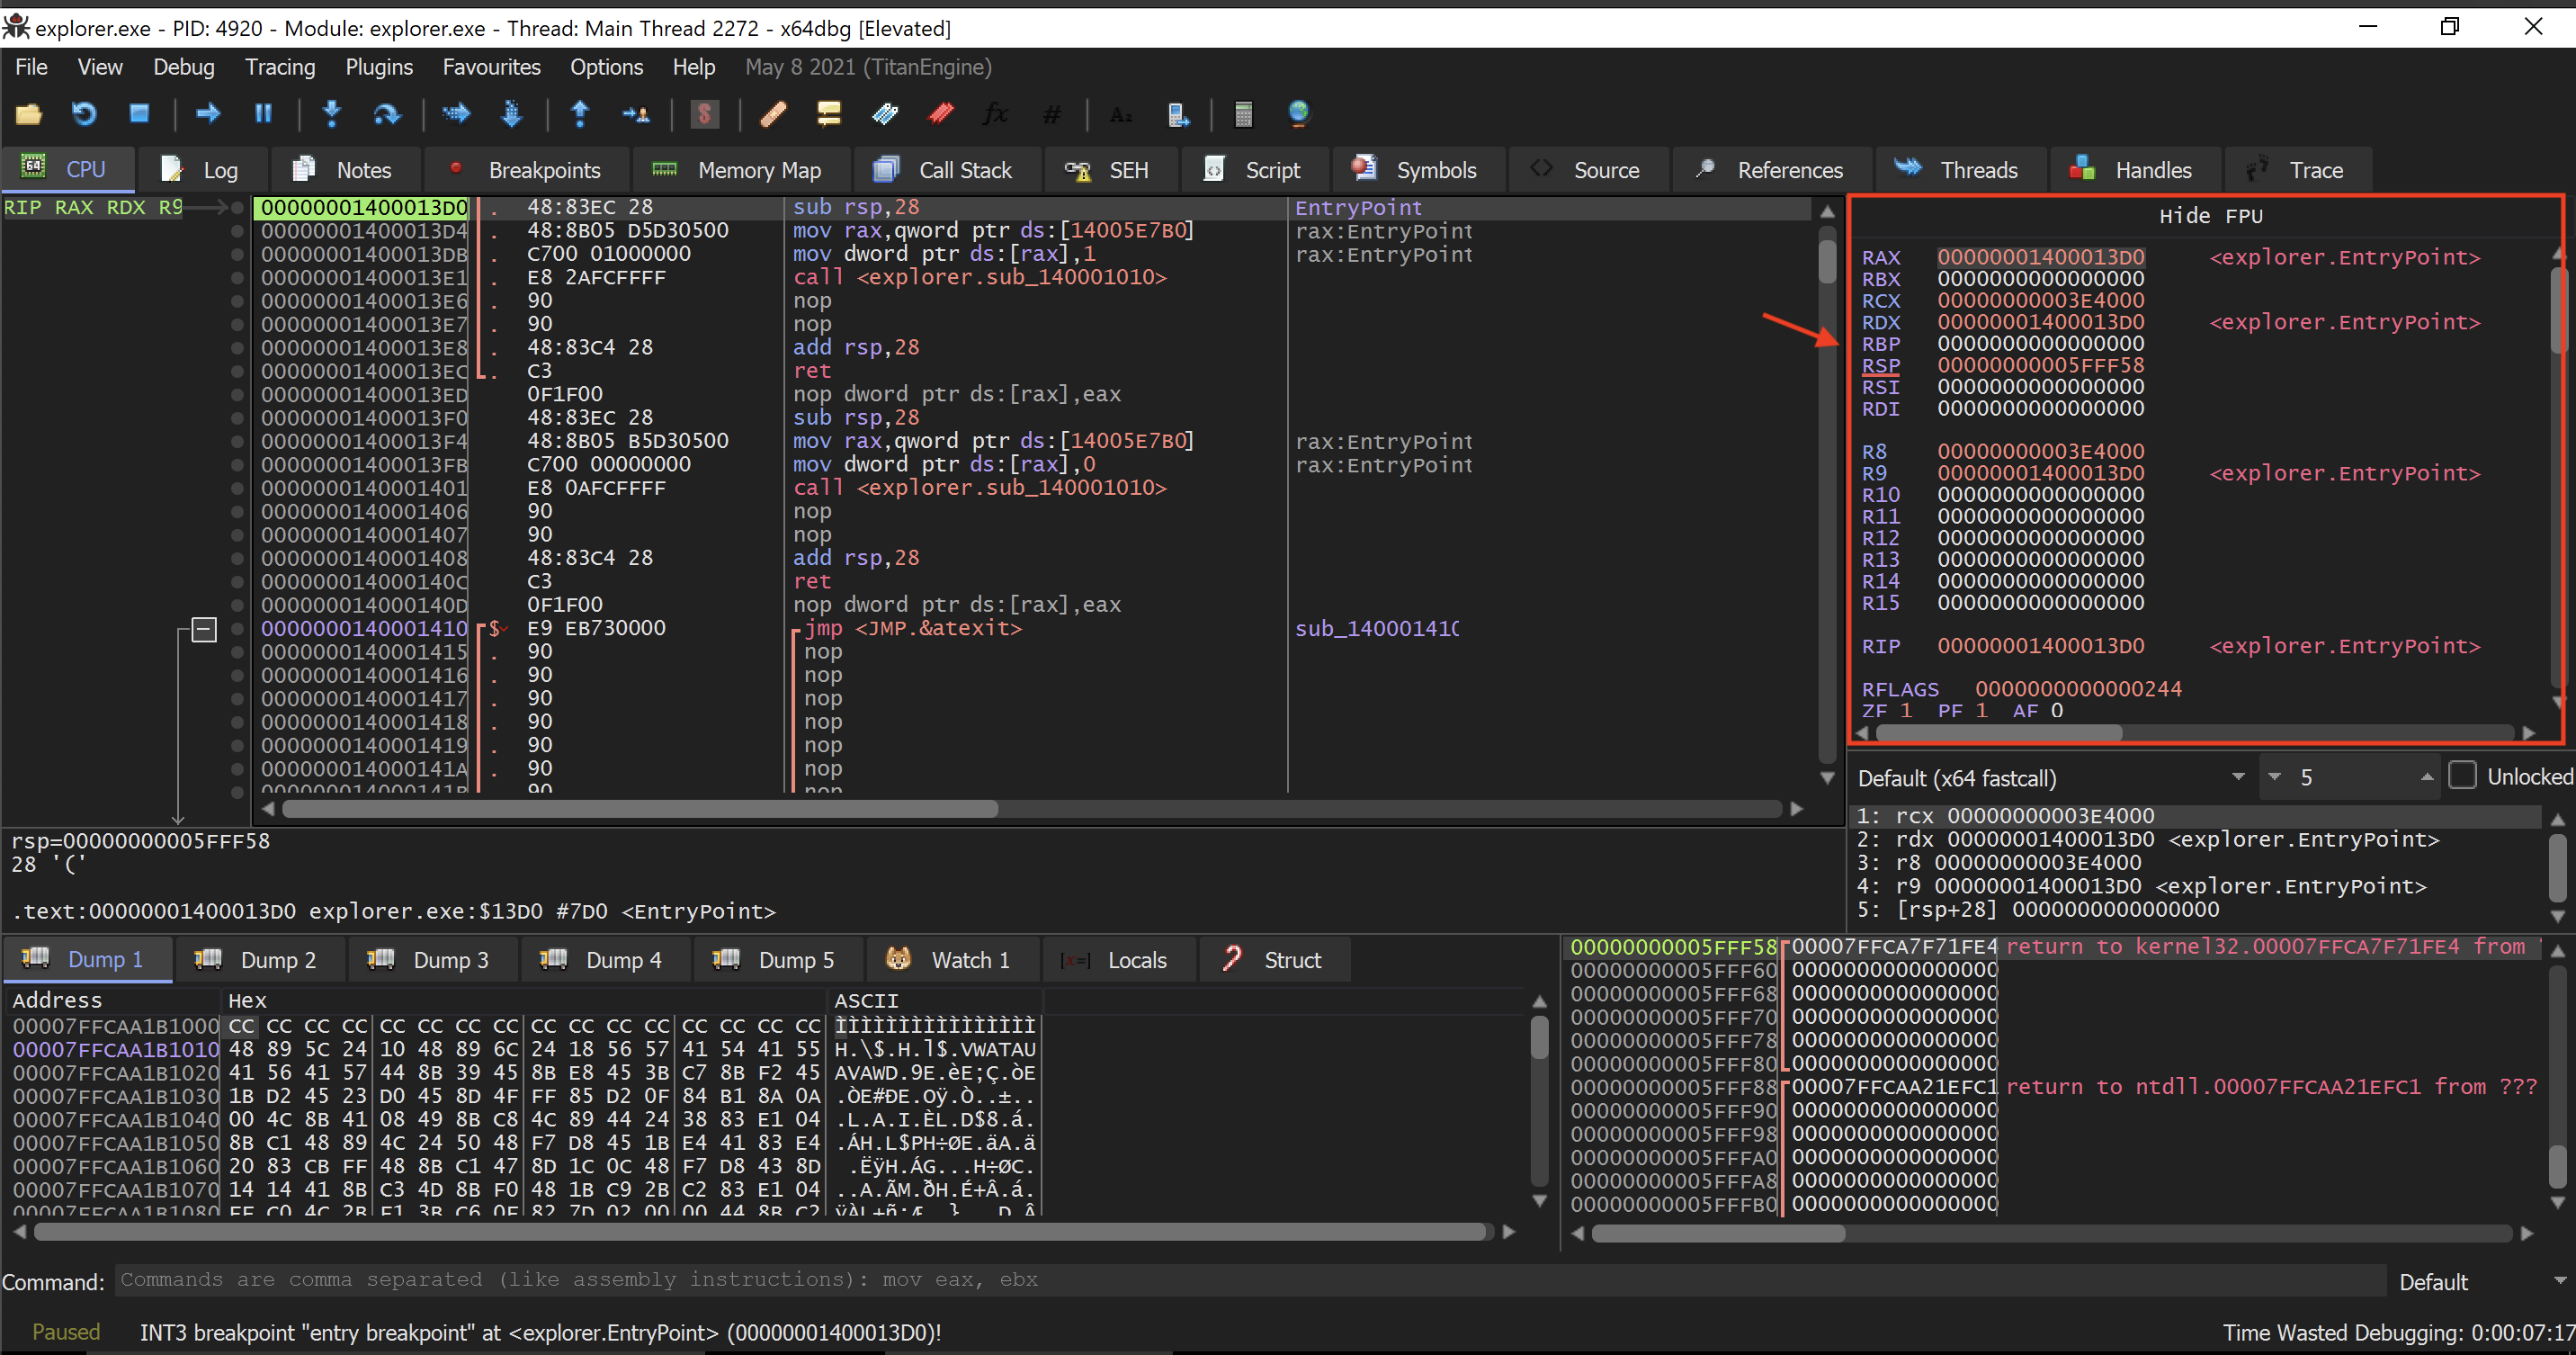
We won't explore every register today, but I want to highlight one specifically, which is RAX. This register typically contains the return value of a function, which will prove useful later.
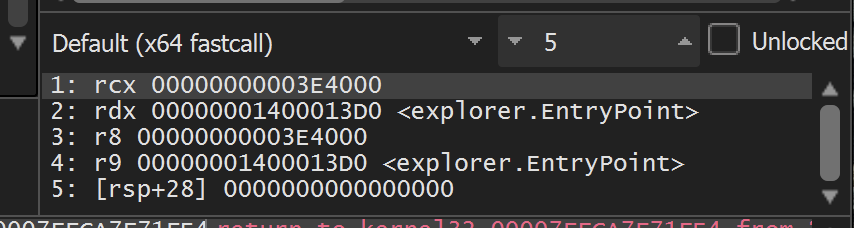
In the center right, this panel displays the function parameters, which are inputs given to a function to assist it in reaching its desired objective. Although we can't dive into all the details of the pertinent instructions.
one Instruction I wish to highlight is the call instruction. You can observe an example of some of them
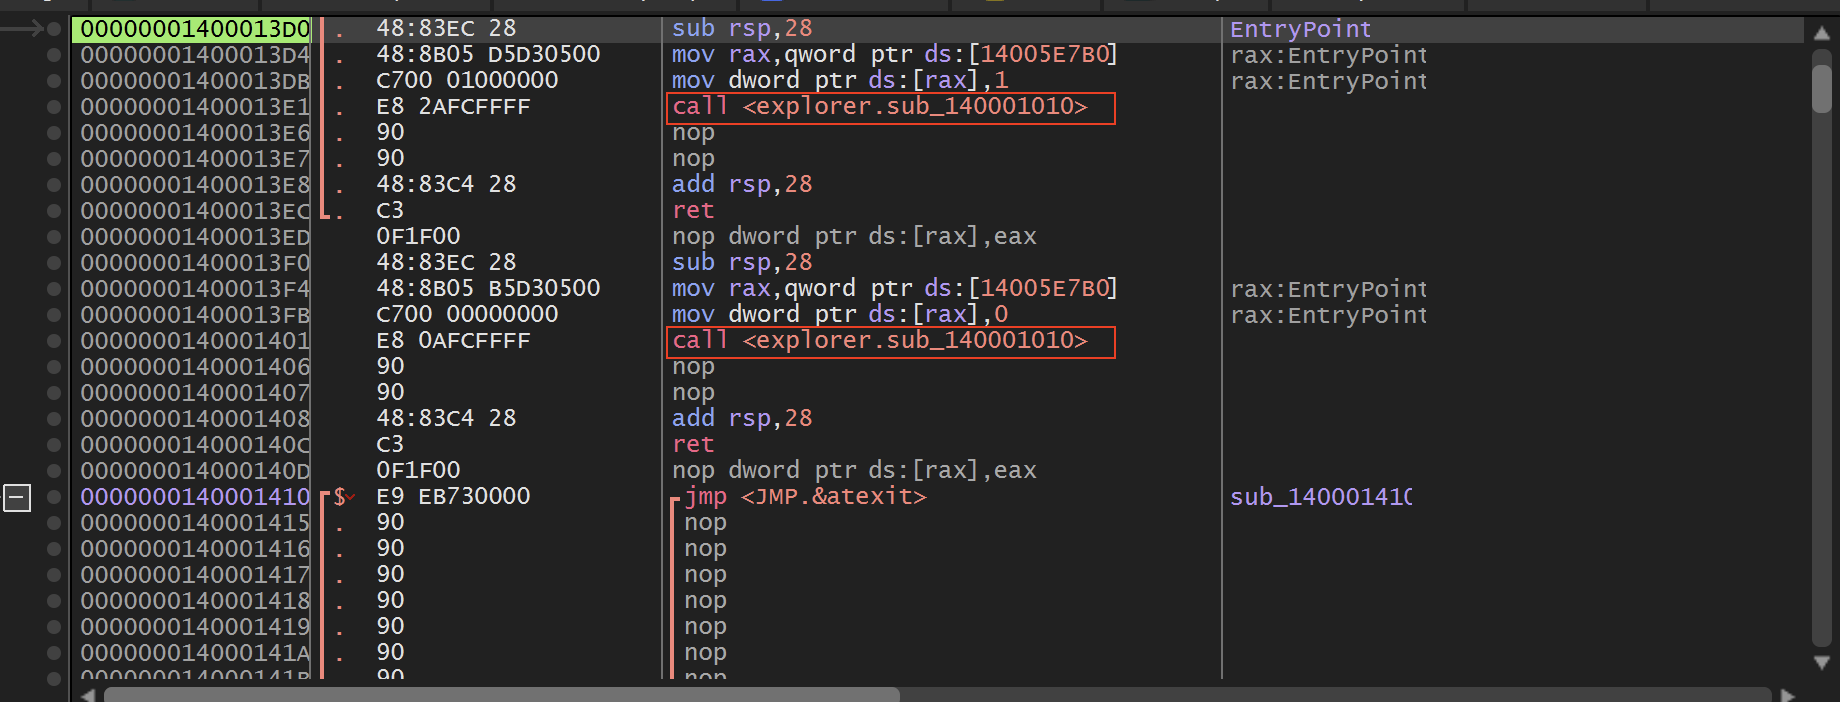
A call instruction performs precisely what it implies. It invokes a function. When execution arrives at a call, the arguments being provided to that function appear on the right in sequence. One represents the first argument, two signifies the second argument, and so forth.
1: rcx 00000000003E4000
2: rdx 00000001400013D0 <explorer.EntryPoint>
3: r8 00000000003E4000
4: r9 00000001400013D0 <explorer.EntryPoint>
5: [rsp+28] 0000000000000000
To the primary objective of this article, which is to identify and monitor any deobfuscation that occurs during the execution of this sample. Numerous approaches exist for tackling this, but I will demonstrate a technique that is effective and doesn't necessitate your comprehension of every command or record presented here.
Therefore, recognize that when malware deobfuscates coder information during execution, it typically requires a location to store that decoded data. This frequently involves assigning memory. On Windows, numerous methods exist for this, but a widely used Windows API for allocating memory is known as virtualalloc. As implied by its name, **virtual allocates memory**.
The documentation outlines the parameters provided to the function along with the output value.
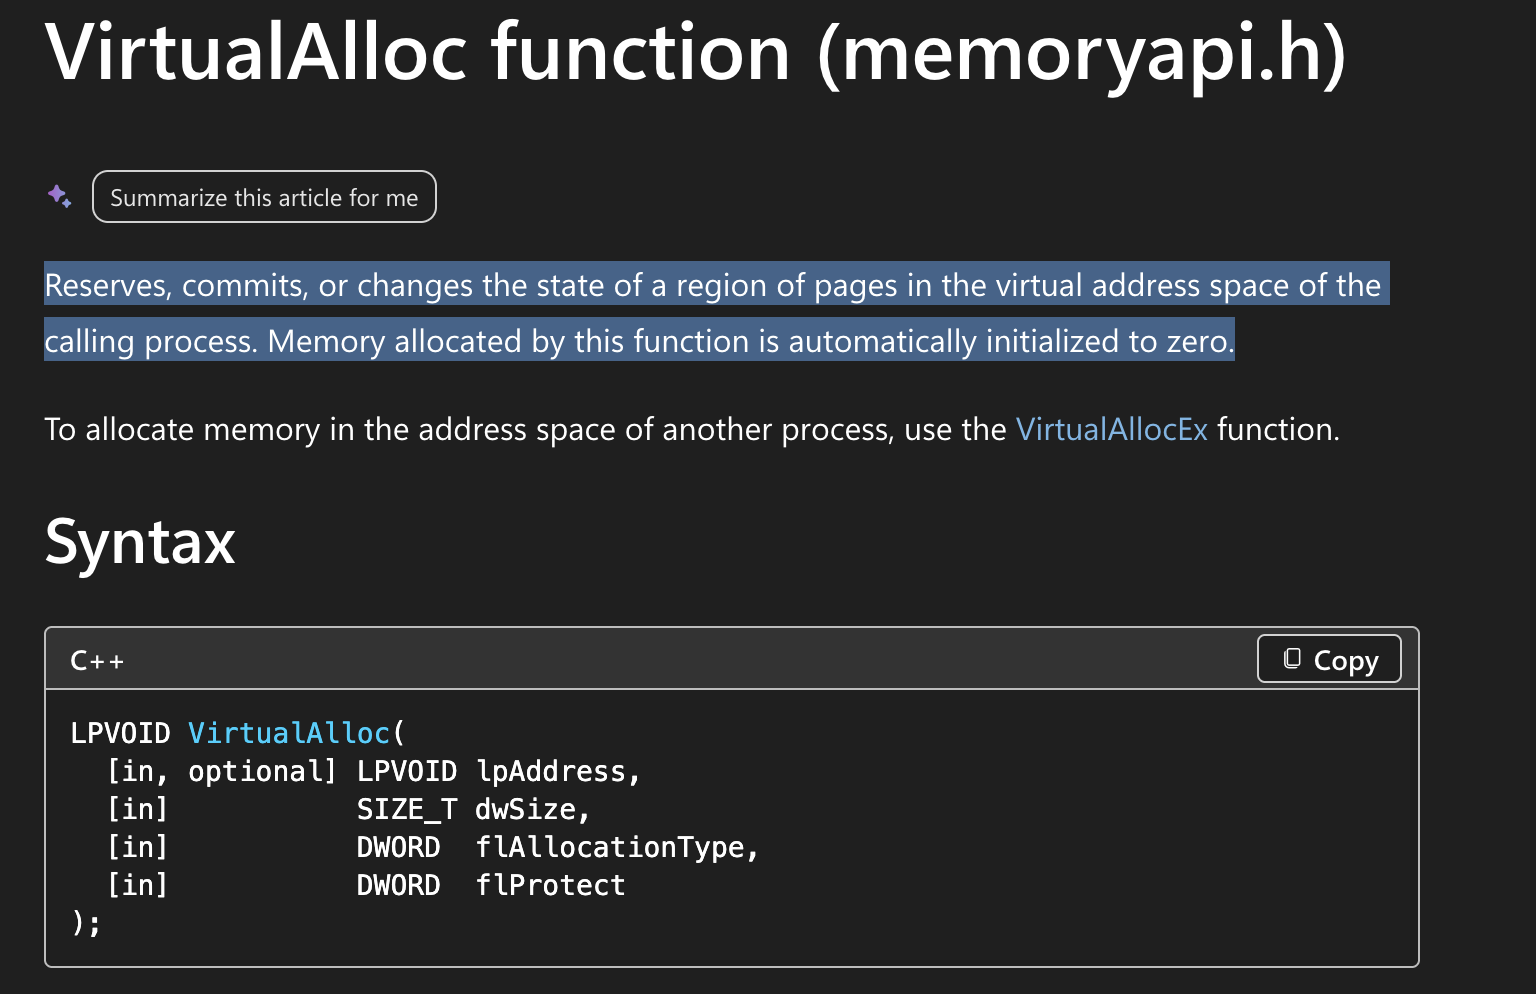
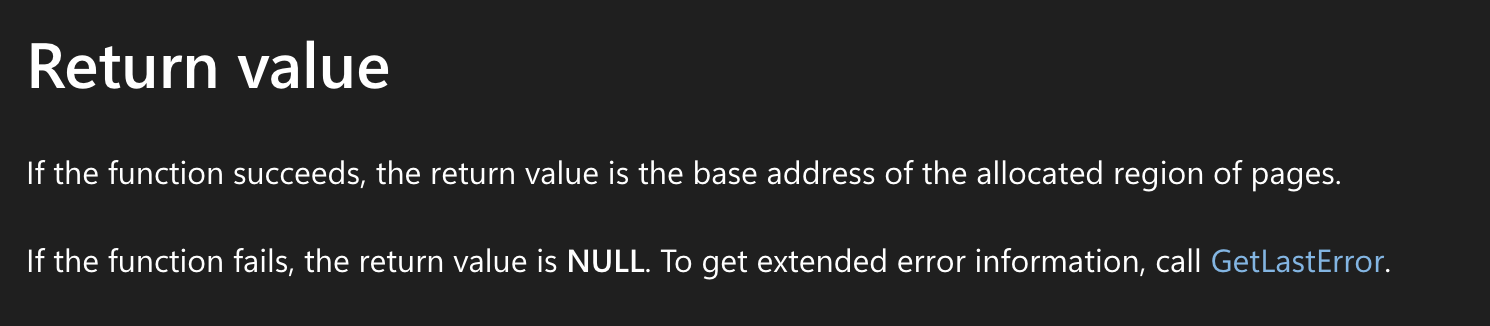
What matters to us is that the return value of virtual is the initial address of the newly allocated memory area. Thus, the query is how can we determine if this program genuinely invokes virtual during its execution? To address that, we'll establish what is referred to as a breakpoint. A breakpoint instructs the debugger to allow the program to run until a designated point, then halt execution when that point is attained. In this situation, we intend to halt execution whenever virtual is invoked. At the bottom in the command input field, I will type bp for breakpoint followed by the API where I want to place the breakpoint, which in this instance is virtual.
bp VirtualAlloc 
I will proceed to press enter on my keyboard. You can now observe that a breakpoint has indeed been set.
At this moment, keep in mind that we remain halted at the program's starting point. Let’s execute the program and observe the outcome. I'm heading to the menu at the top under debug and selecting run to proceed with executing the program.
When I run it, you'll notice that the process has now halted, as shown in the bottom left. If we examine our paused position, we will notice references to virtualAlloc found in kernel32.dll.
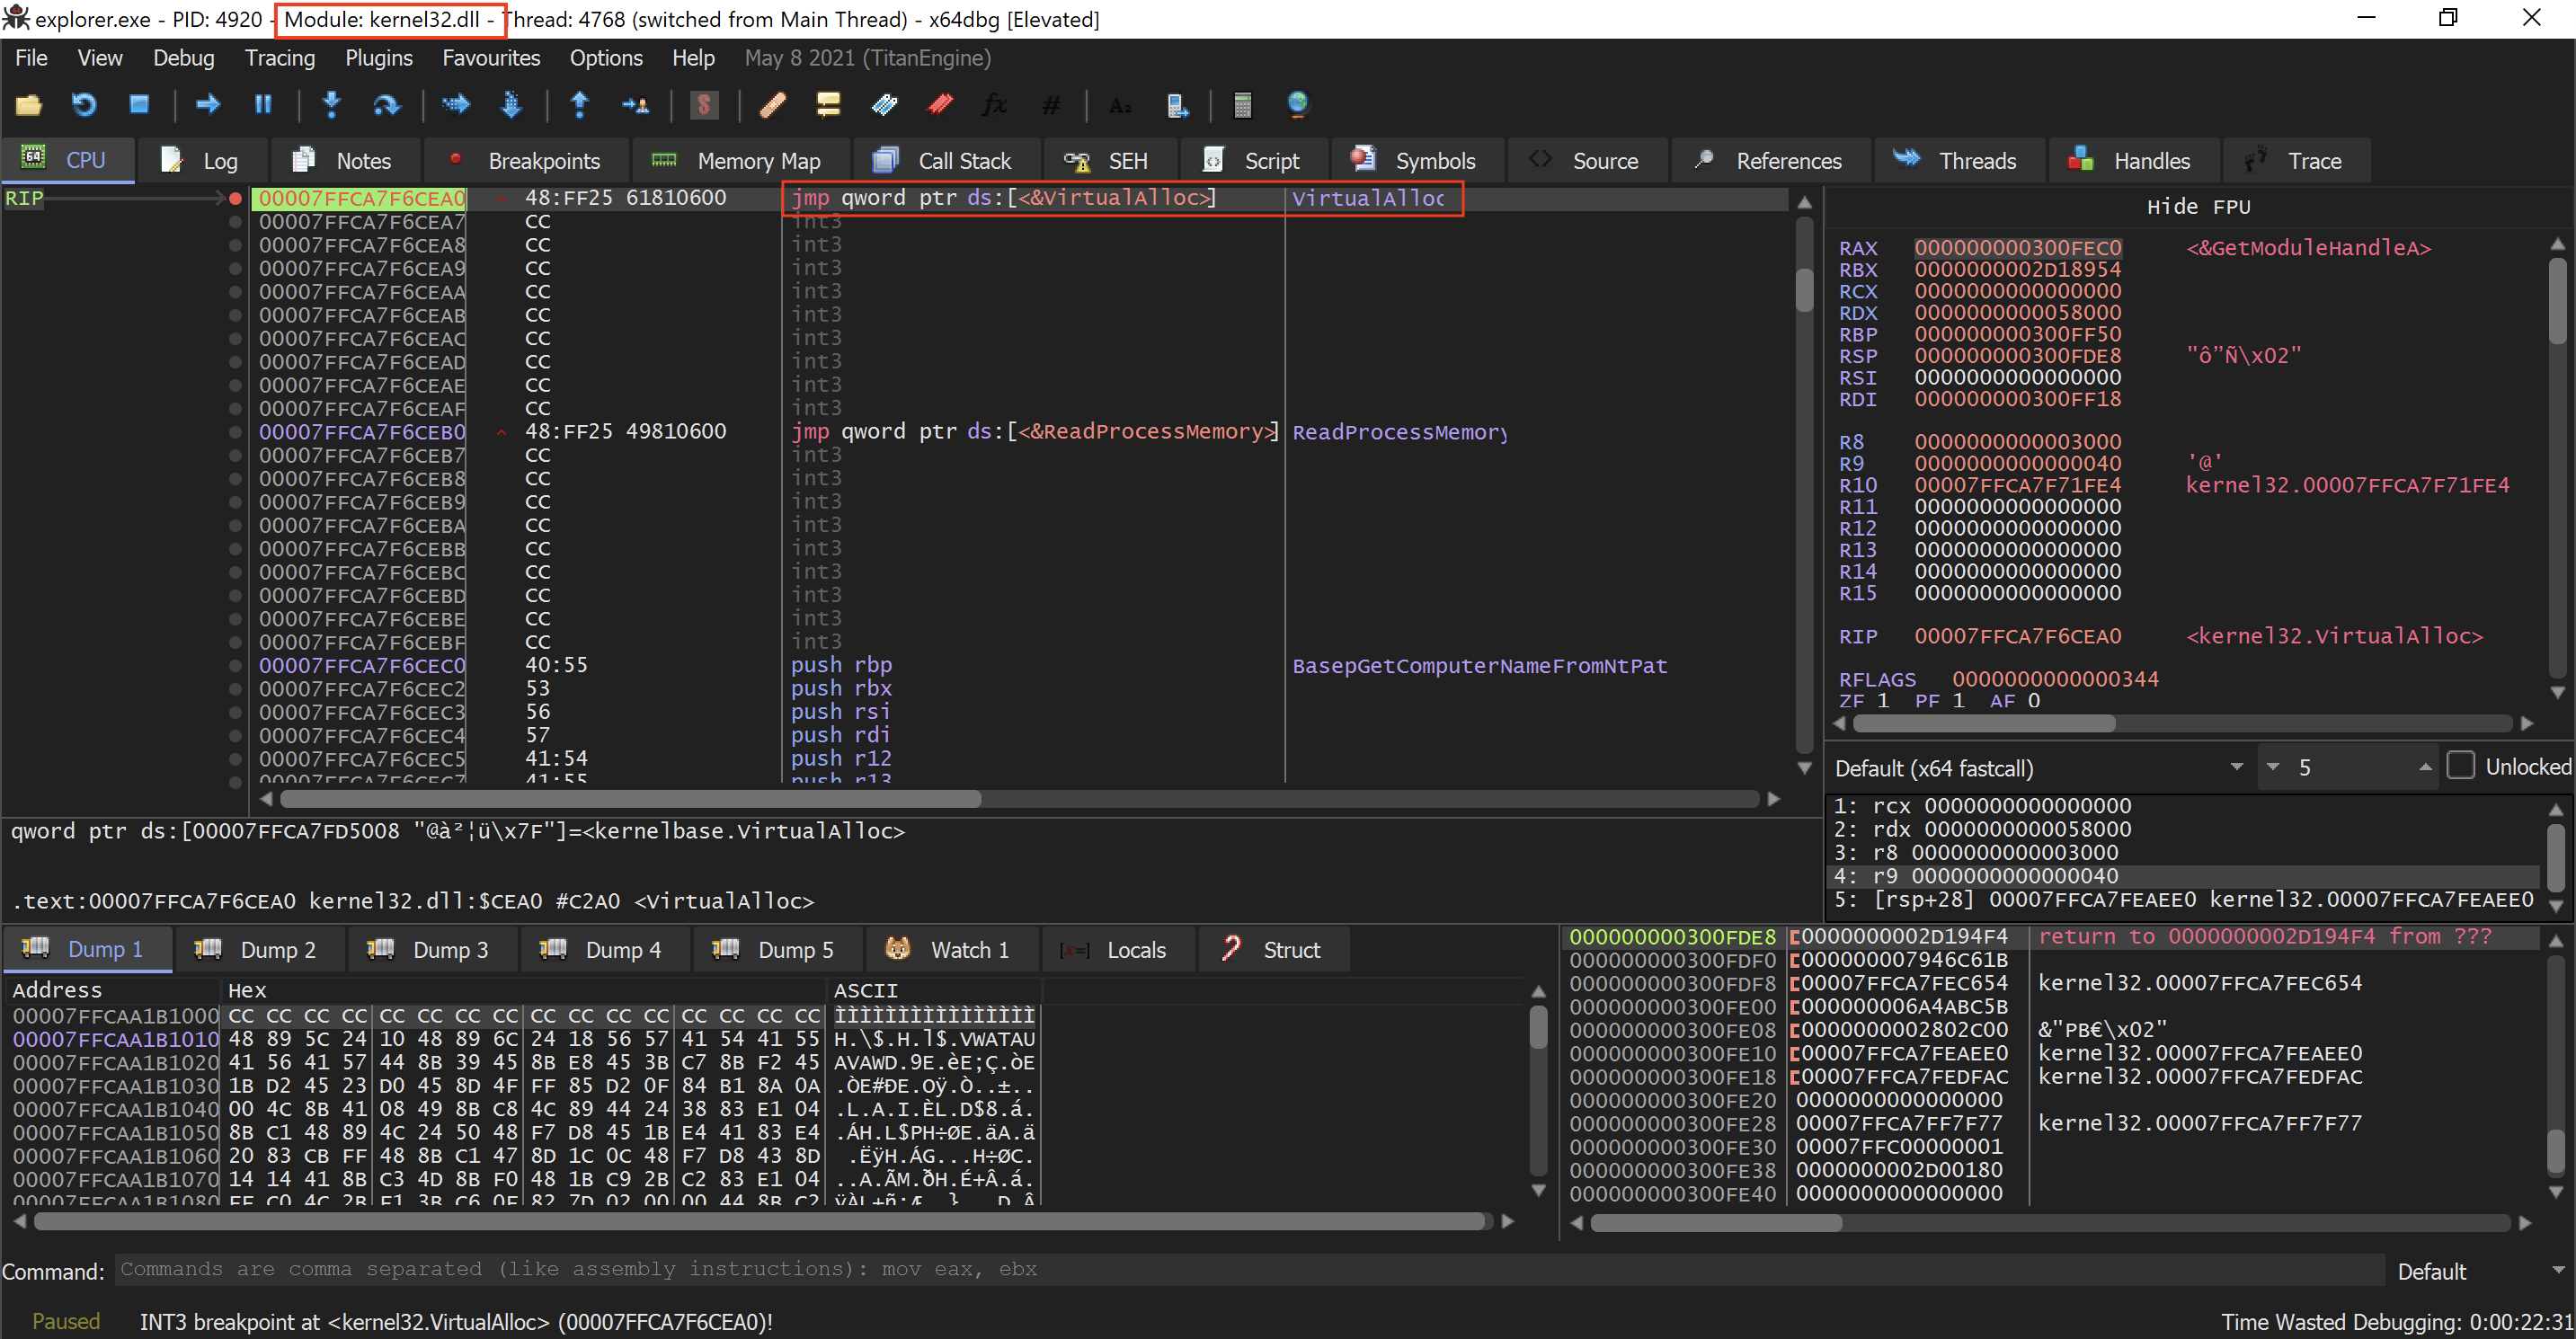
Let’s examine the arguments provided to this function. Those can be seen on the right side, right down here as I previously stated. I won't go through each parameter in detail, but I want to highlight the fourth one, which has a hexadecimal value of 40.
1: rcx 0000000000000000
2: rdx 0000000000058000
3: r8 0000000000003000
4: r9 0000000000000040
5: [rsp+28] 00007FFCA7FEAEE0 kernel32.00007FFCA7FEAEE0
Referring back to the Microsoft documentation, you will notice that this fourth parameter is named FL protect and it denotes the memory permissions assigned to the newly allocated area. The documentation states that this parameter indicates a memory protection constant.
| # | Register | Value | VirtualAlloc Parameter | Explanation |
|---|---|---|---|---|
| 1 | RCX | 0x0000000000000000 | lpAddress | Let the system choose the allocation address |
| 2 | RDX | 0x0000000000058000 | dwSize | Amount of memory to allocate (~360 KB) |
| 3 | R8 | 0x0000000000003000 | flAllocationType | MEM_COMMIT + MEM_RESERVE Reserve AND commit this memory now |
| 4 | R9 | 0x0000000000000040 | flProtect | PAGE_EXECUTE_READWRITE (0x40) = memory can be executed, read, and written |
The essential term here is perform. This combination frequently suggests that executable content could be written to this area of memory. What we are concerned with now is the return value. As virtualAlloc provides the initial address of the allocated area, after this function completes, that address will be saved in the rax register.
So I'm going to allow VirtualAlloc return. By returning to the debug menu and selecting execute until return.
You'll notice we've kept running, and we are currently paused at a return instruction, typically the final instruction at the end of a function.
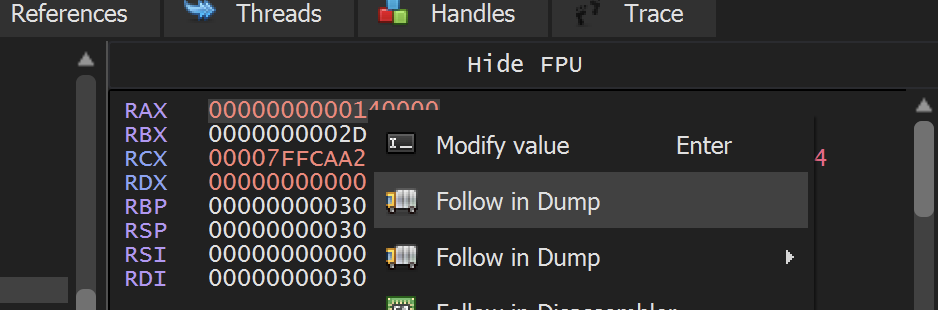
Now if we examine RAX, located on the right side, we observe that it is red due to a recent change. The address 0000000000140000, held in the RAX register, marks the beginning of the newly allocated memory area.
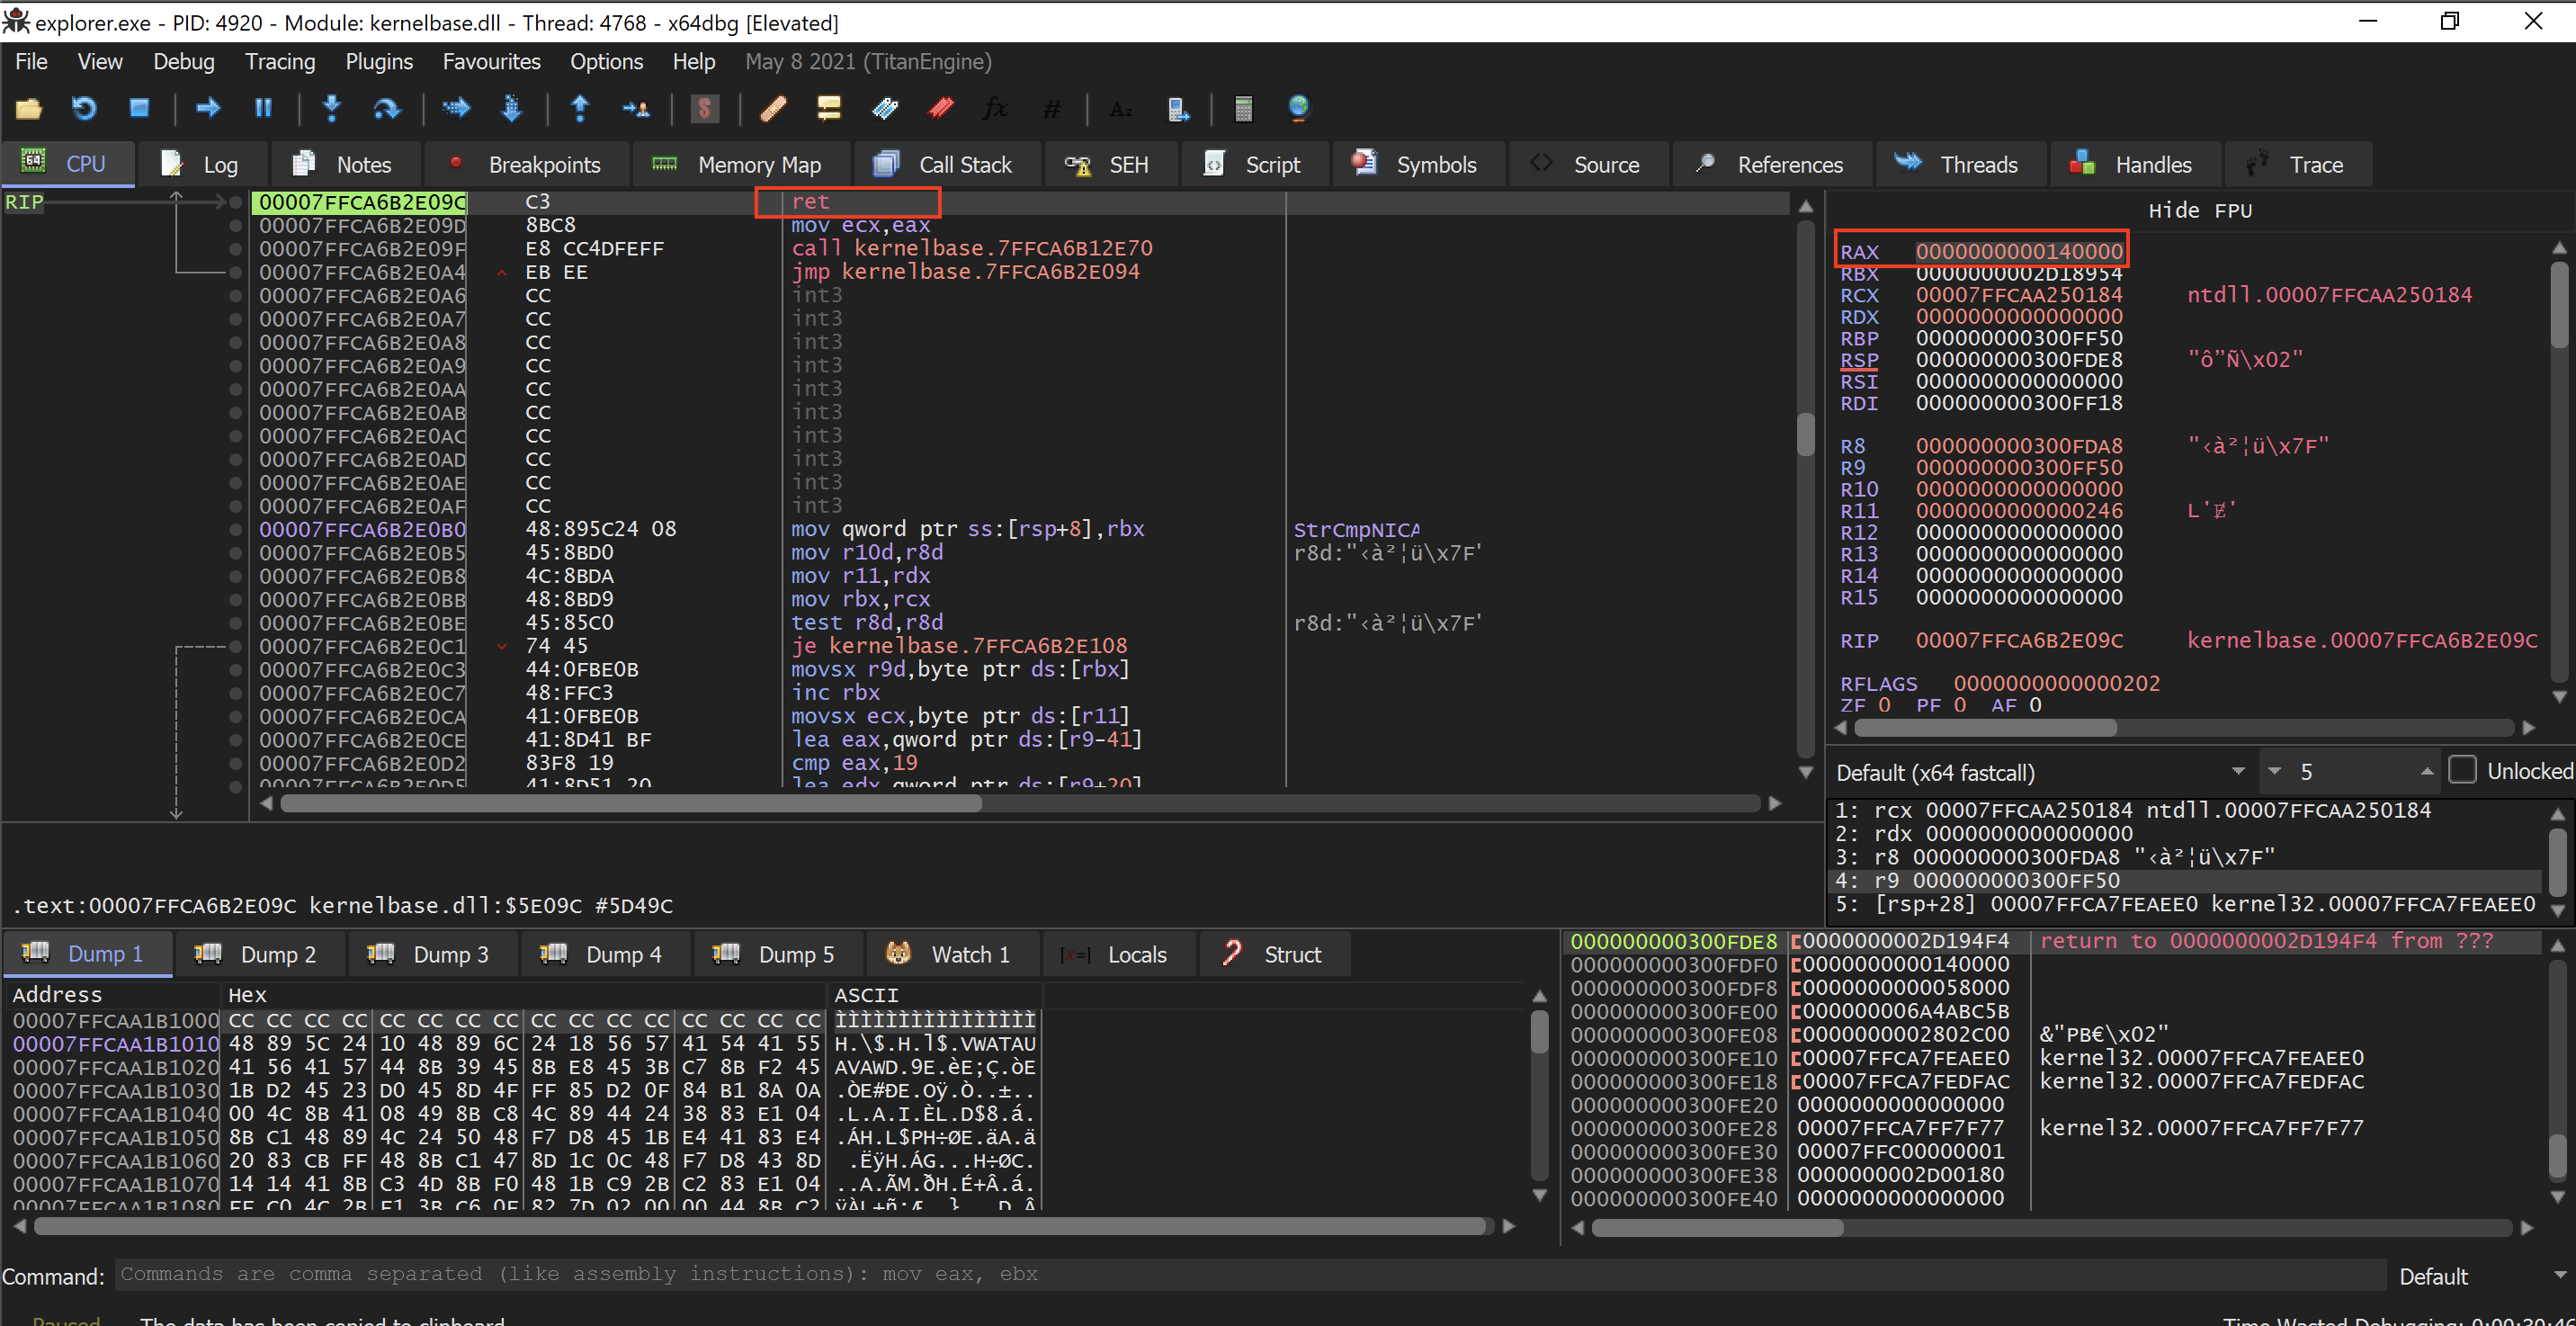
Now, let's examine that address and dump it into one of the dump windows we discussed previously. To achieve that, I'll click over here. I'll particularly right-click. I'll then select follow in dump to essentially track that address held in RAX within one of the dump windows.
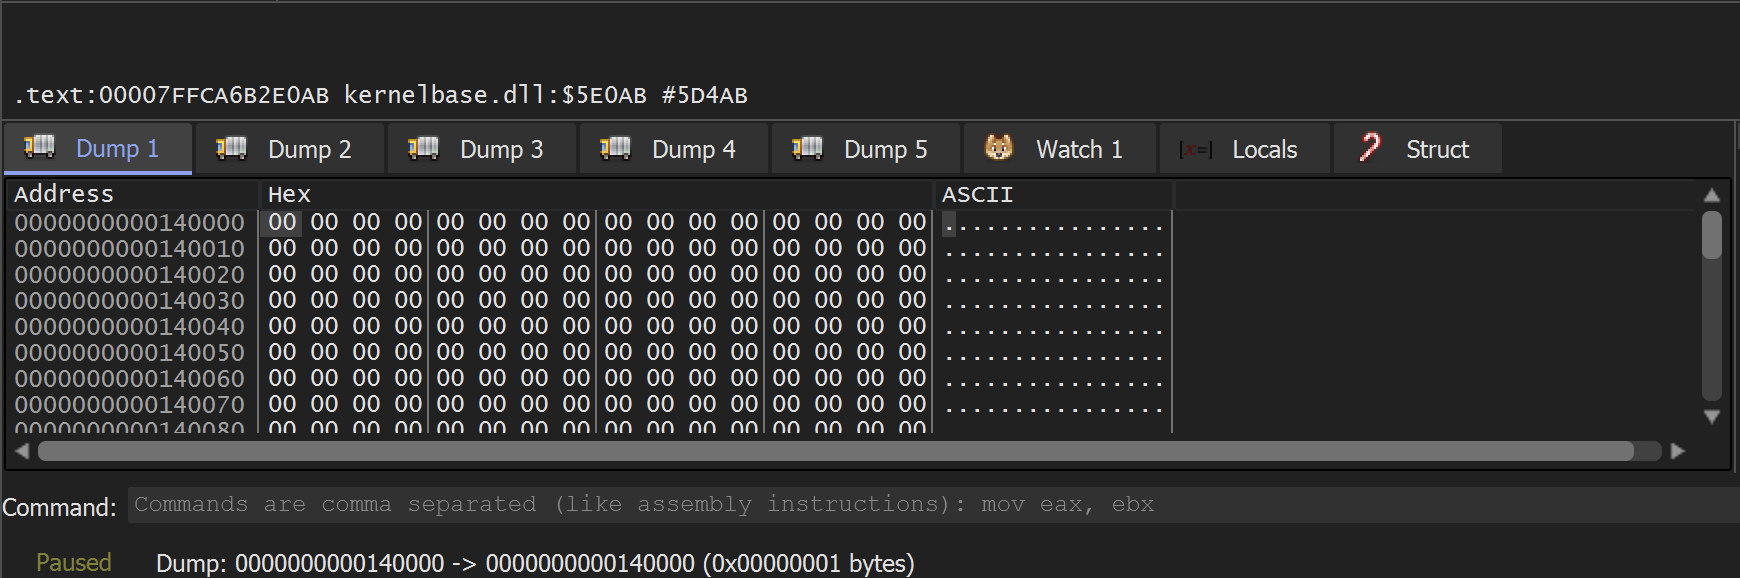
You can observe in the lower left corner that we are currently at dump number one. The address mentioned here, 140000, matches the same address observed in RAX, indicating this is the memory area currently under examination. At this moment, there is nothing noteworthy here, which is, in fact, anticipated. By default, virtualAlloc provides memory that is initialized to zero.
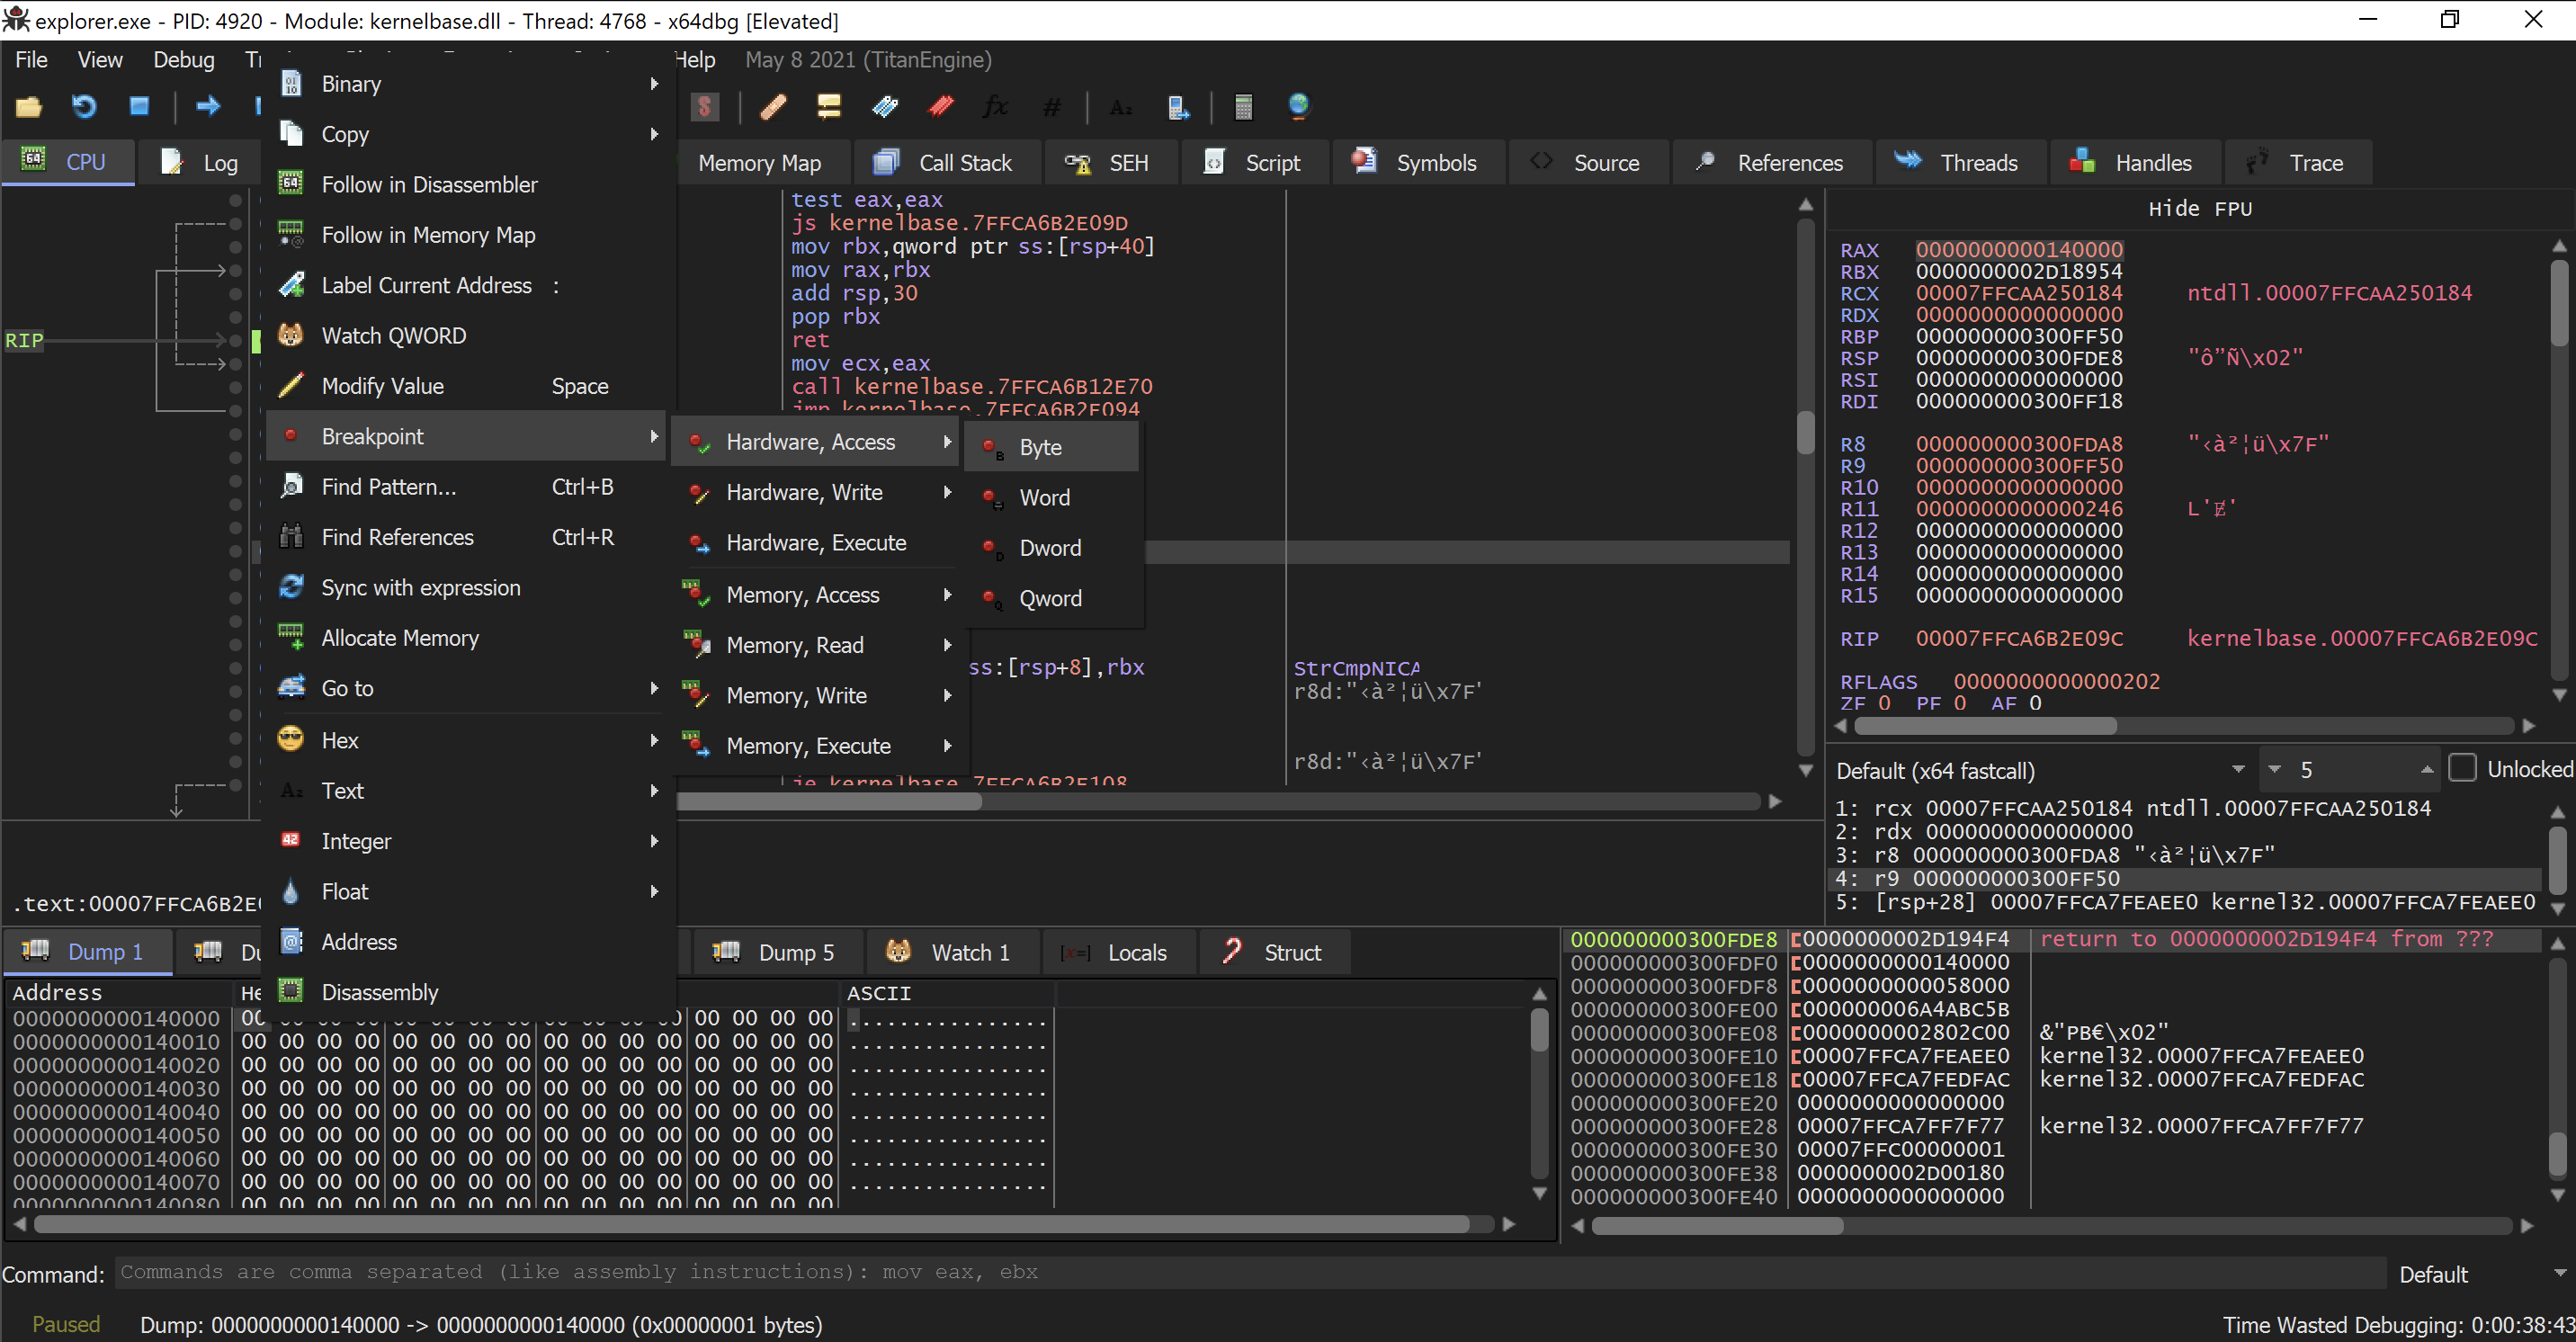
Here is where we move forward. I aim to establish a hardware breakpoint at the start of this memory section. A hardware breakpoint is more enduring than the virtual breakpoint we established previously. Establishing a hardware breakpoint is especially useful when handling deobfuscation.
I’ll now right-click on the first byte in the dump number one window. I will then access the context menu, select breakpoint, and choose hardware access, which instructs the debugger to halt whenever this byte in this memory area is accessed, regardless of whether it is being read or written. I will proceed to select bite. This will enable us to capture the precise moment when this memory begins to be utilized.
I will proceed to resume execution by selecting debug and then I will choose run again. The debugger is observed to pause once more.
In the lower left corner, it indicates that execution is halted and refers to the hardware breakpoint we just set.
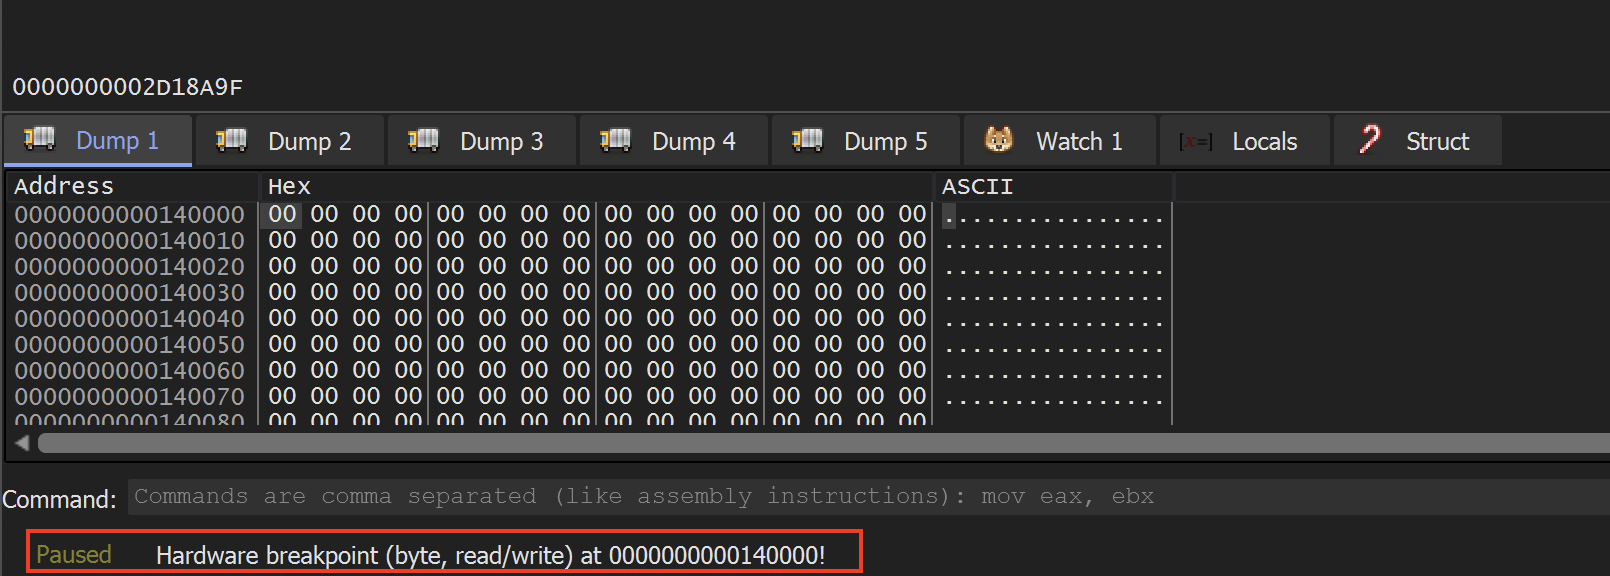
At first look, it seems like nothing is different, correct? Zeros are still visible in the dump window however, stopping at this hardware breakpoint indicates that the code is beginning to engage with this memory area.
Now Just step over few times. In my case it’s 2 times. you’ll see the rax changed again.
Follow the RAX in memory dump.
Currently, in the dump window, we're examining a different address 0000000002D00180. At that address, we observe the bytes 50 45, which relate to the characters PE, as indicated in the comments and also illustrated in the ASCII depiction of those bytes.
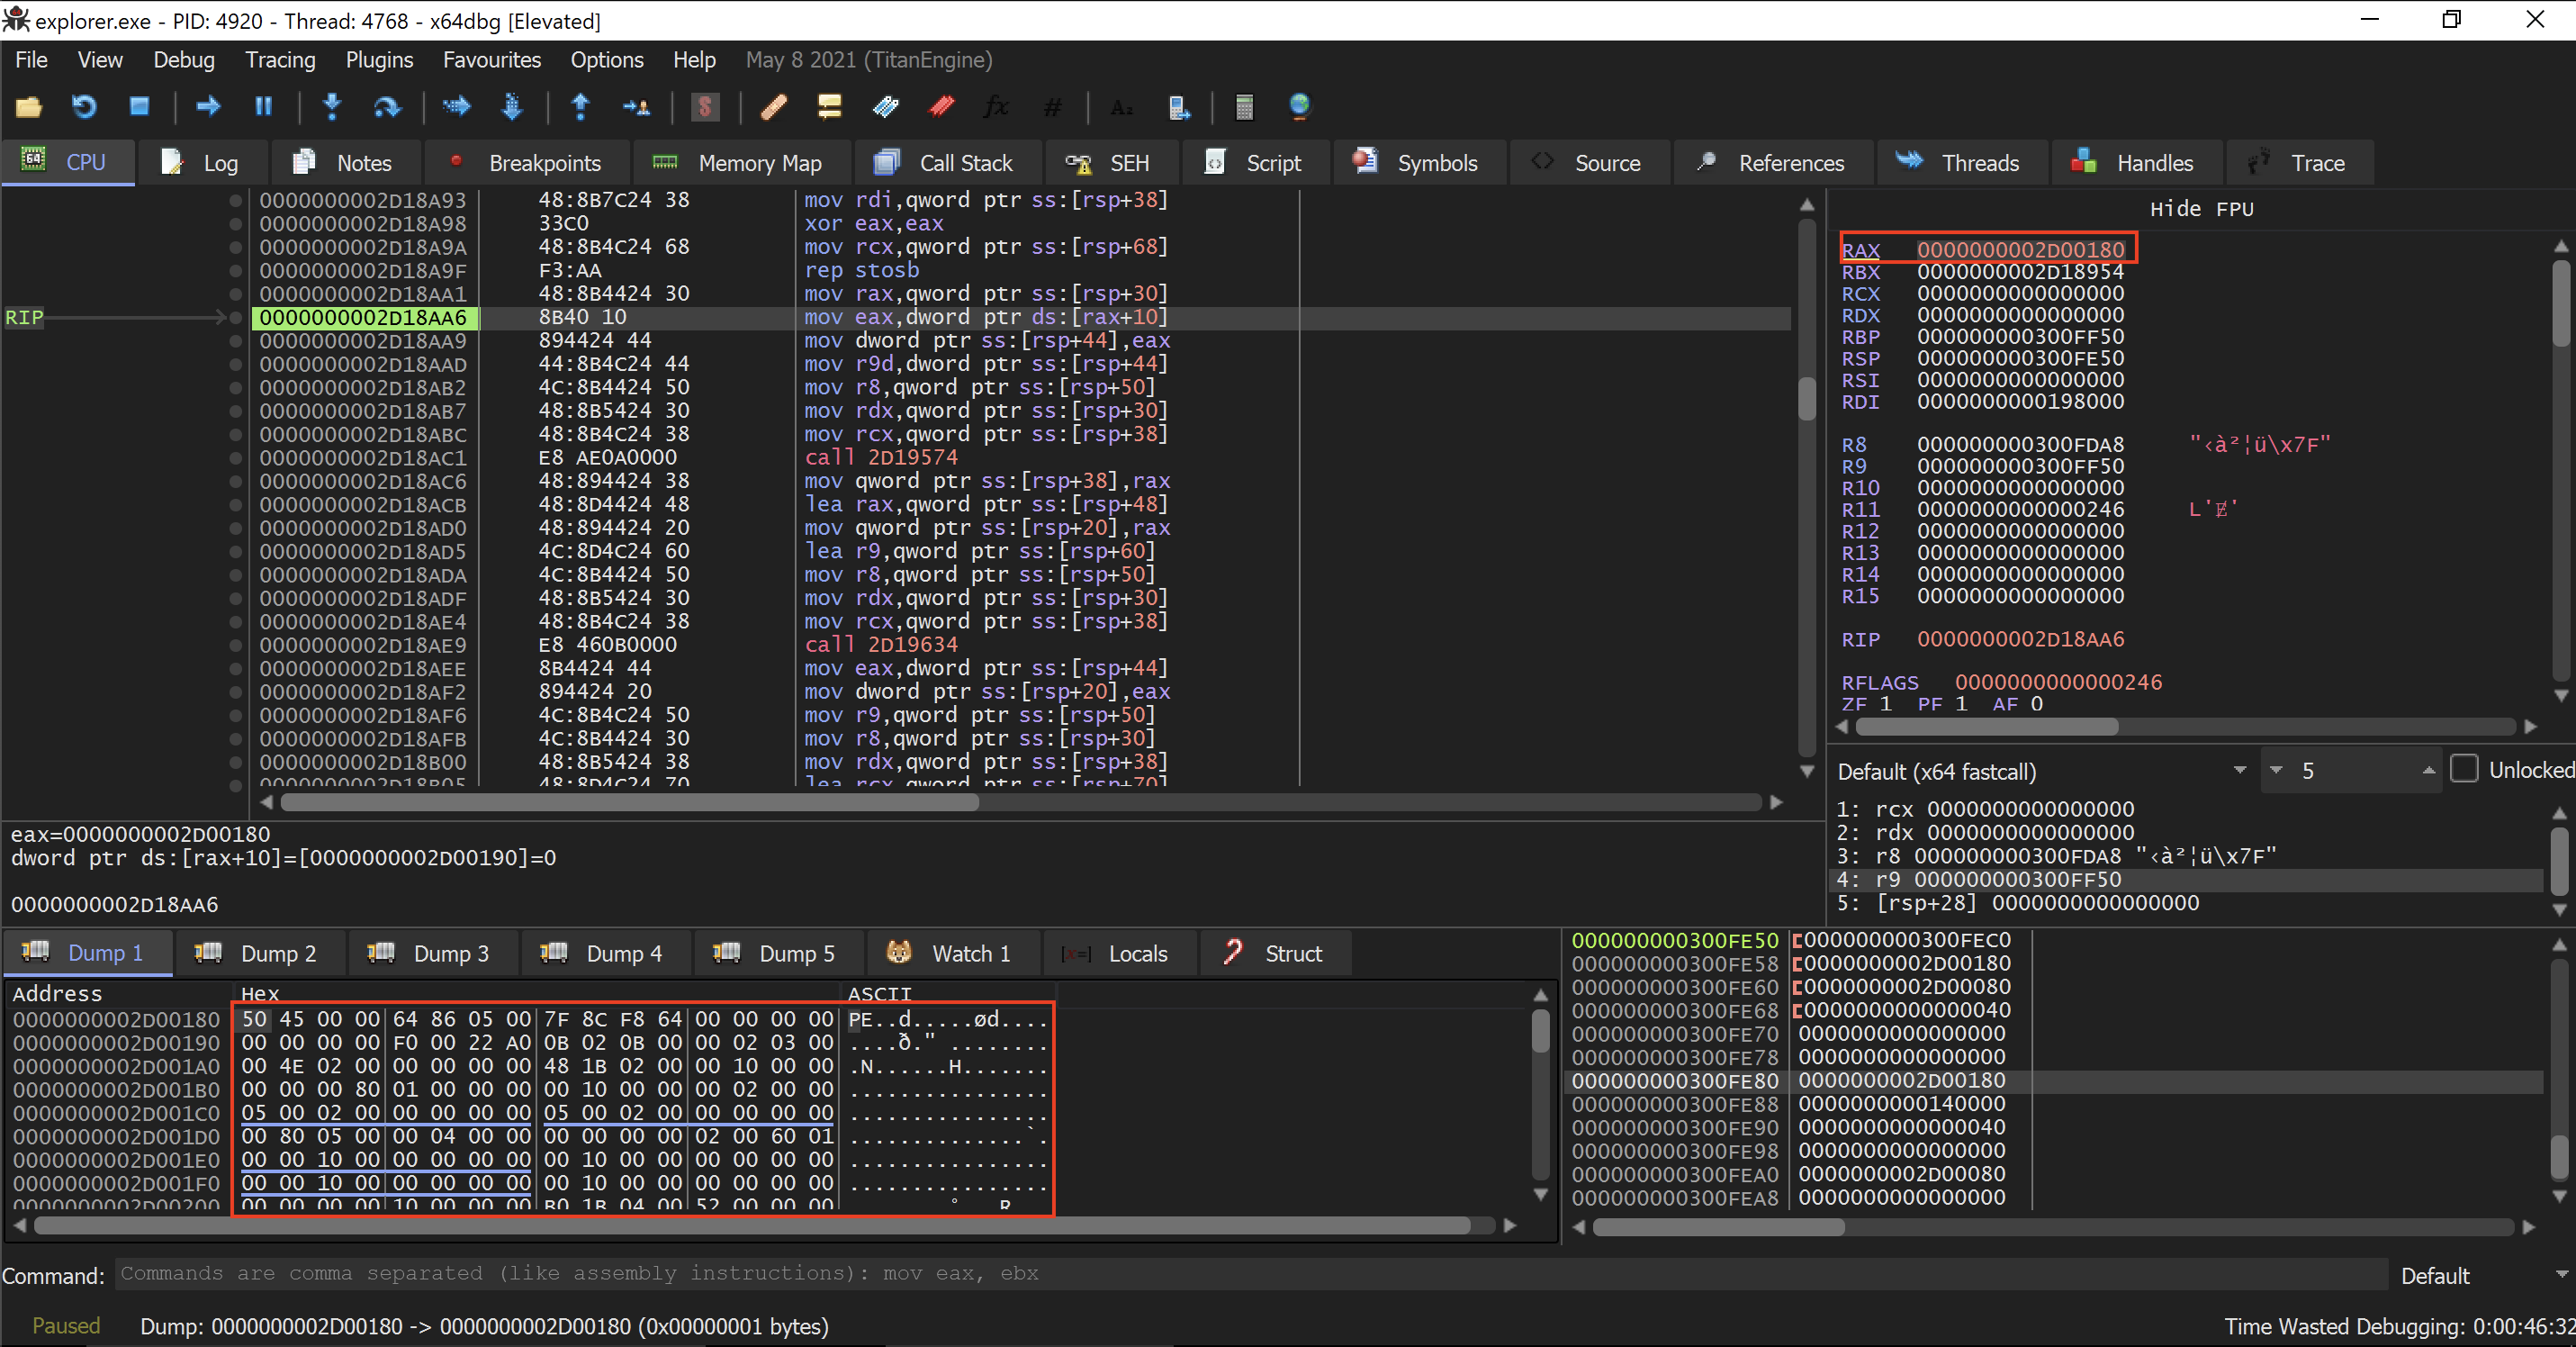
If I scroll up slightly in the dump window, I can also notice a mention of the well-known message this program cannot be run in DOS mode, which usually shows up at the start of a Windows executable.
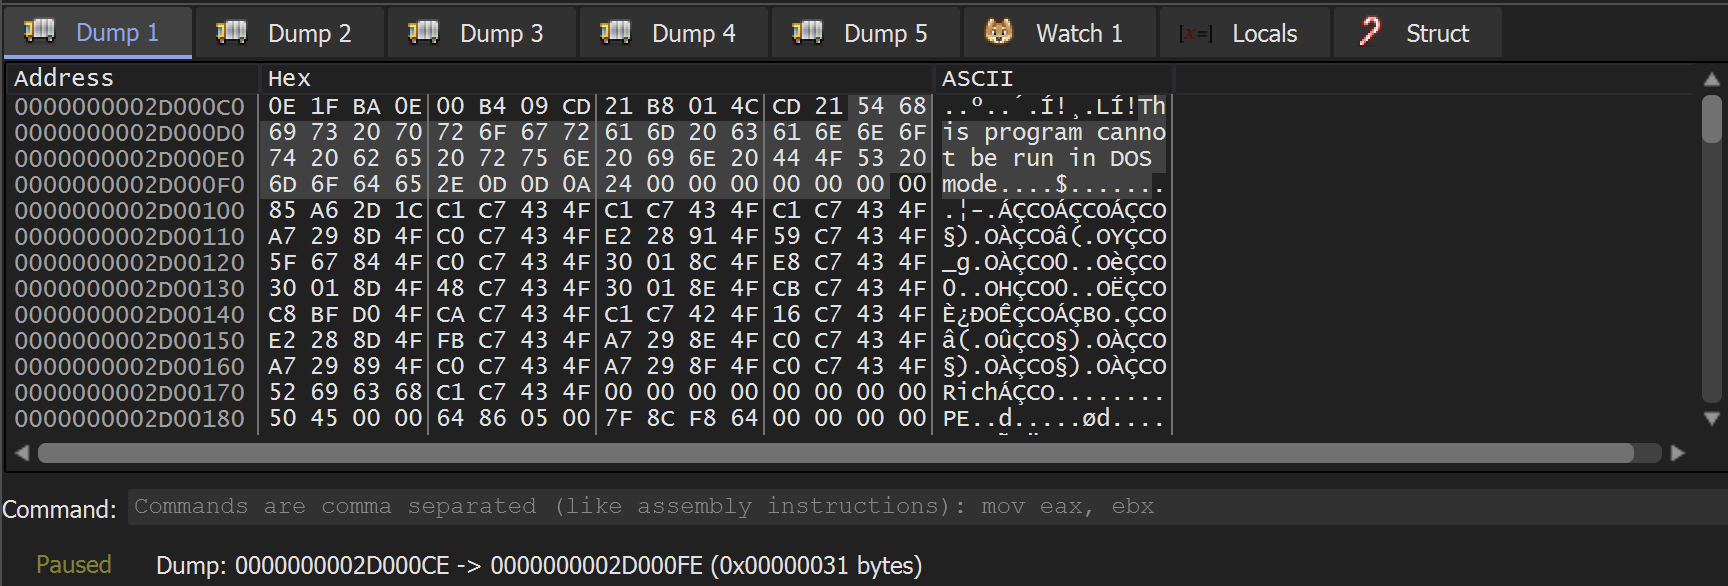
If I keep scrolling up before that, I will come across a reference to the MZ bytes, which are generally the initial bytes of a Windows executable. This serves as a solid sign that we have detected a Windows .exe in memory.
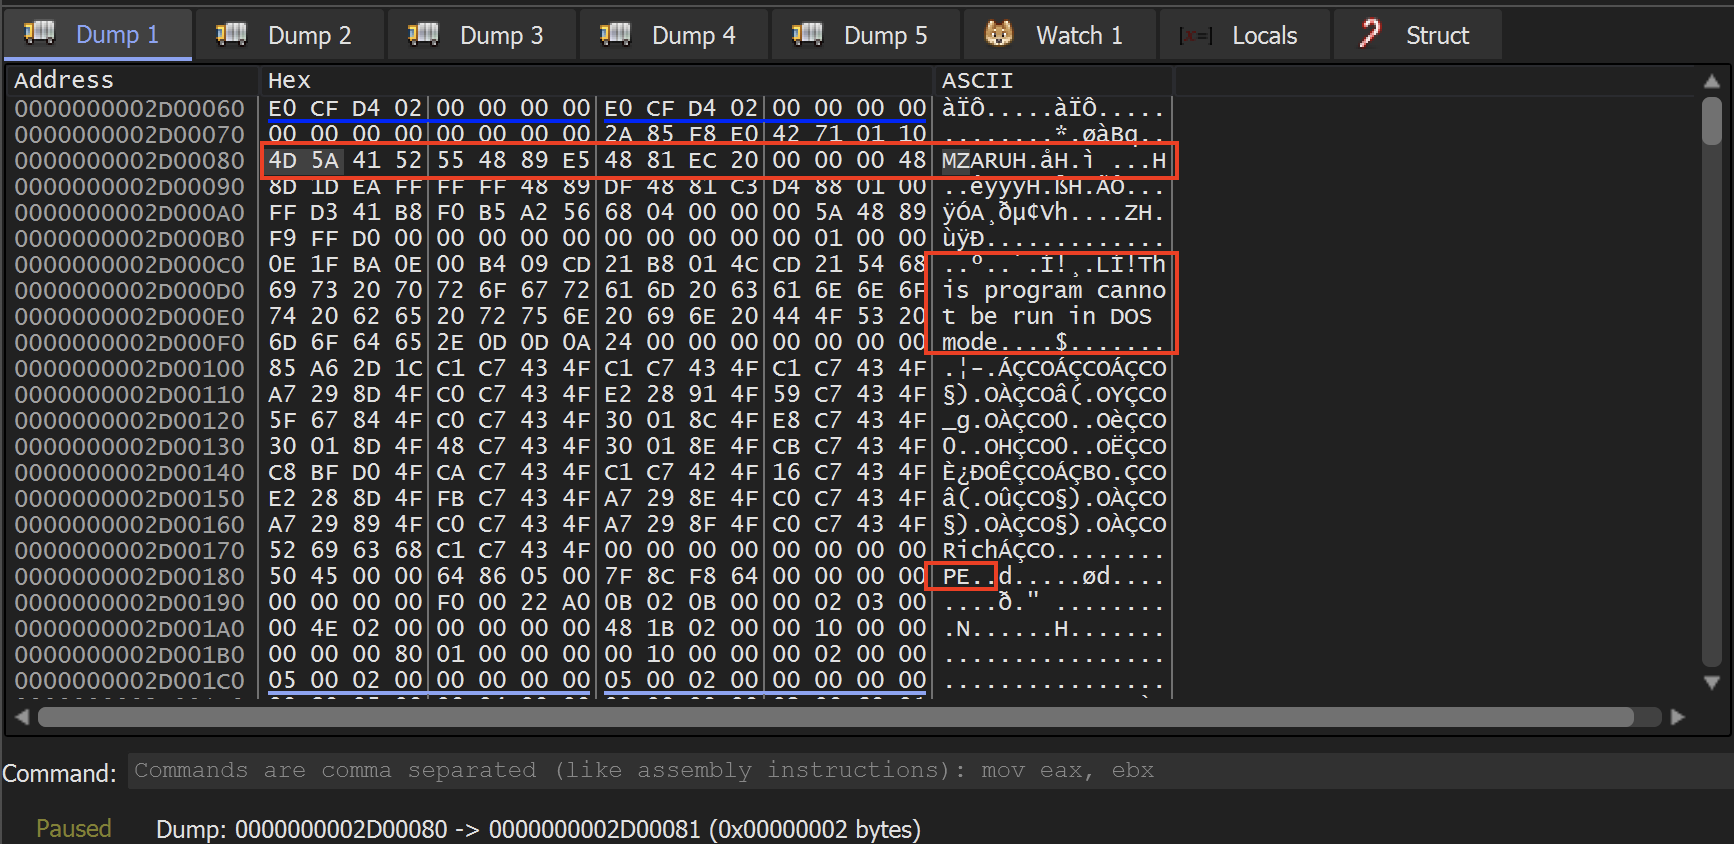
Next, we need to save this executable to the disk for additional examination. To achieve that, I'll simply right-click anywhere within this memory area and select follow in memory map.
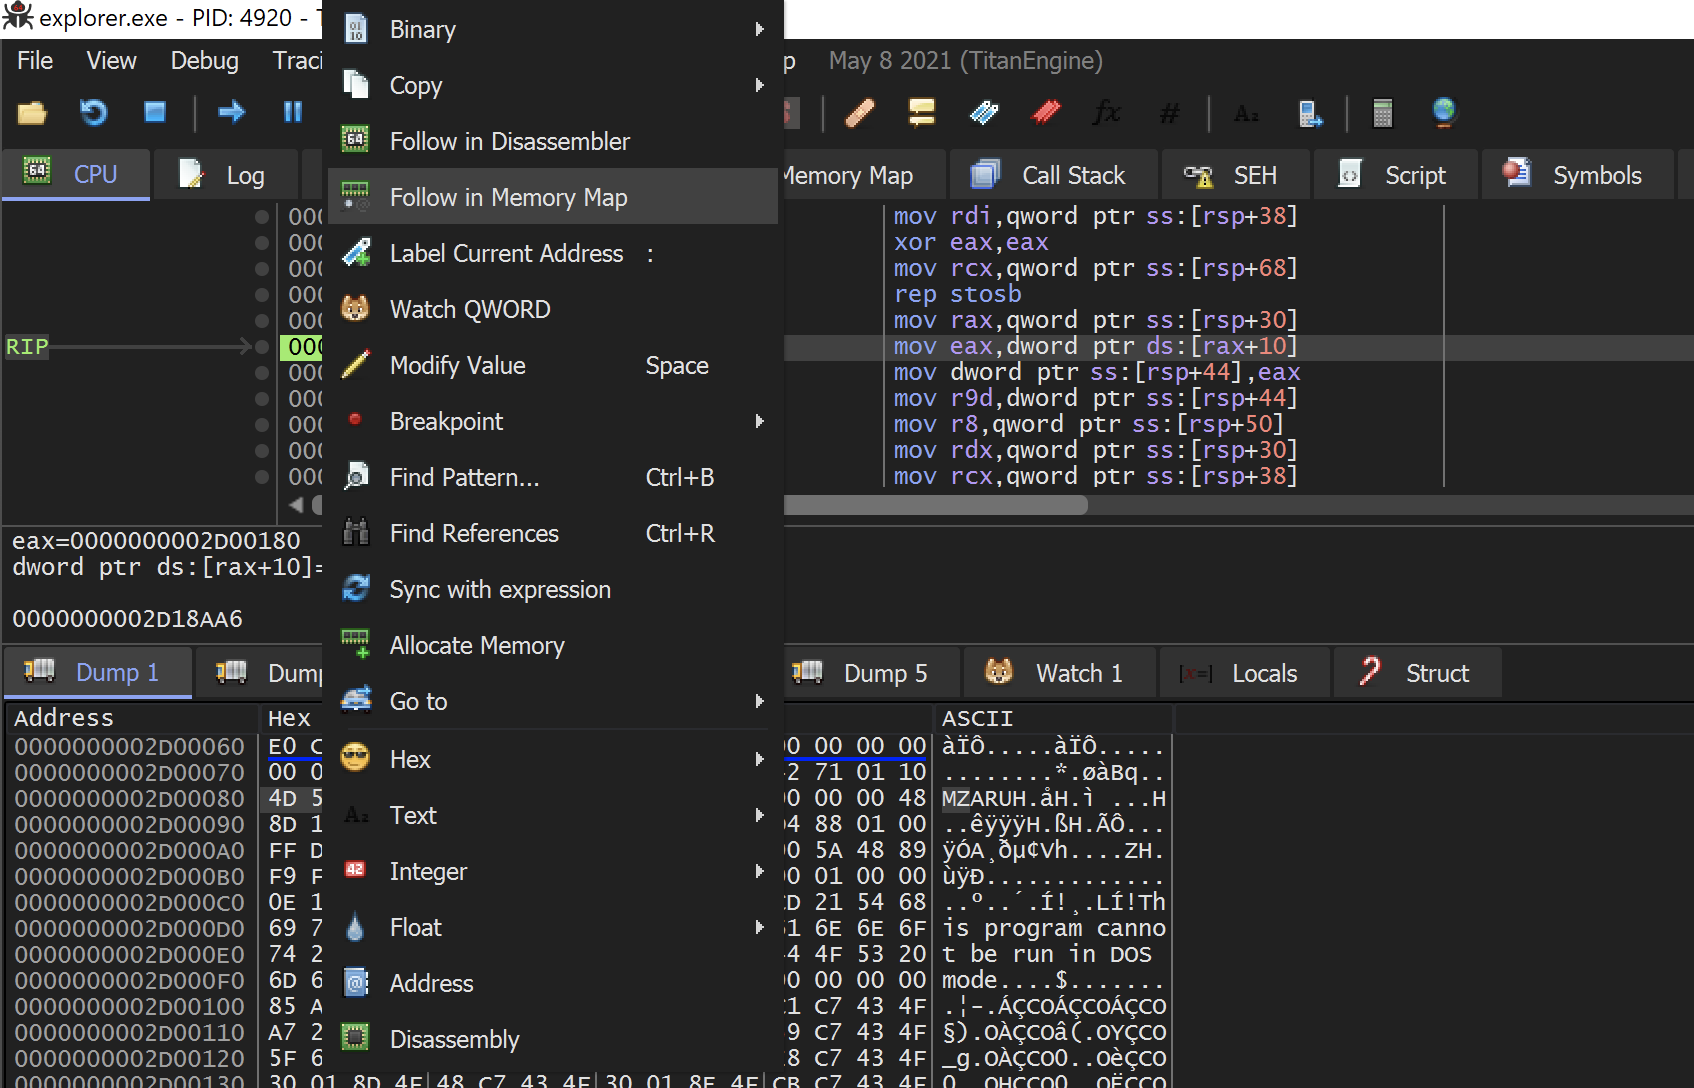
This leads me to the memory map that displays the various memory areas linked to the process. The area marked in gray here currently holds the executable bytes we have just located.
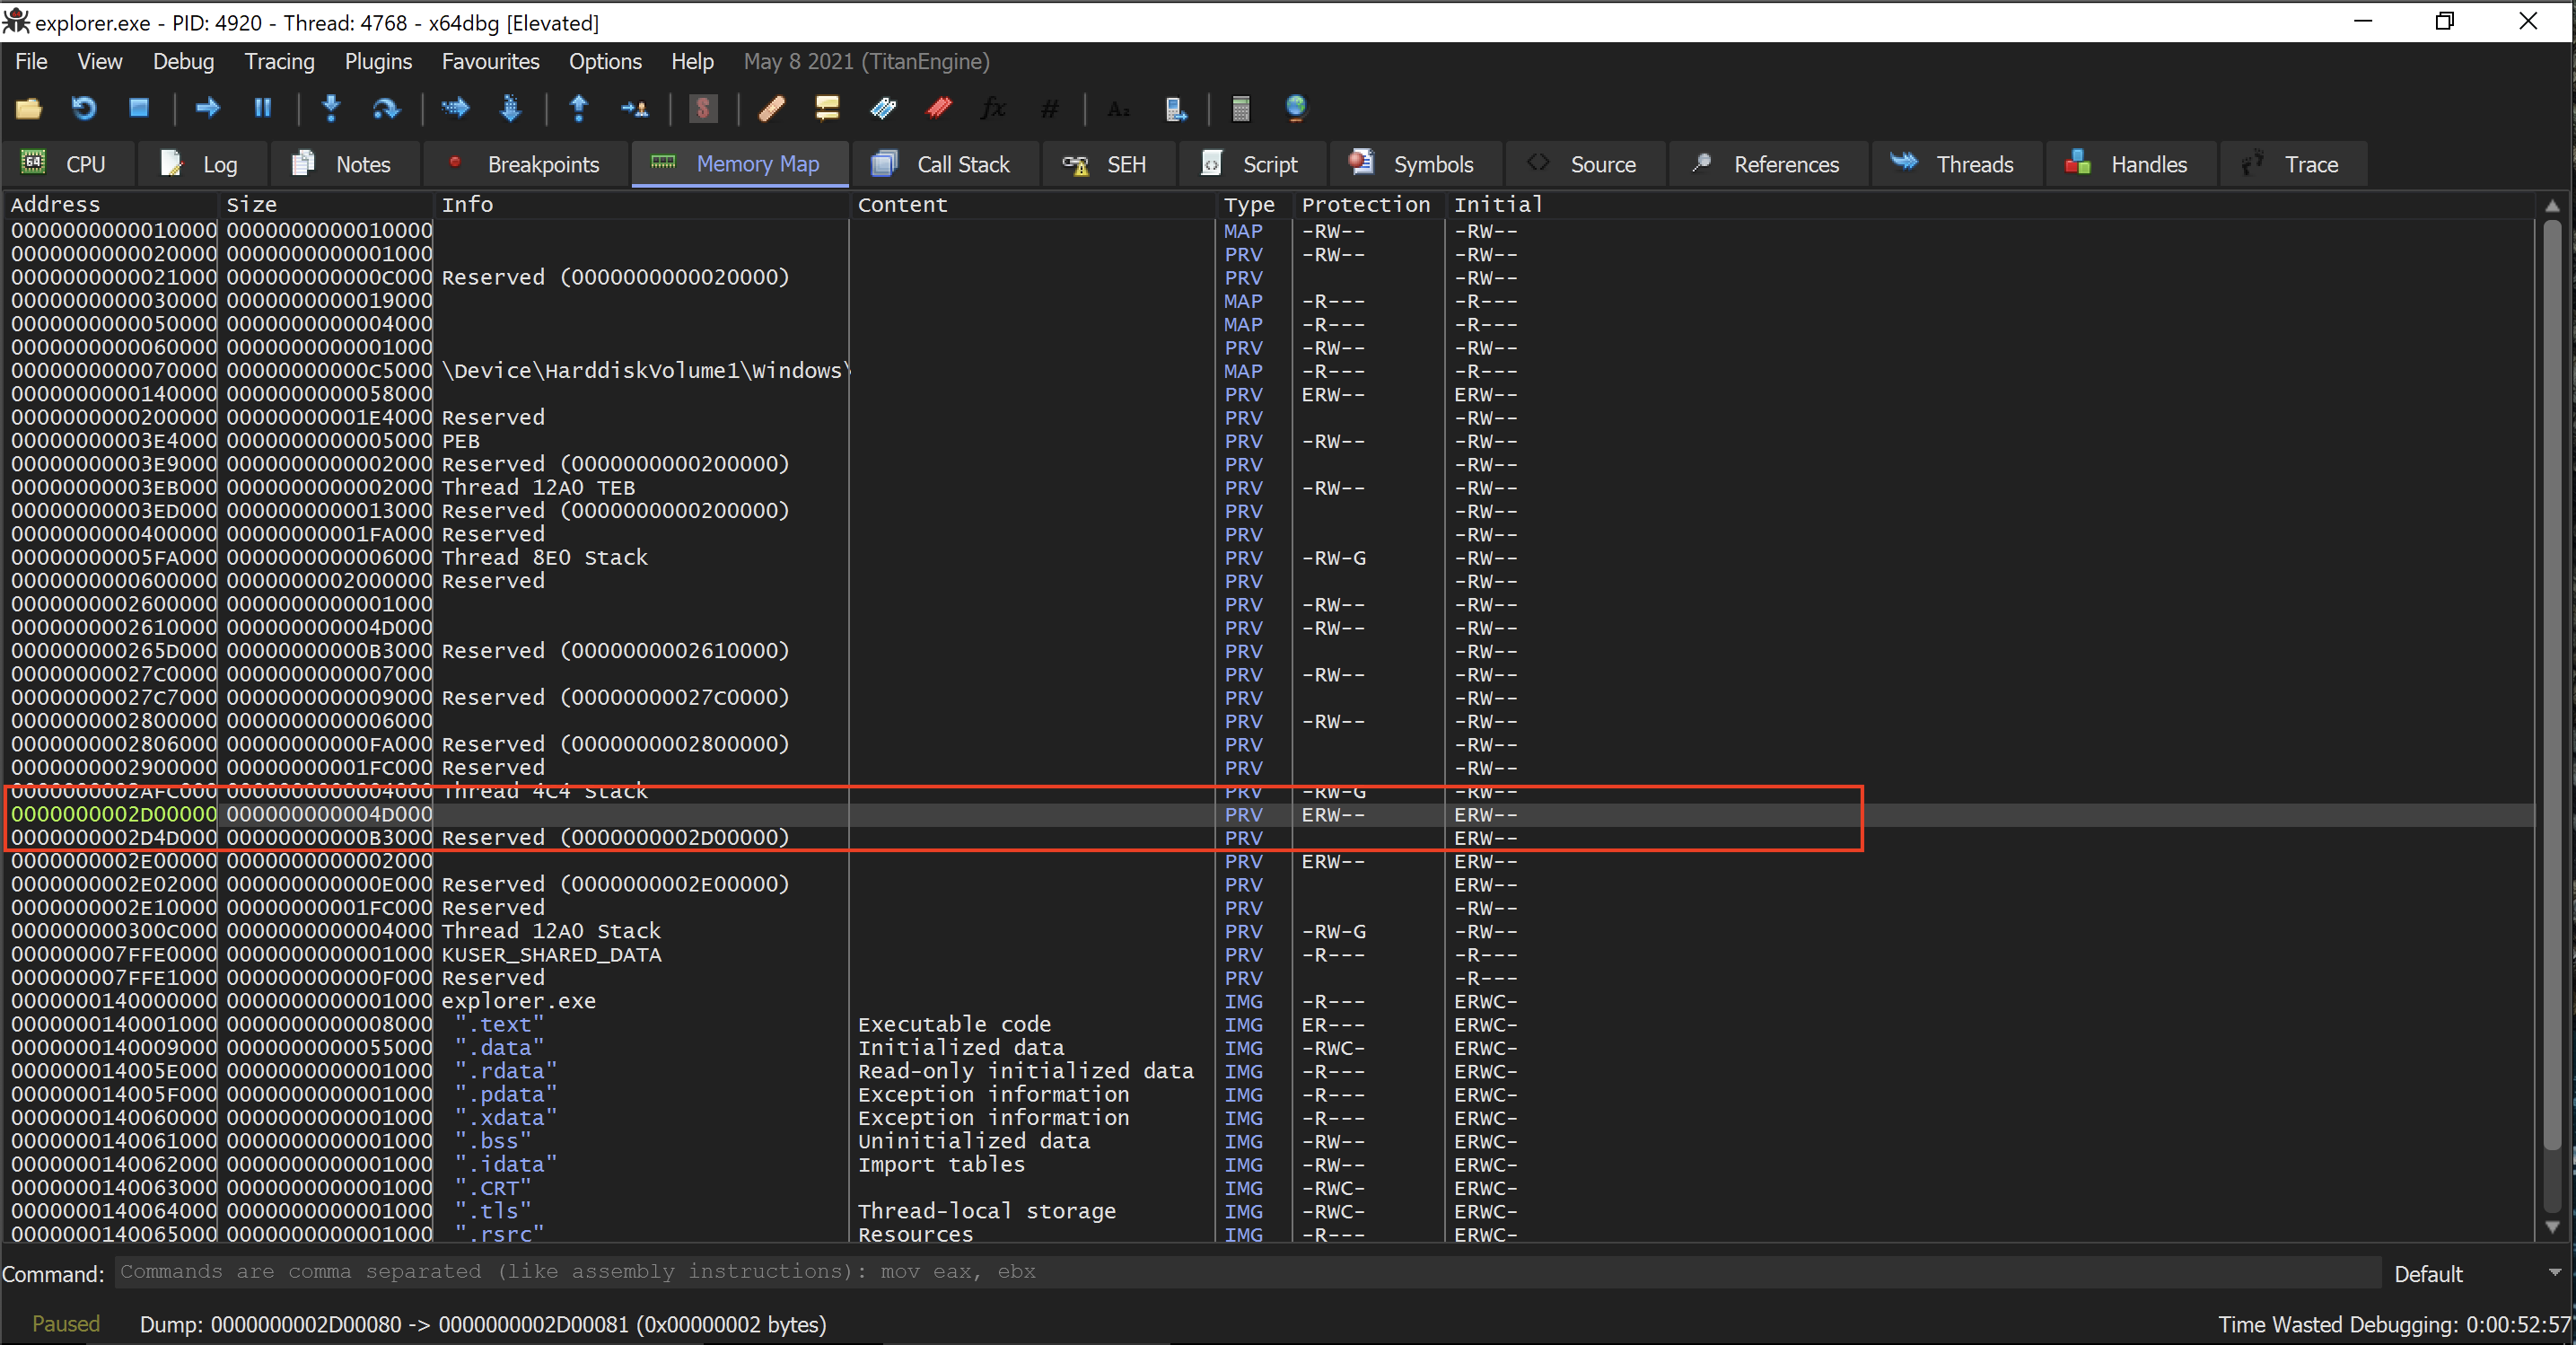
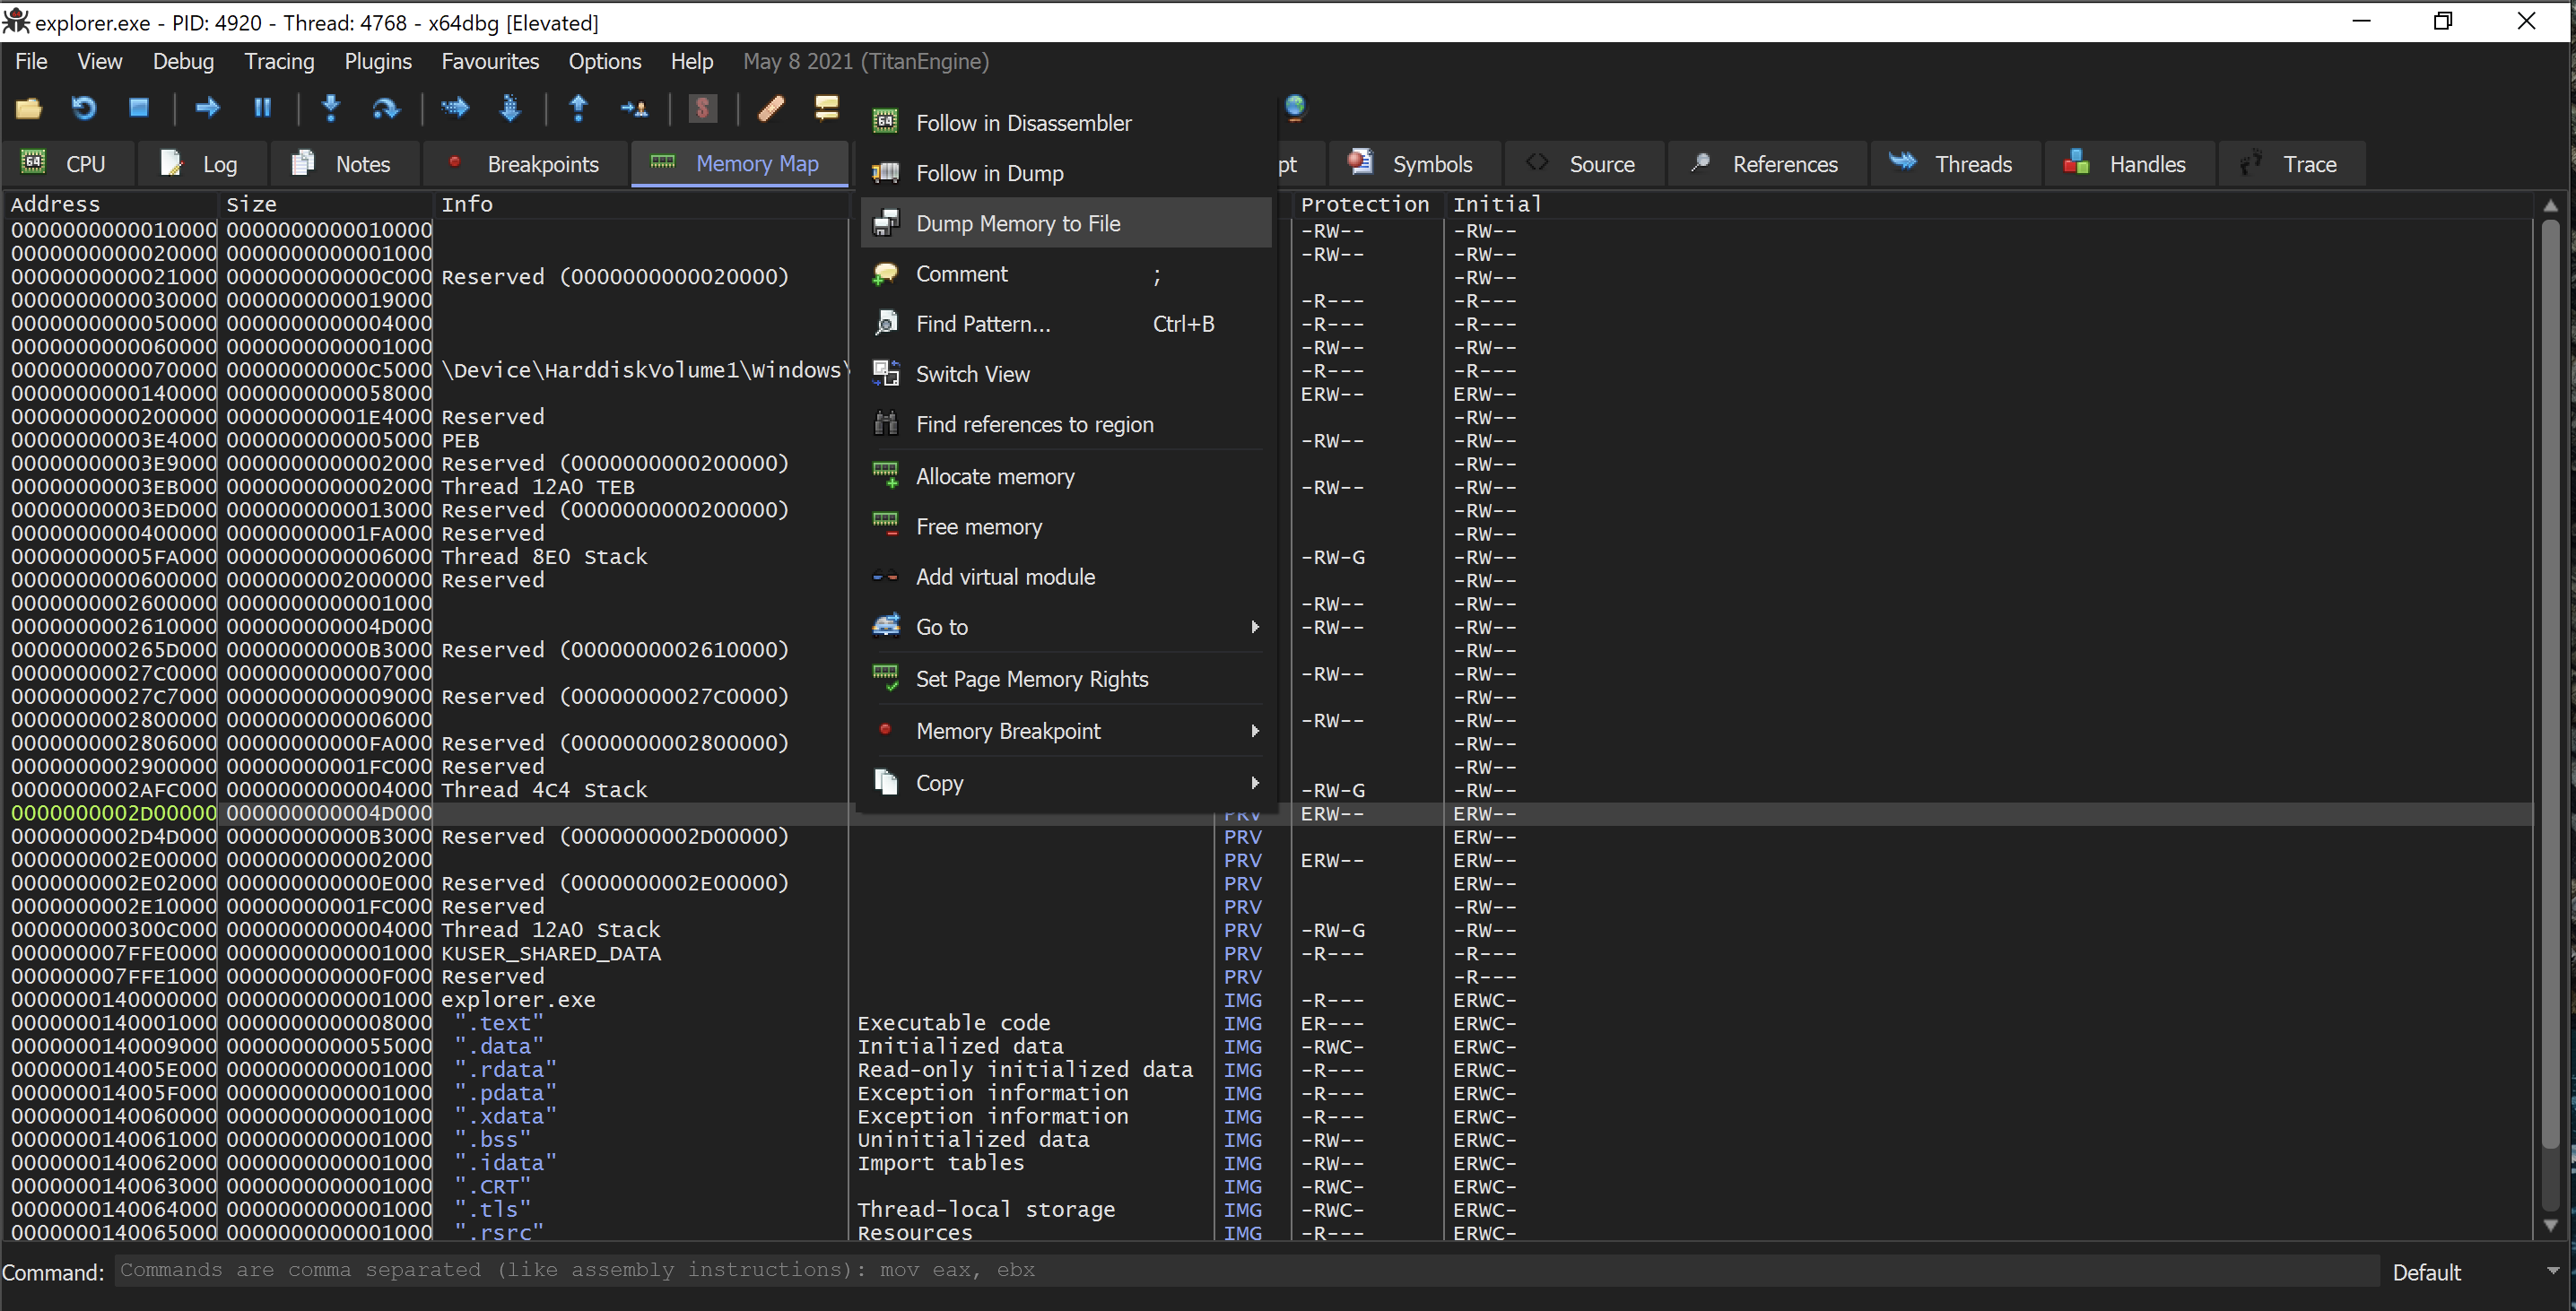
Therefore, I will right-click on this highlighted row once more and select dump memory to file.
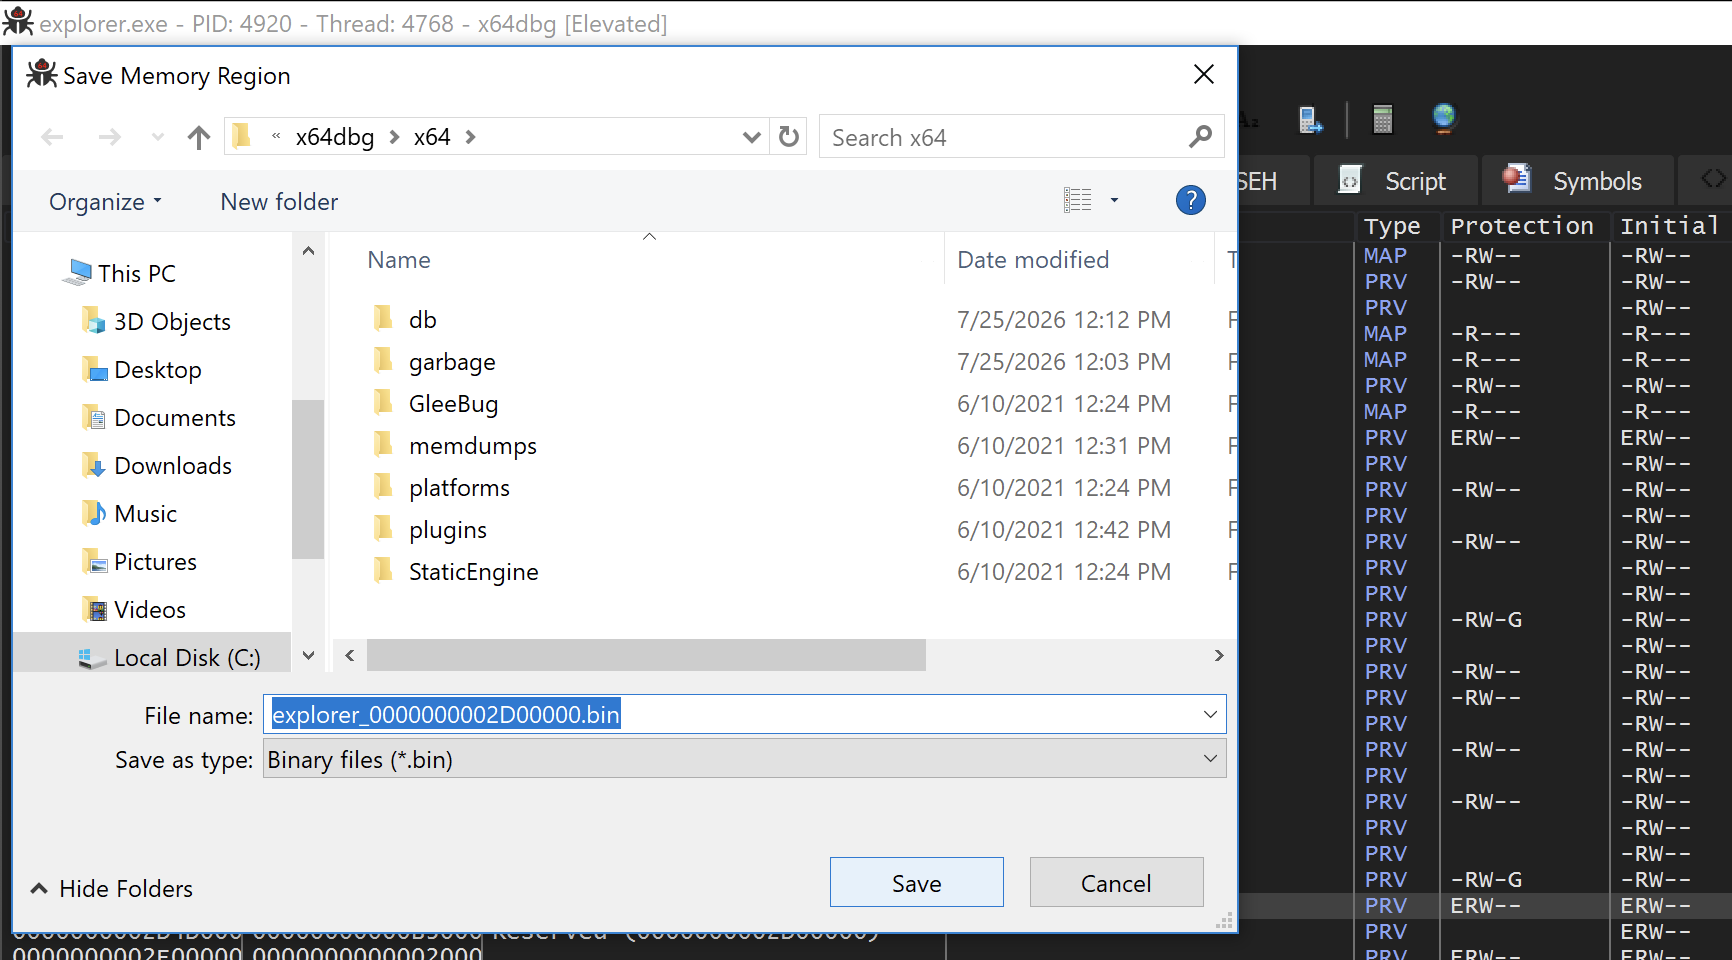
I'll retain the current default file name and then proceed to click save.
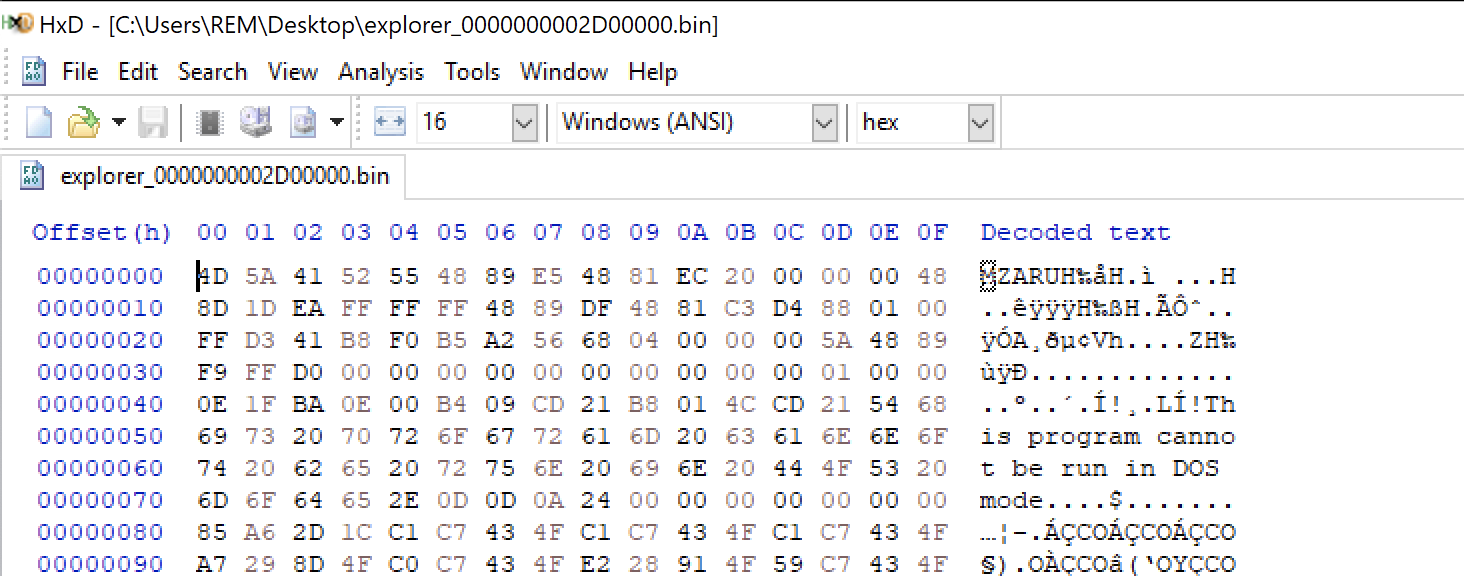
If I want to quickly examine the dumped file, I can simply drag and drop it into hxd, a hex editor. I can instantly spot the mz bytes here, preceded by the message that this program cannot operate in DOS mode.
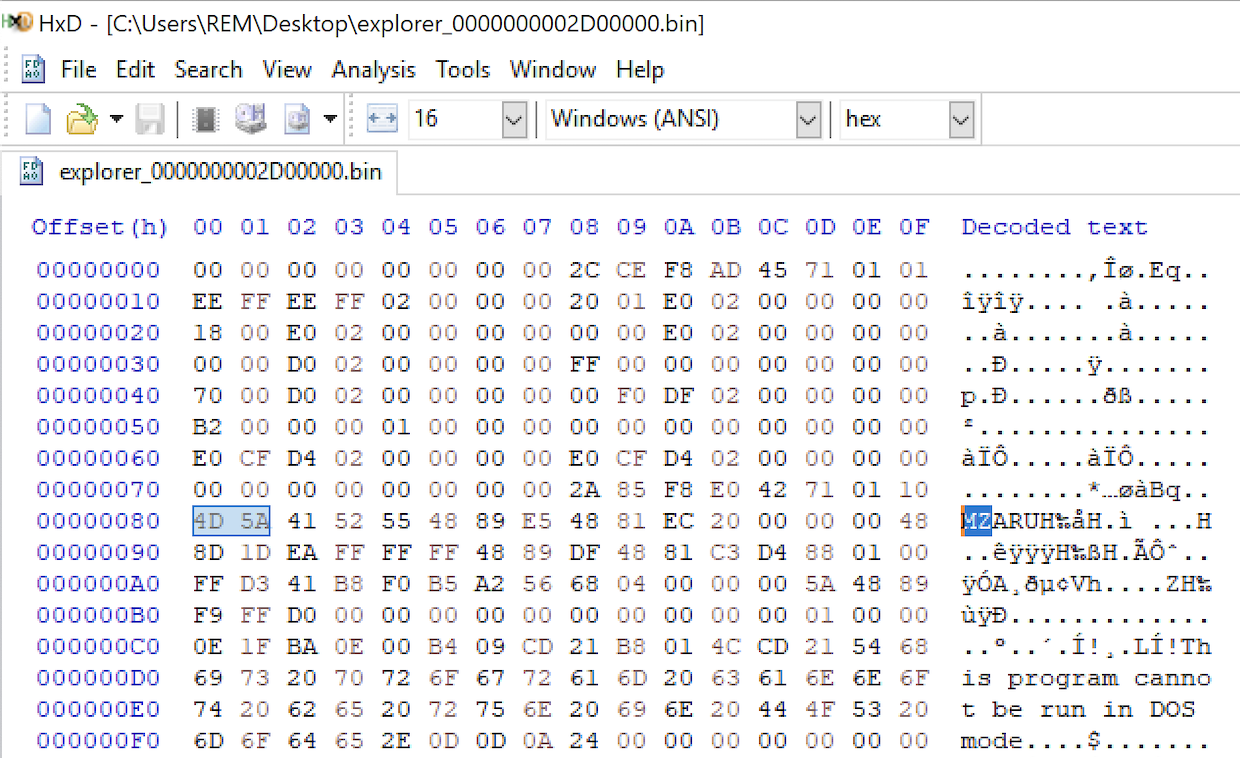
Currently, you can observe that there are additional bytes present before the MZ header officially starts. That is quite typical when extracting content straight from memory.
To tidy this up, I will simply highlight these bytes before the MZ, press backspace on my keyboard, and then confirm that I wish to delete them.
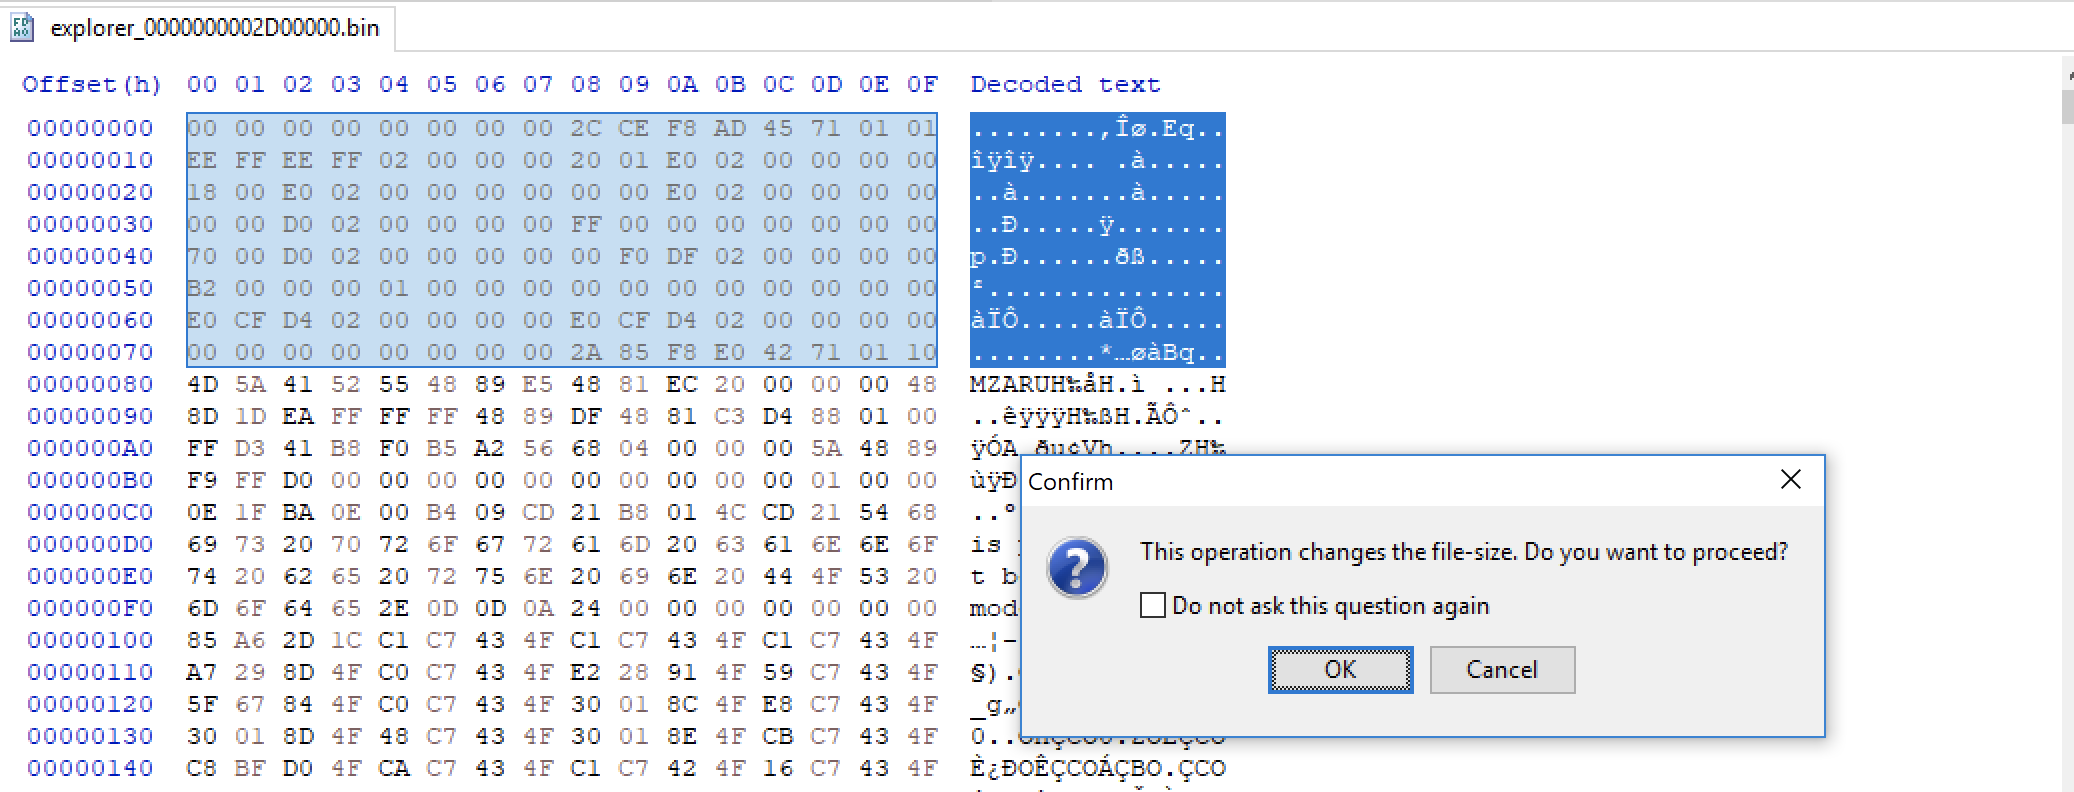
I now have MZ at the start of the file, which is what one would anticipate for a legitimate Windows executable. I'll save this, close HXD, and then I can continue to perform static analysis with a tool such as PE Studio for a more detailed inspection.
PE Studio
Now, I will drag and drop this into PE Studio.
What I can observe right away is that it is a dynamic link library, or DLL, and it is a 64-bit executable.
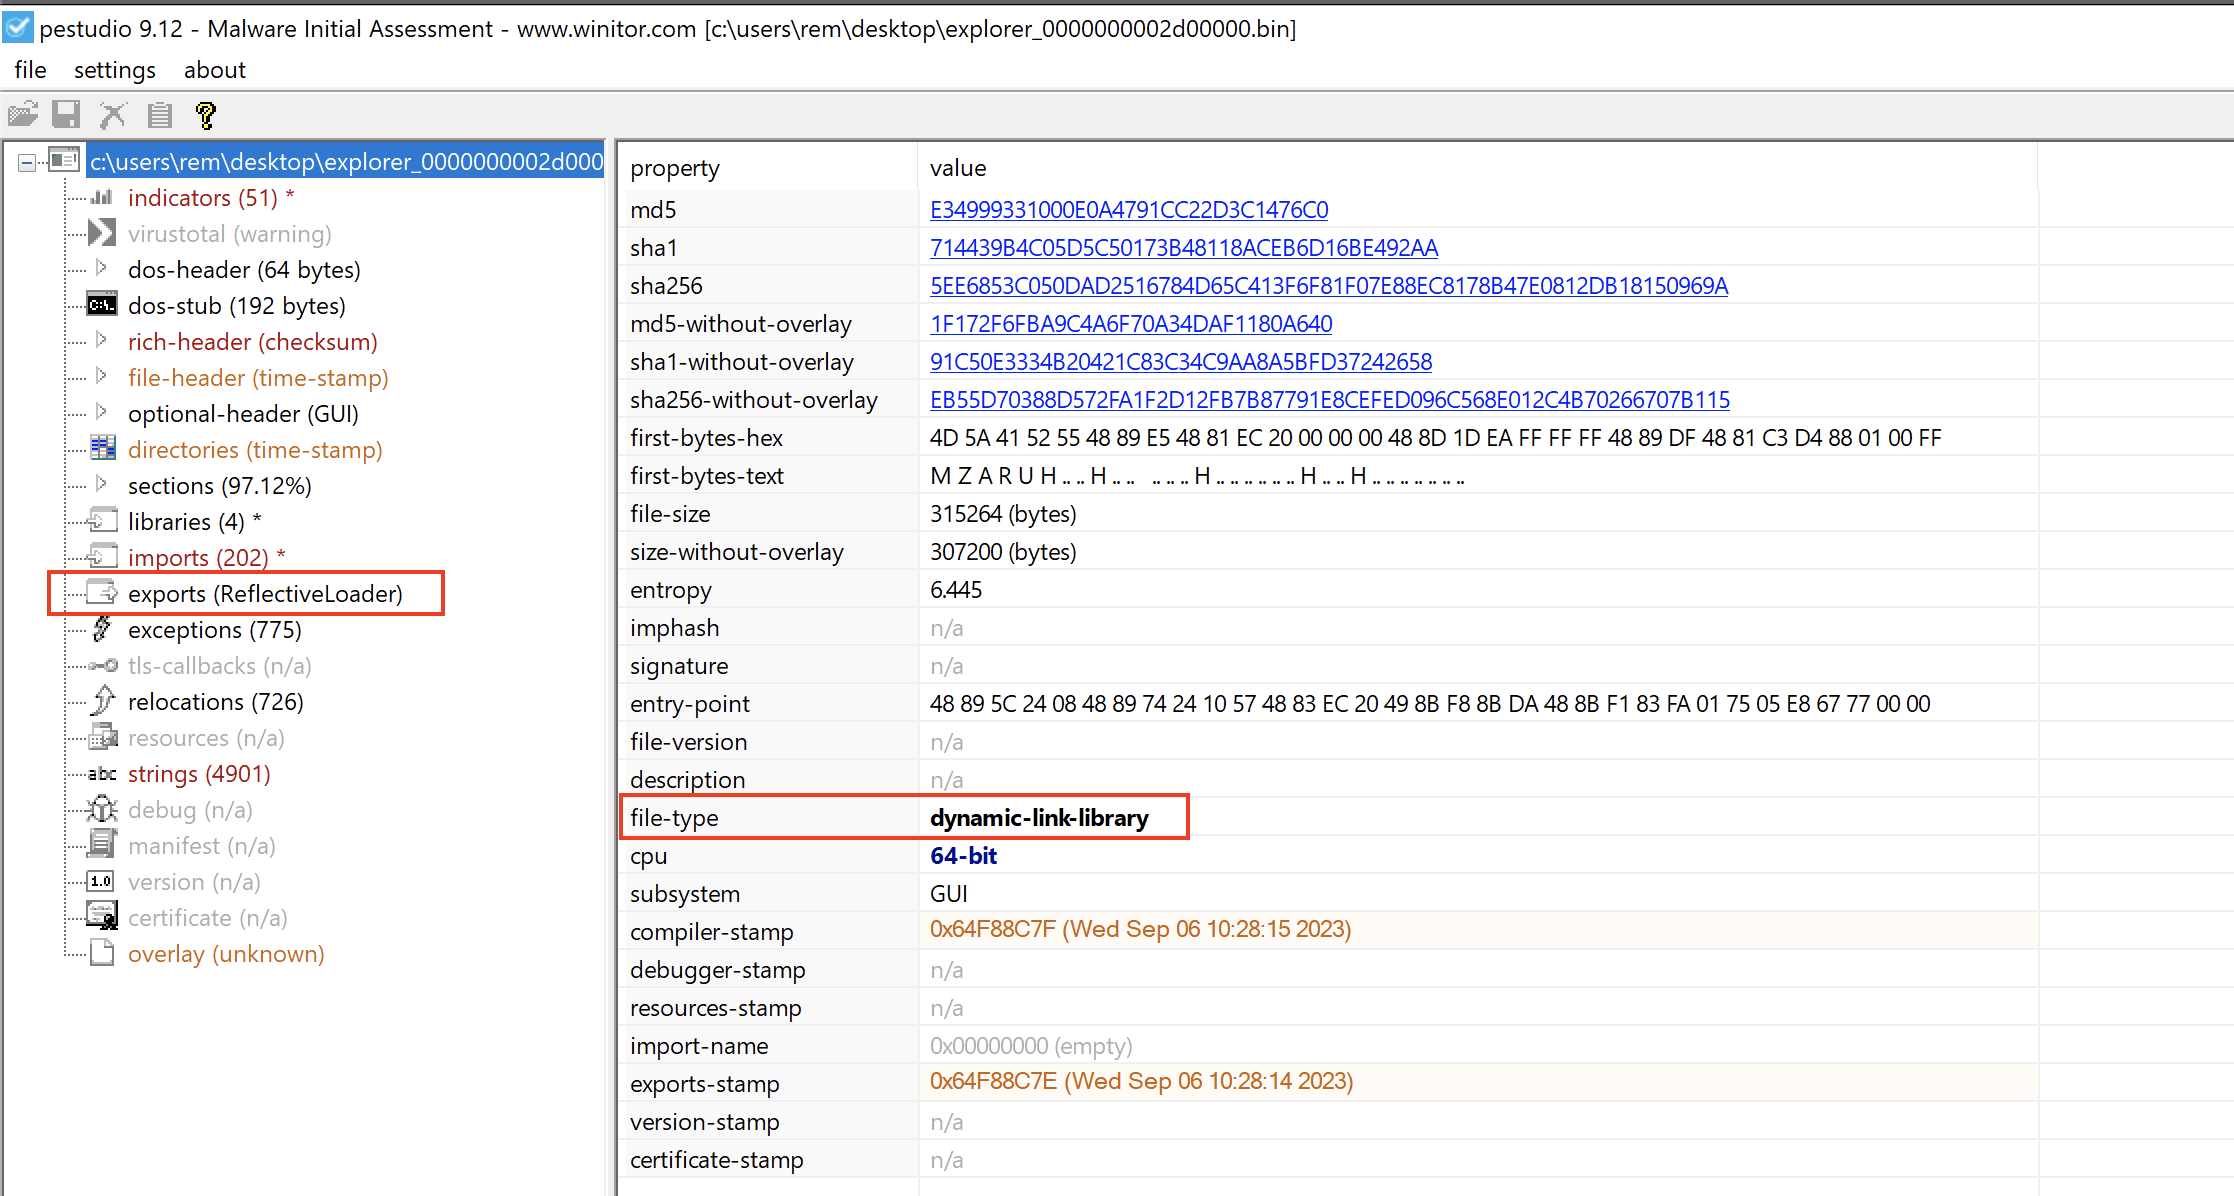
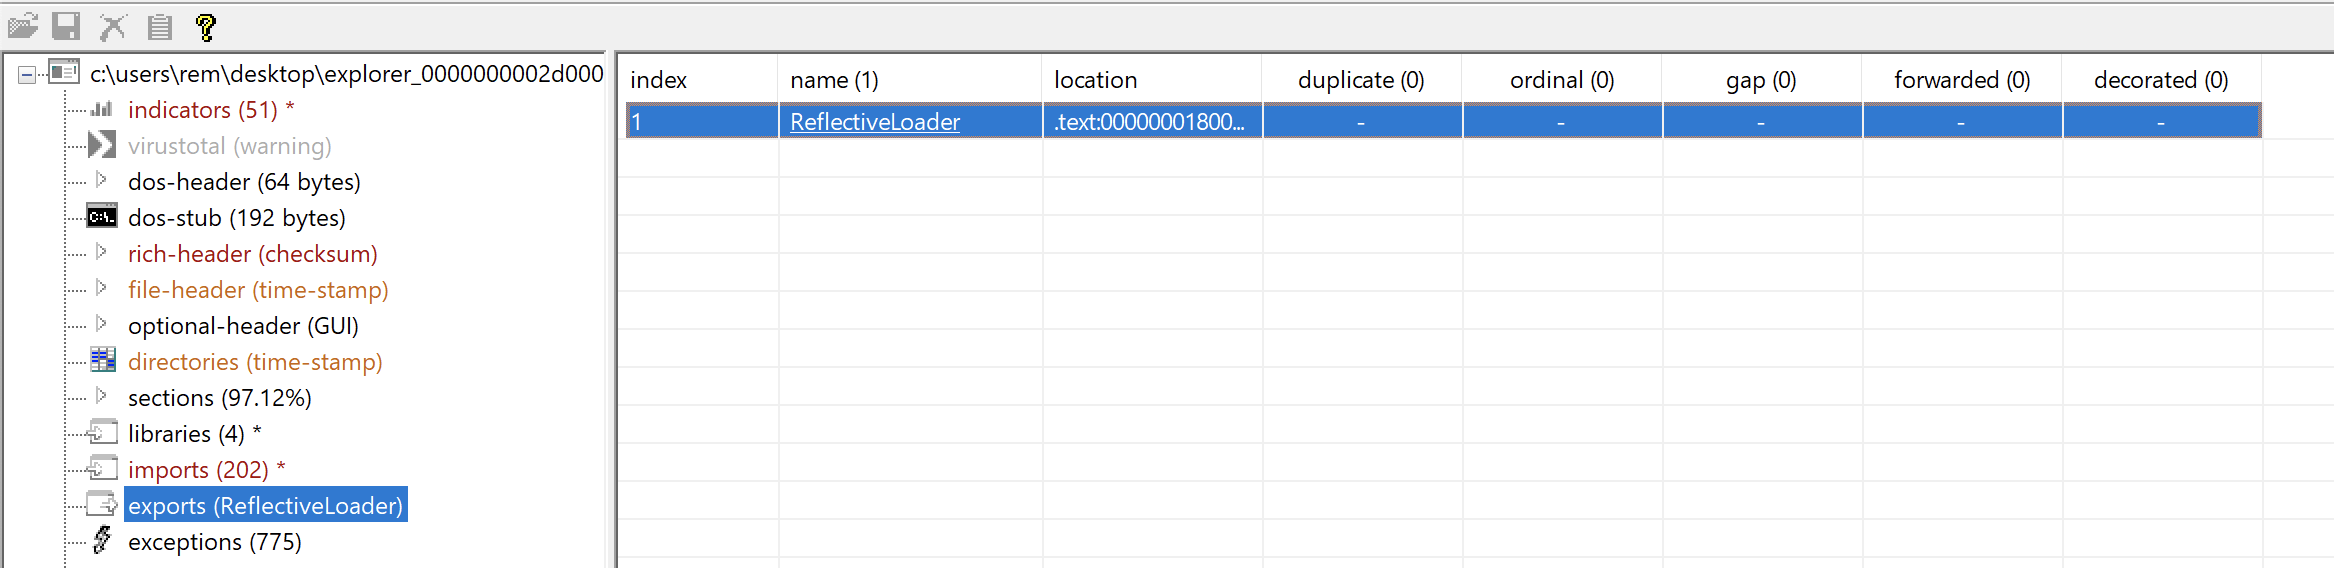
There is also one exported function present called reflective loader, which is typical of a cobalt strike beacon and serves as the payload delivering command and control functions to the attacker.
That concludes our analysis for today. To summarize, we employed the debugger to pinpoint memory allocation, capture the instant the actual payload was exposed during execution, and retrieve it without having to reverse the complete loader.