Understanding IsDebuggerPresent
The IsDebuggerPresent function is a fundamental tool in the Windows API (found within kernel32.dll). It is the most common "anti-debugging" technique used by malware authors to detect if their code is being analyzed in a controlled environment.
1. The High-Level Purpose
The function serves as a simple "boolean" check. When called, it asks the Windows Operating System: "Is there a debugger currently attached to this process?"
2. The Internal Mechanics (The PEB)
The reason this function is so fast is that it doesn't actually perform a system-wide scan. Instead, it looks at a specific data structure that Windows creates for every running process: the Process Environment Block (PEB).
Inside the PEB, at a specific memory offset (+2), resides a single byte known as the BeingDebugged flag.
.exe, the OS sets this flag to 0.1.IsDebuggerPresent simply reads that one byte and reports its value back to the program.
3. Assembly Level Perspective
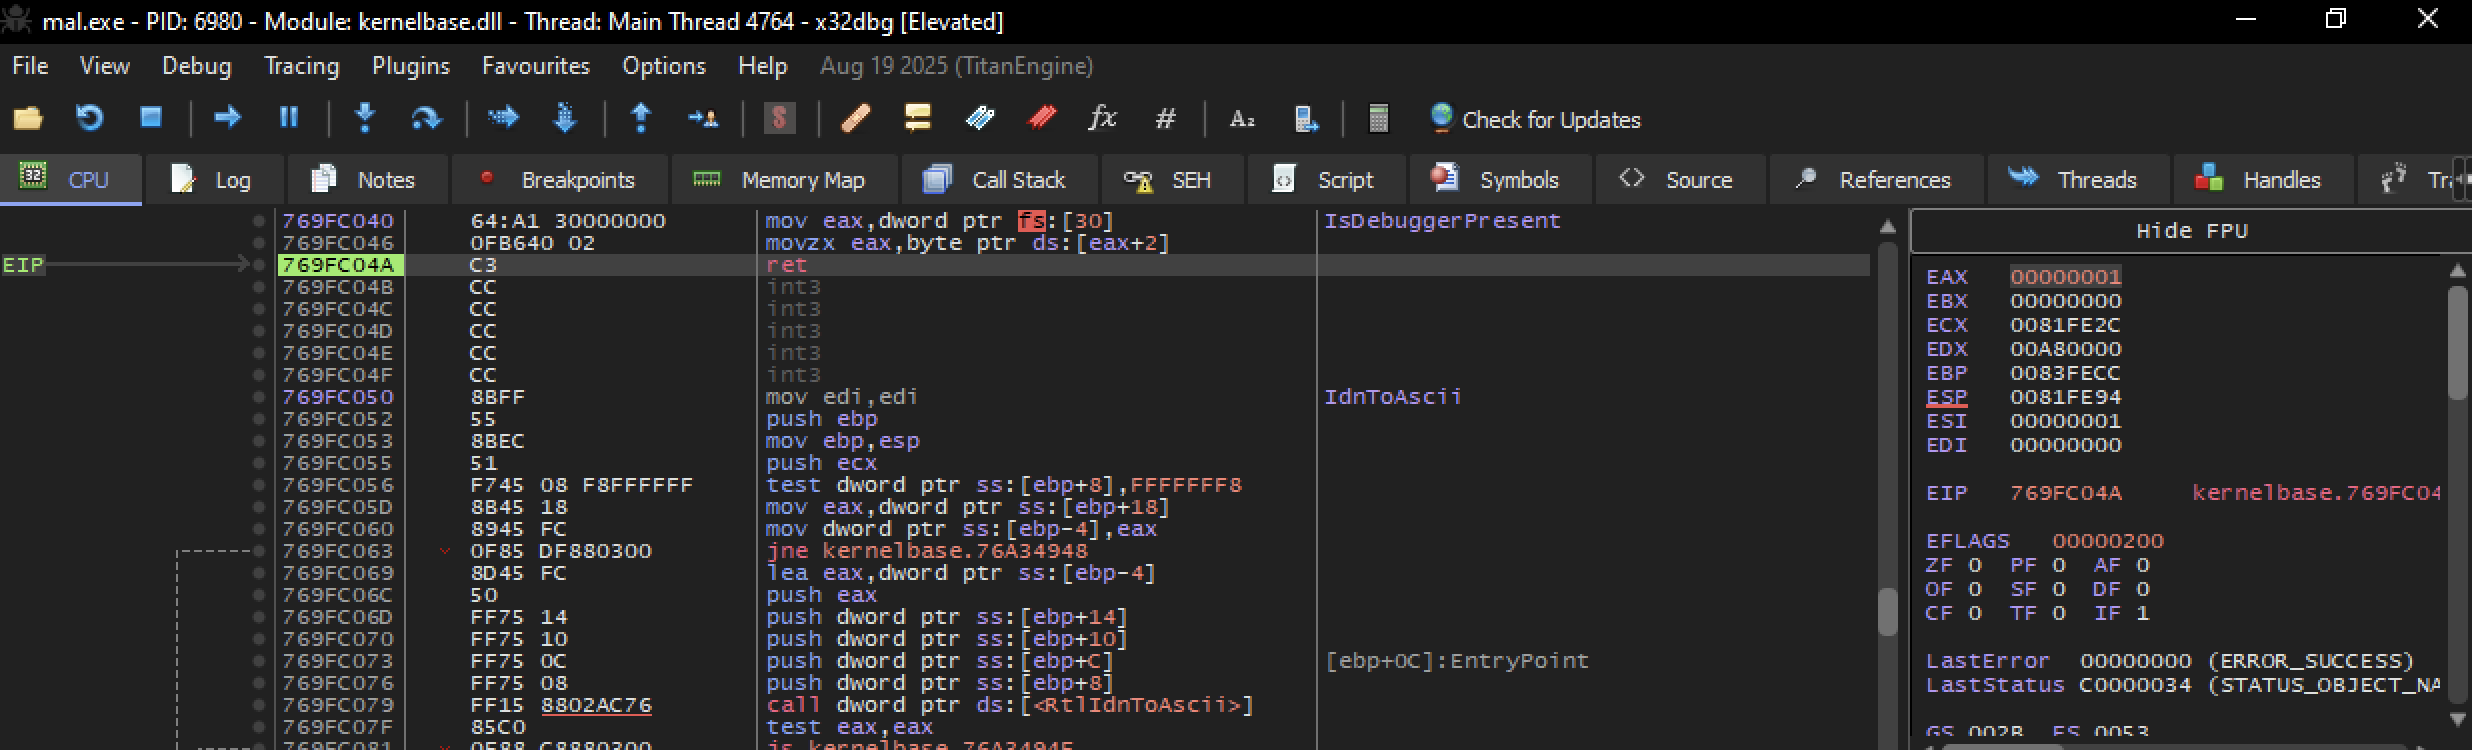
In a 32-bit environment, the function is incredibly lightweight. It only takes a few instructions to find the PEB and read the flag:
mov eax, dword ptr fs:[30h]  ; Move the address of the PEB into EAX
movzx eax, byte ptr [eax+2]   ; Move the BeingDebugged flag (PEB + 2) into EAX
ret                           ; Return with the result in EAX
4. Why it Matters for Researchers
Because this function relies entirely on a single byte in memory, it is very fragile.
1 back to a 0 in the PEB, or by "patching" the return value of the function during analysis.Technical Note: In modern malware analysis, IsDebuggerPresent is considered a "low-effort" check. Advanced malware will often skip the API call entirely and use the assembly instructions shown above to read the PEB directly, hoping to avoid being caught by researchers who place breakpoints on common API functions.
Sample Metadata
| Property | Value |
|---|---|
| MD5 | ca8e6c01282b57405ae4b2af66adbafa |
| SHA-1 | dab881b117a4e3515ff9315e30ce1a0a814ad42d |
| SHA-256 | e1dc04d5611806a578a793ef0d188c49858c004a291529e1818585e57993396c |
| Vhash | 016056655d15756210b02002300a46z161d013zf2za0030e039z |
| Authentihash | fcaf8e2b9725b671076956548a53e77e79611ff2ad7b5541103be264cdfe20ce |
| Imphash | afcdf79be1557326c854b6e20cb900a7 |
| Rich PE Header Hash | a5d888b5a108c327d65f490cc1a712f2 |
| SSDEEP | 24576:CAHnh+eWsN3skA4RV1Hom2KXMmHa7cldzvKO1X3JWCRYj3m25:Fh+ZkldoPK8Ya7yd+Od3BRUj |
| TLSH | T16645BE0273D2C036FFABA2739B6AF60556BC79254133852F13981DB9BD701B2163E663 |
| File Type | Win32 EXE (executable, windows, win32, pe) |
| Magic | PE32 executable (GUI) Intel 80386, for MS Windows |
| TrID | Win64 Executable (32.2%), Win32 DLL (20.1%), Win16 NE (15.4%), Win32 EXE (13.7%) |
| DetectItEasy | PE32, AutoIt (3.XX), MSVC (2013-2017), MSVC (18.00.40629), VS 2013 |
| Magika | PEBIN |
| File Size | 1.17 MB (1,231,360 bytes) |
Although the sample is packed we are not gonna deal with it. we will focus only on IsDebuggerPresent.
x32dbg Analysis
Symbols
we find two IsdebuggerPresent under symbols.
set a breakpoint on Address=76032770 Type=Export Ordinal=900 Symbol=IsDebuggerPresent .

Now let’s run the binary
System break point.
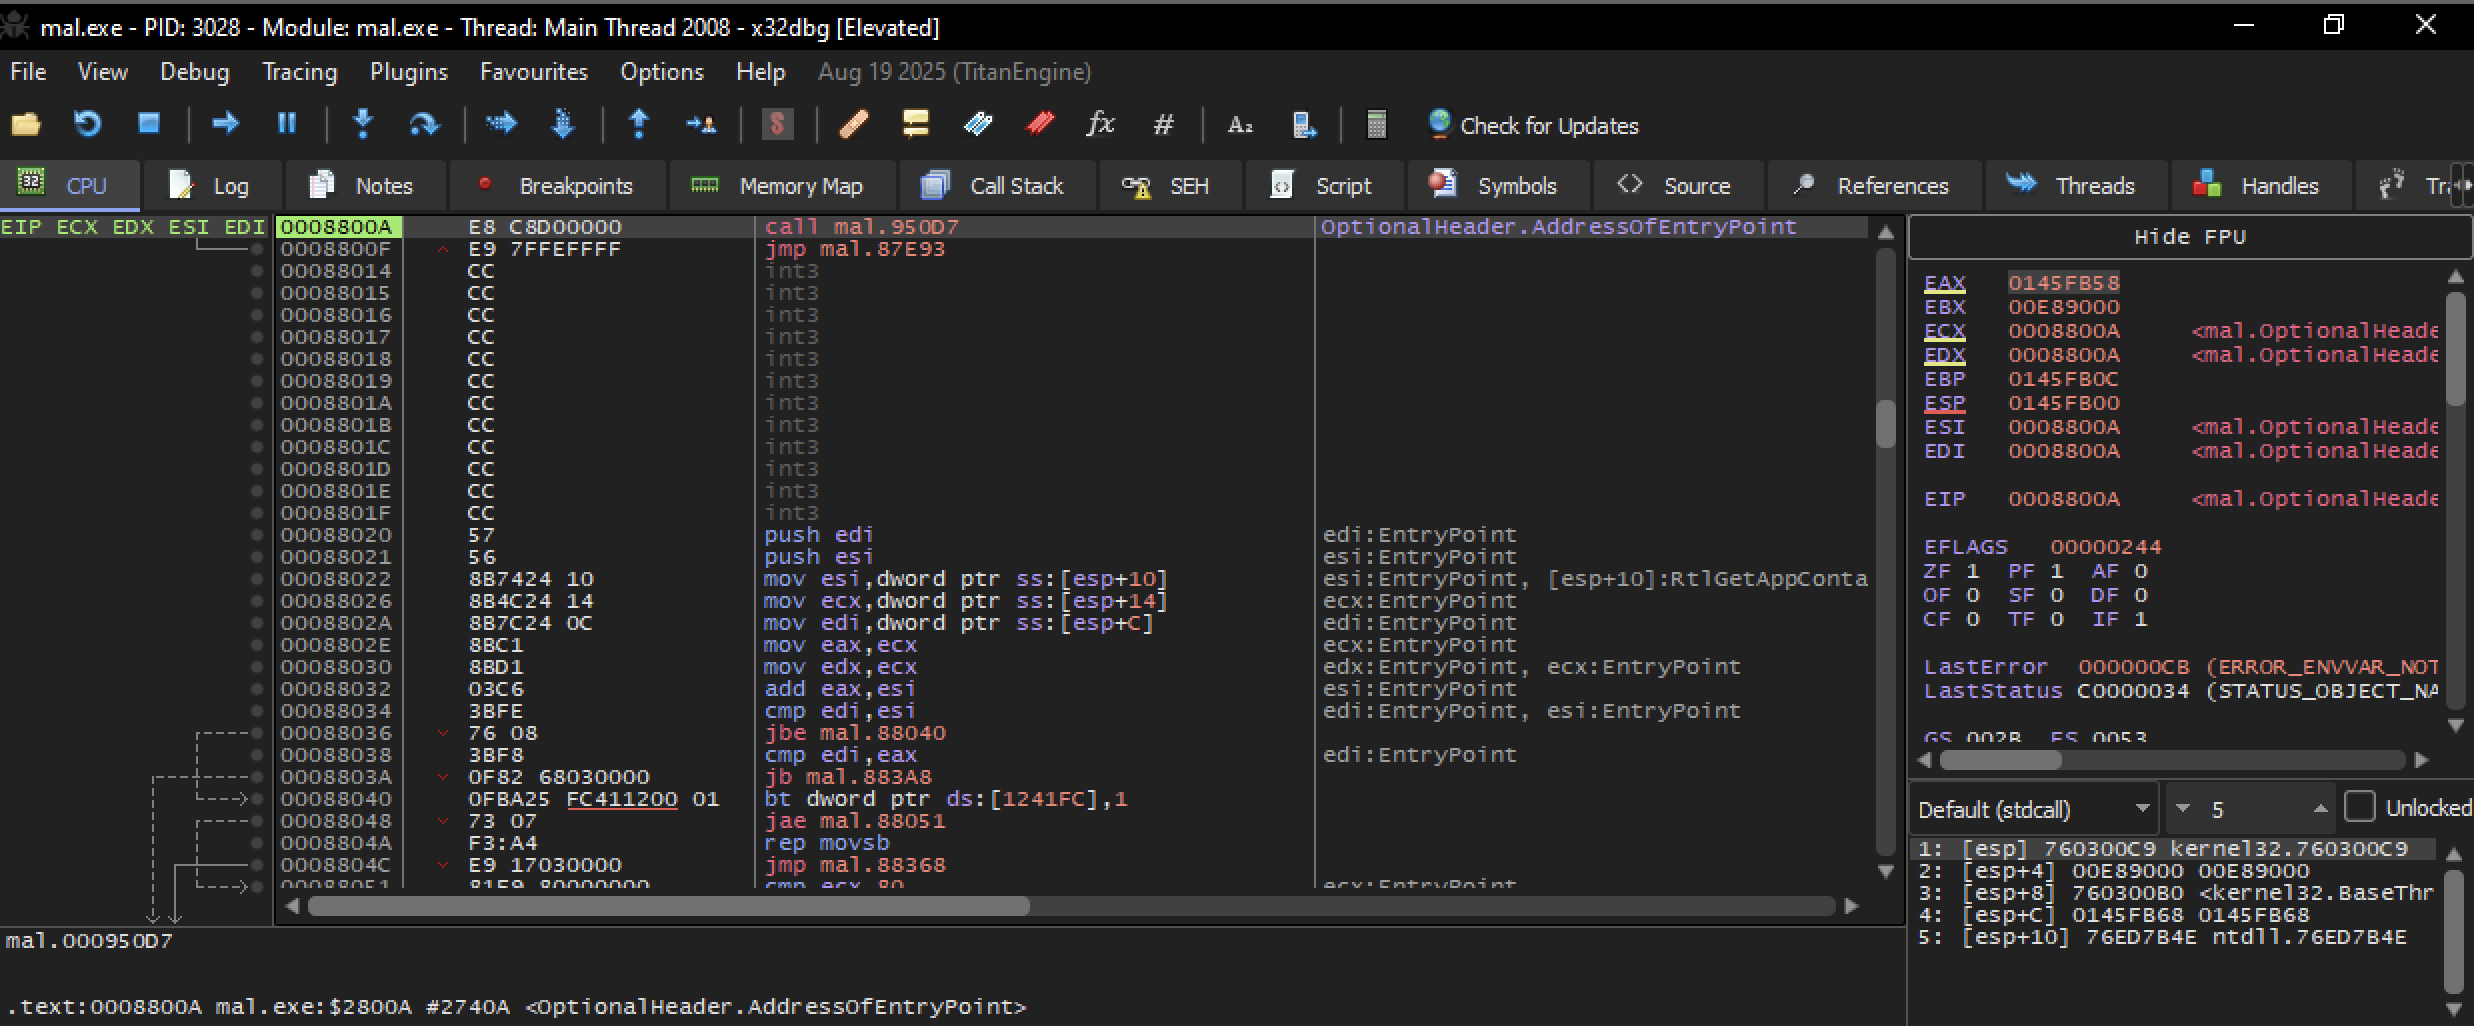
Reached IsDebuggerPresent .
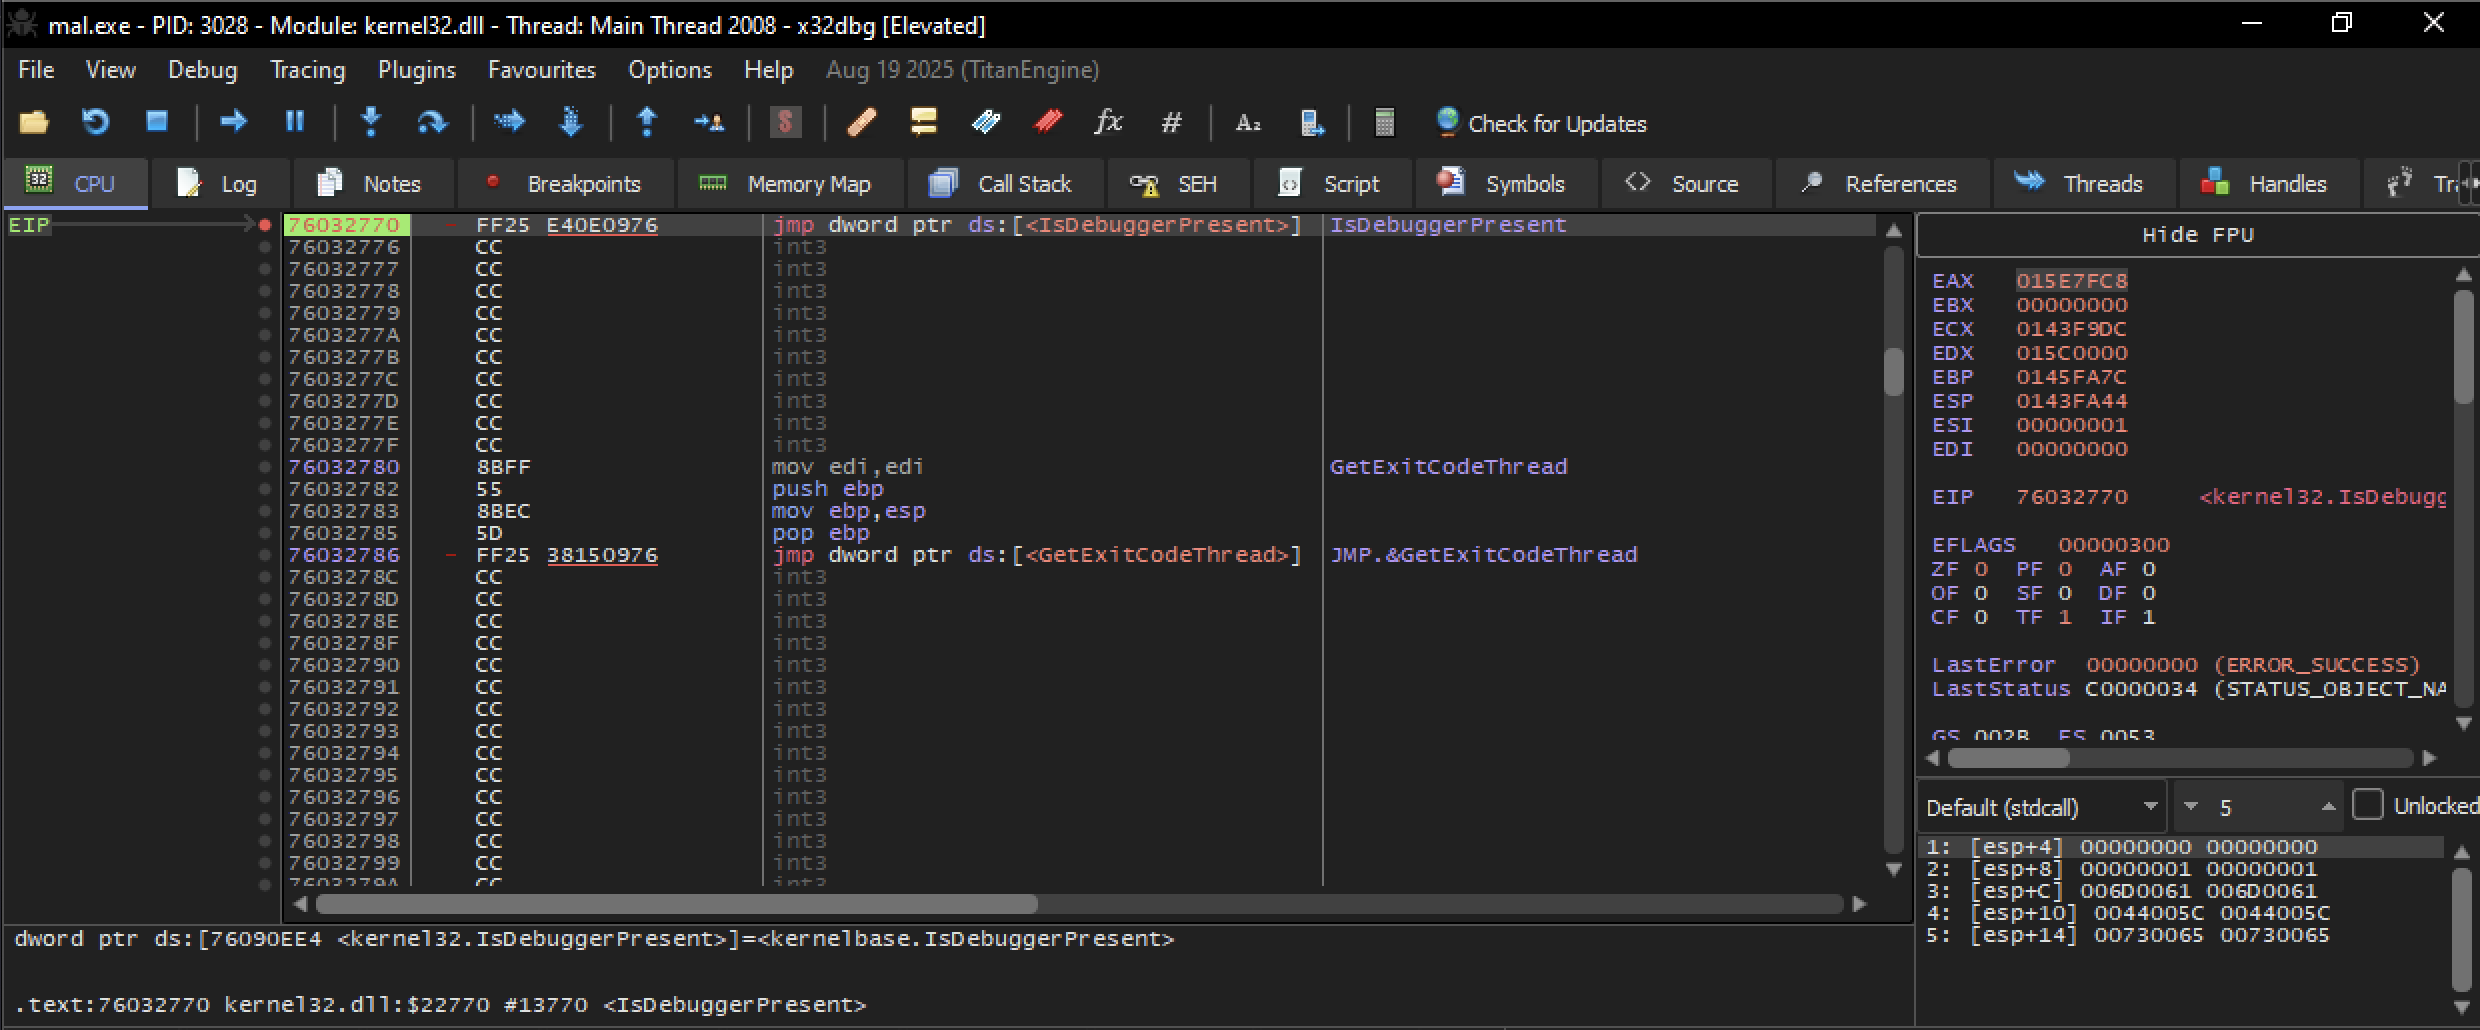
The Jump Thunk (The "Gateway")
When viewing the malware in x32dbg, we can see the exact moment it attempts to verify our presence. At address 76032770, the instruction jmp dword ptr ds:[<IsDebuggerPresent>] acts as a trigger. By placing a breakpoint here, the analyst can pause the malware's execution, inspect the registers, and prepare to spoof the result before the malware has a chance to react and terminate itself.
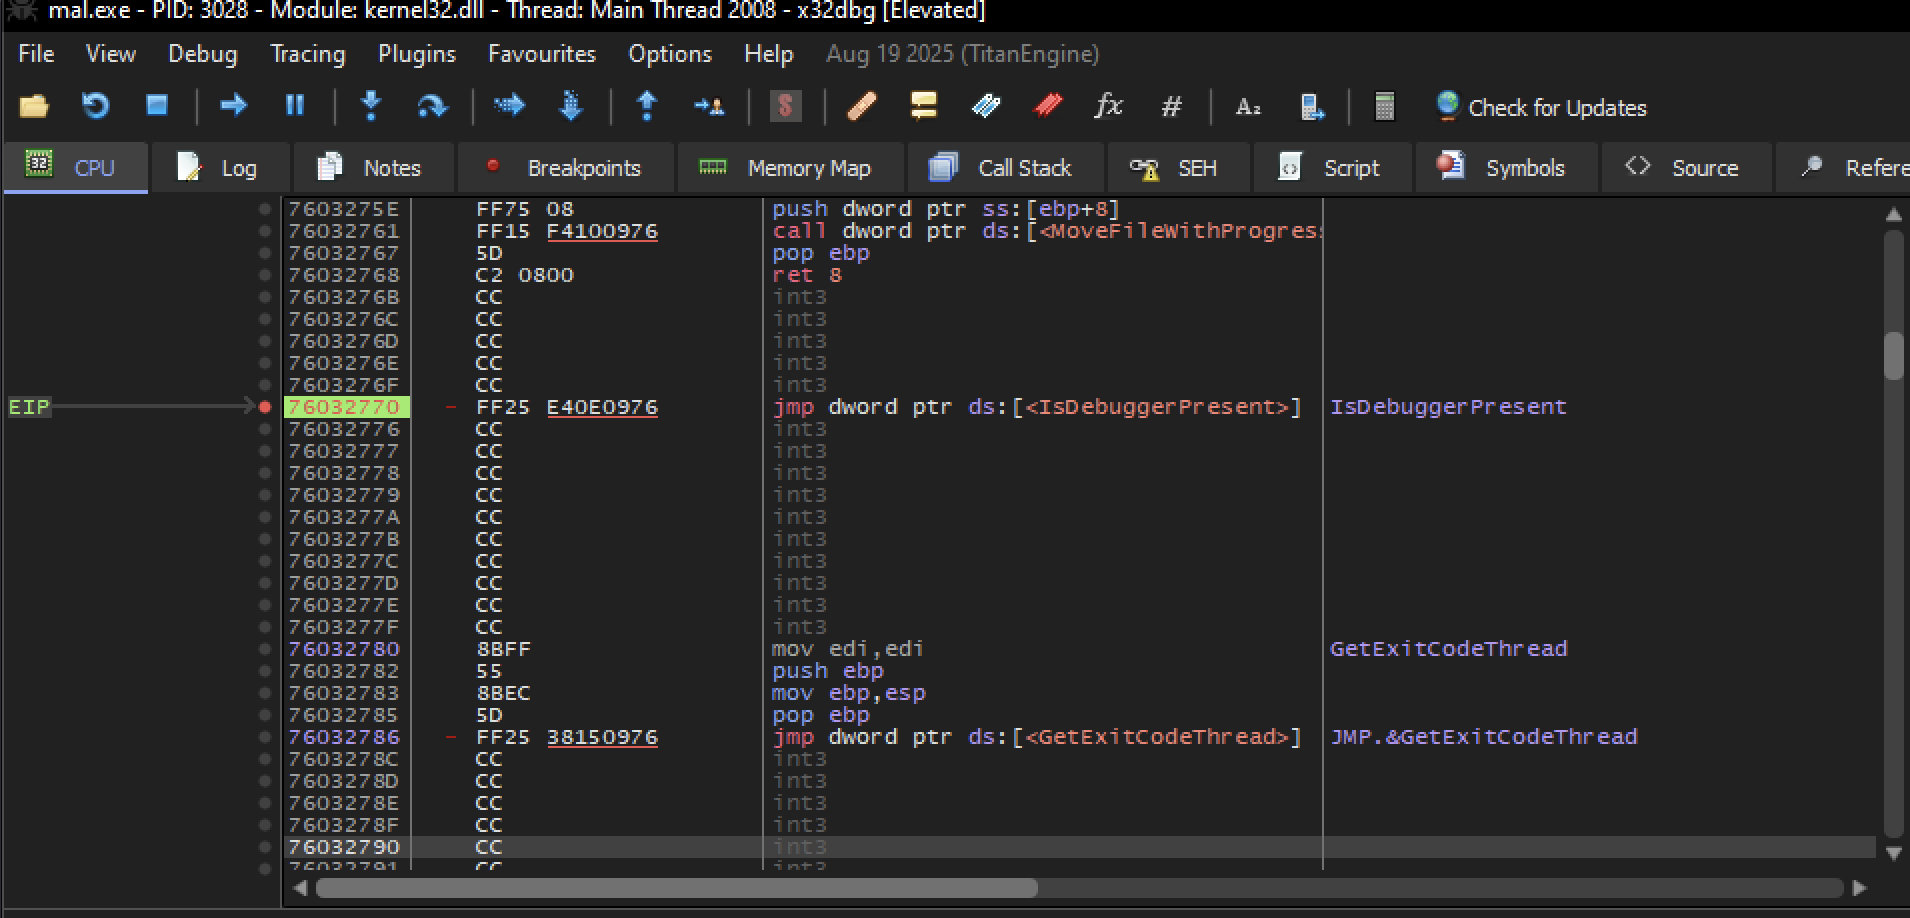
76032770 | FF25 E40E0976 | jmp dword ptr ds:[<IsDebuggerPresent>]76032770), which then "redirects" (jumps) to the actual location of IsDebuggerPresent inside kernel32.dll.Now step into the function
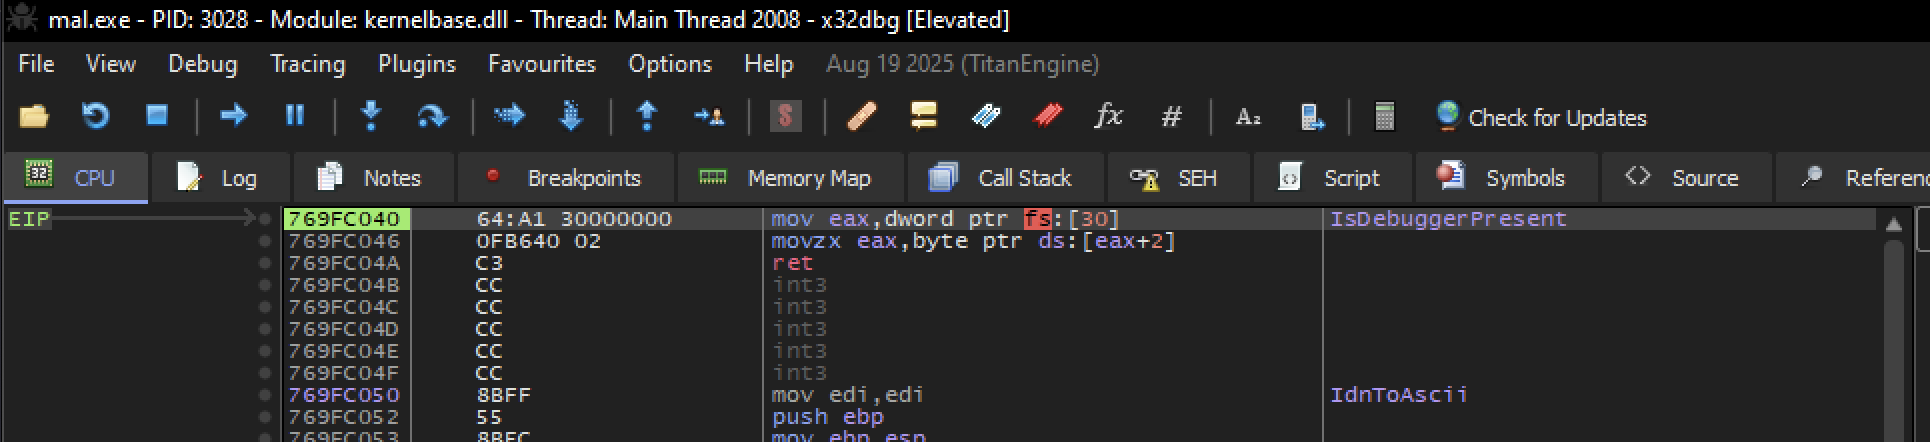
We need to check the return value
In the x86 architecture (32-bit), the return value of a function is stored in the EAX register.
Quick Summary:
EAX (Extended Accumulator Register).Step into
we can see the value of EAX = 1
Edit Eax to 0
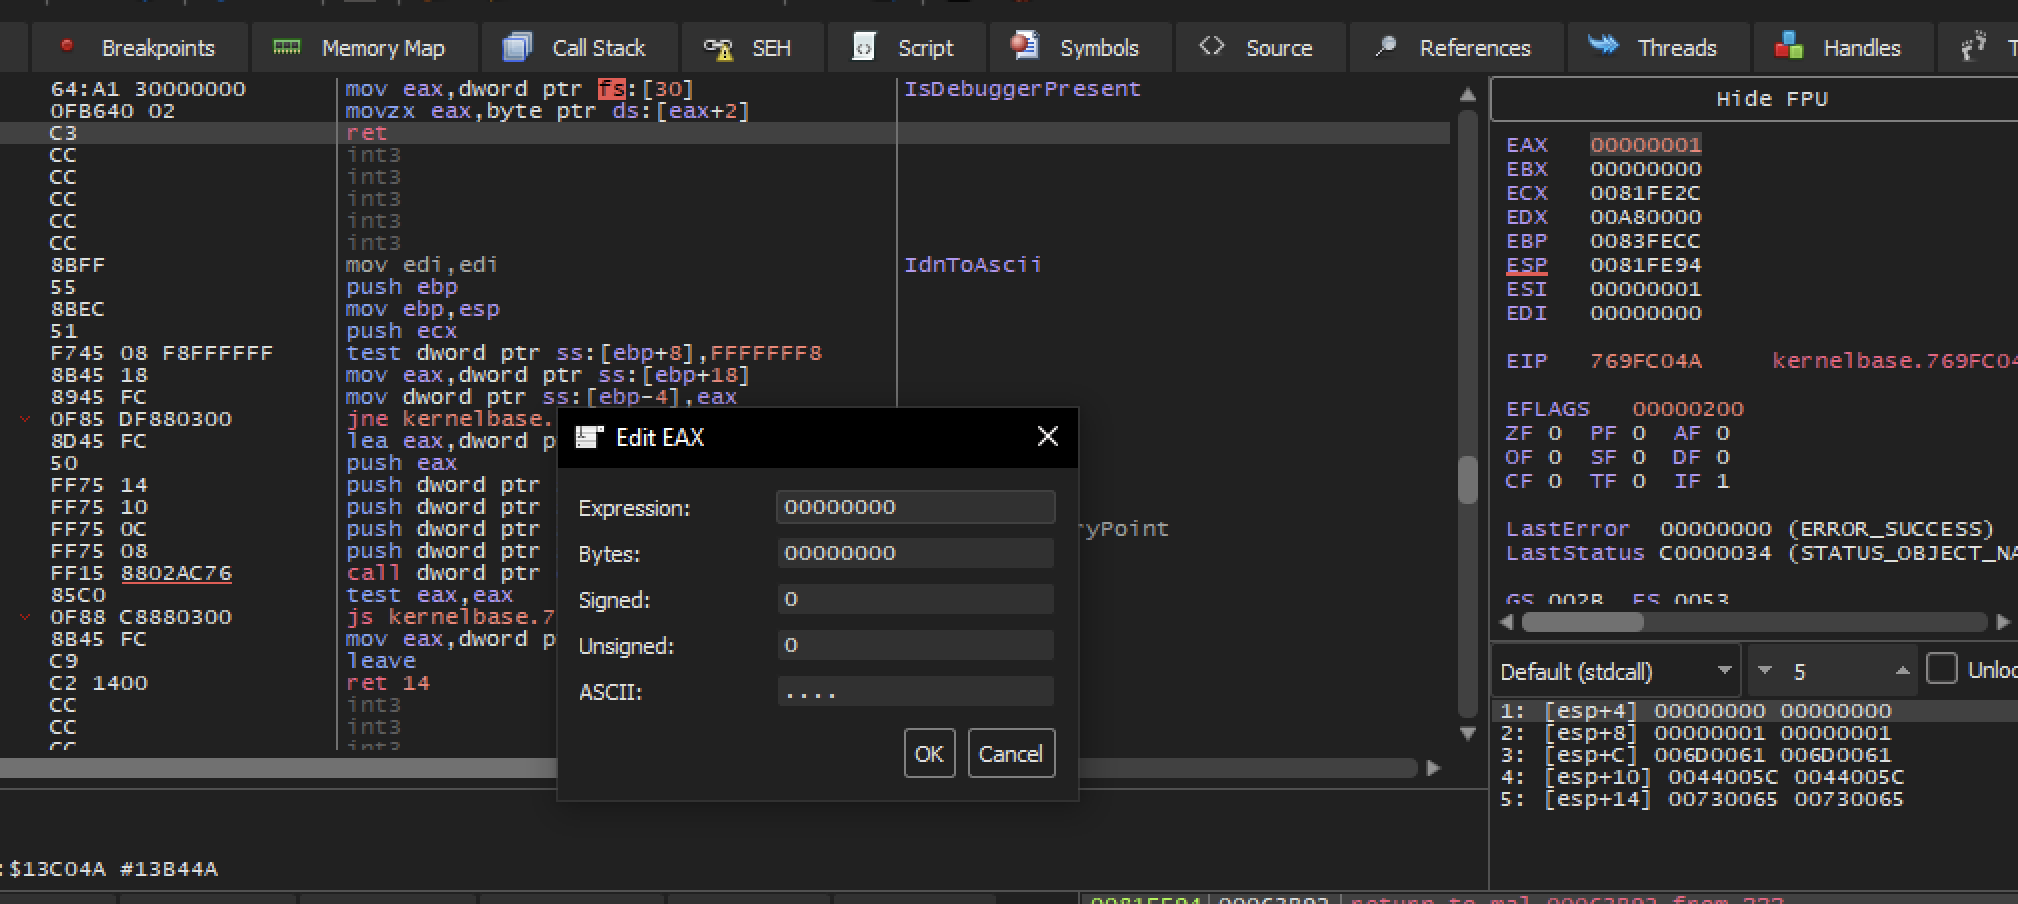
Now the IsDebuggerPresent is bypassed.