To understand API Unhooking, you first have to grasp the mechanics of API Hooking. At its core, hooking is a technique used to intercept function calls between a program and the Operating System.
Think of it like a "Man-in-the-Middle" attack, but happening entirely within the computer's memory.
How API Hooking Works
Normally, when an application wants to perform a task like opening a file or connecting to the internet it calls a function from a system library (like ntdll.dll or kernel32.dll on Windows).
The Normal Flow
CreateFile.CreateFile in the system DLL.The Hooked Flow (Inline Hooking)
Security software (EDRs/Antivirus) or malware will "hook" this process to monitor or block the action. The most common method is Inline Hooking (also known as "detouring"):
JMP (jump) instruction.JMP redirects the execution to a Hook Function controlled by the monitor.Static Analysis of Gazprom ransomware
Metadata
| Property | Value |
|---|---|
| MD5 | 0d0d964d5615bbf7c3576b852b8e30d2 |
| SHA-1 | cd455c8bea34b872dc1dcced141bed15b3b8d6c6 |
| SHA-256 | 32ec301f02dfa21932679726f07e30f9c807391aaf1044278c0e0b2c0dc8ebdf |
| Vhash | 025066655d1555555az44nz15z27z |
| Authentihash | fa9a08753a8dc988599a505ea9cc236339220d47ce4a44b8cc74f95da4f3563a |
| Imphash | 9cf1d77c3f5524c39deb8820c33fe708 |
| Rich PE Header Hash | f38ecbffd9fdf990024b468bf7130436 |
| SSDEEP | 3072:Js3LtgpfC21UaIgeR6nDWUgx+3xkDKPhNKdD/Z6bQpZUa:JC5gn1rIgeYq38hzhNKera |
| TLSH | T1E5341901F51FCBEAD69303BC4956A602FDB7328167248EEB83844A711D0B1D57AEDFA1 |
| File Type | Win32 EXE (executable, windows, win32, pe, peexe) |
| Magic | PE32+ executable (GUI) x86-64, for MS Windows |
| TrID | Win64 Executable (48.7%), Win16 NE (23.3%), OS/2 (9.3%), Win/DOS (9.2%), DOS (9.2%) |
| DetectItEasy | PE64; Compiler: MSVC (19.16.27049); Linker: MS Linker (14.16.27049); Tool: VS 2017 |
| Magika | PEBIN |
| File Size | 234.50 KB (240,128 bytes) |
PE Section
| Name | Entropy | File Ratio | Raw Address (Begin) | Raw Size | Virtual Address | Virtual Size |
|---|---|---|---|---|---|---|
| .text | 6.531 | 74.20% | 0x00000400 | 178,176 B | 0x00001000 | 177,834 B |
| .rdata | 4.873 | 17.06% | 0x0002BC00 | 40,960 B | 0x0002D000 | 40,634 B |
| .data | 2.790 | 4.69% | 0x00035C00 | 11,264 B | 0x00037000 | 15,796 B |
| .pdata | 5.245 | 2.56% | 0x00038800 | 6,144 B | 0x0003B000 | 5,688 B |
| .rsrc | 4.718 | 0.21% | 0x0003A000 | 512 B | 0x0003D000 | 480 B |
| .reloc | 4.889 | 0.85% | 0x0003A200 | 2,048 B | 0x0003E000 | 1,616 B |
IMPORTS
| Category | Key Functions | Library |
|---|---|---|
| File I/O | CreateFileW, WriteFile, SetFilePointerEx, FlushFileBuffers | KERNEL32.dll |
| Networking | htons, WSAGetLastError | WS2_32.dll |
| Anti-Analysis | IsDebuggerPresent, IsProcessorFeaturePresent | KERNEL32.dll |
| Process/Thread | GetCurrentProcess, TerminateProcess, ExitProcess, TlsAlloc | KERNEL32.dll |
| Memory/Heap | HeapAlloc, HeapFree, GetProcessHeap, HeapReAlloc | KERNEL32.dll |
| System Info | GetSystemTimeAsFileTime, GetLocalTime, GetCommandLineW | KERNEL32.dll |
| Dynamic Loading | GetProcAddress, LoadLibraryExW, FreeLibrary | KERNEL32.dll |
| Error/Exception | GetLastError, UnhandledExceptionFilter, RaiseException | KERNEL32.dll |
| UI/Strings | wsprintfW, MultiByteToWideChar, WriteConsoleW | USER32 / KERNEL32 |
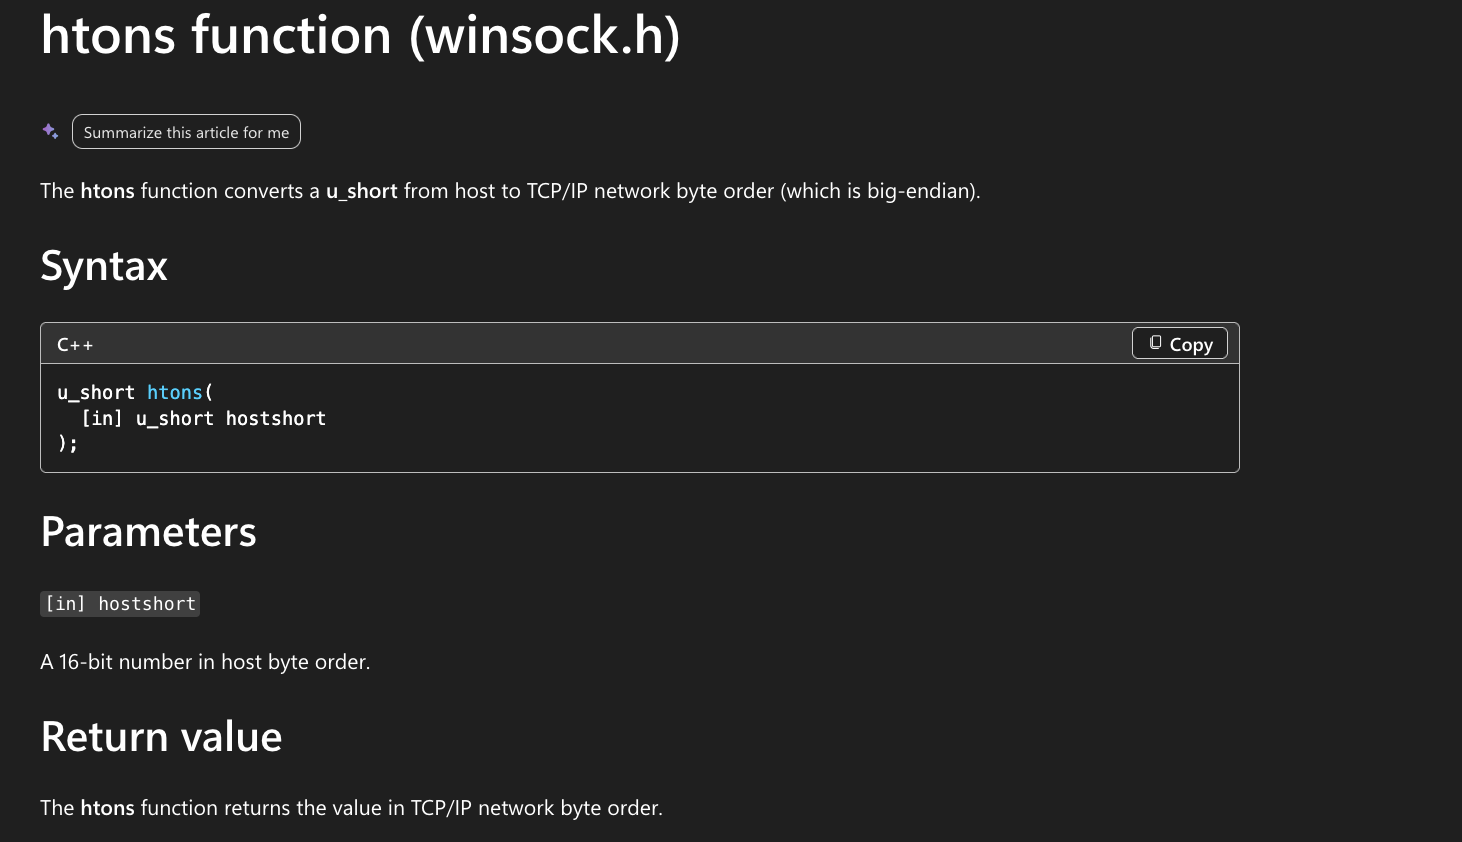
Among the many imports there’s a htons

This function converts a number in host byte order to network byte order. Malware’s often uses this API to specify a destination port before it communicates across a network. Simply the single argument passed to this api could specify a network port used by this malware during execution.
Patching the Sample
open the sample in x64dbg.
place a breakpoint on htons .
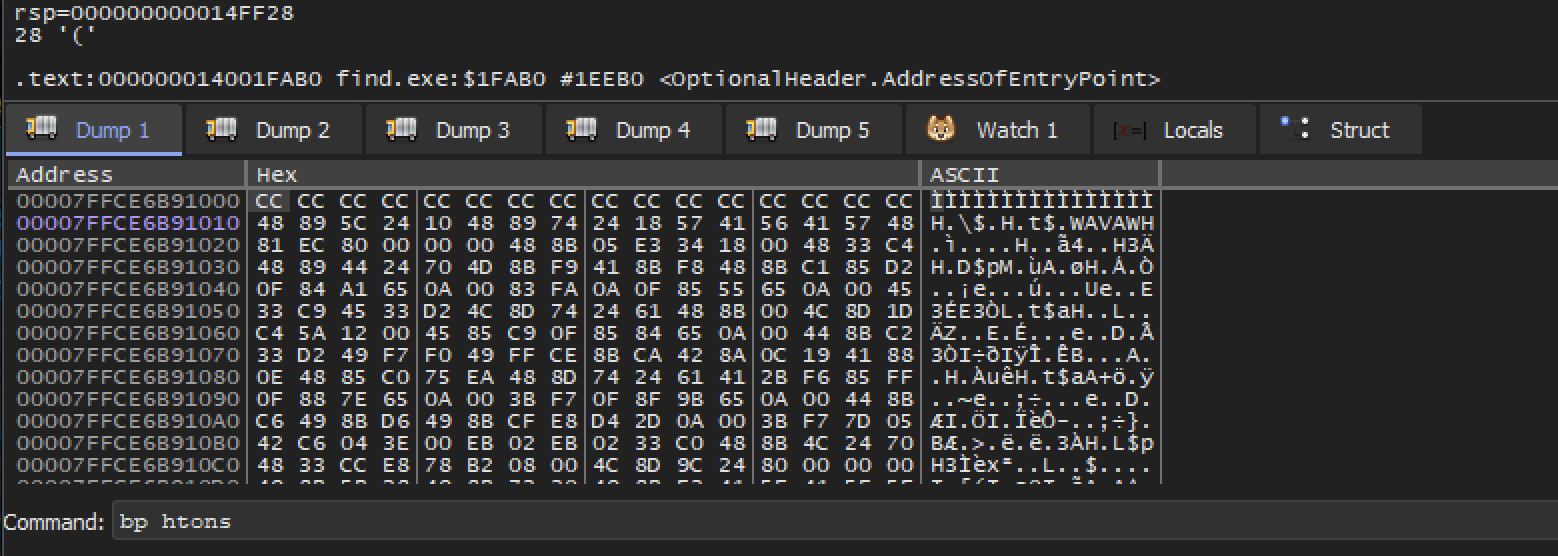
A Single argument passed to htons contained in the RCX register is 1BD .
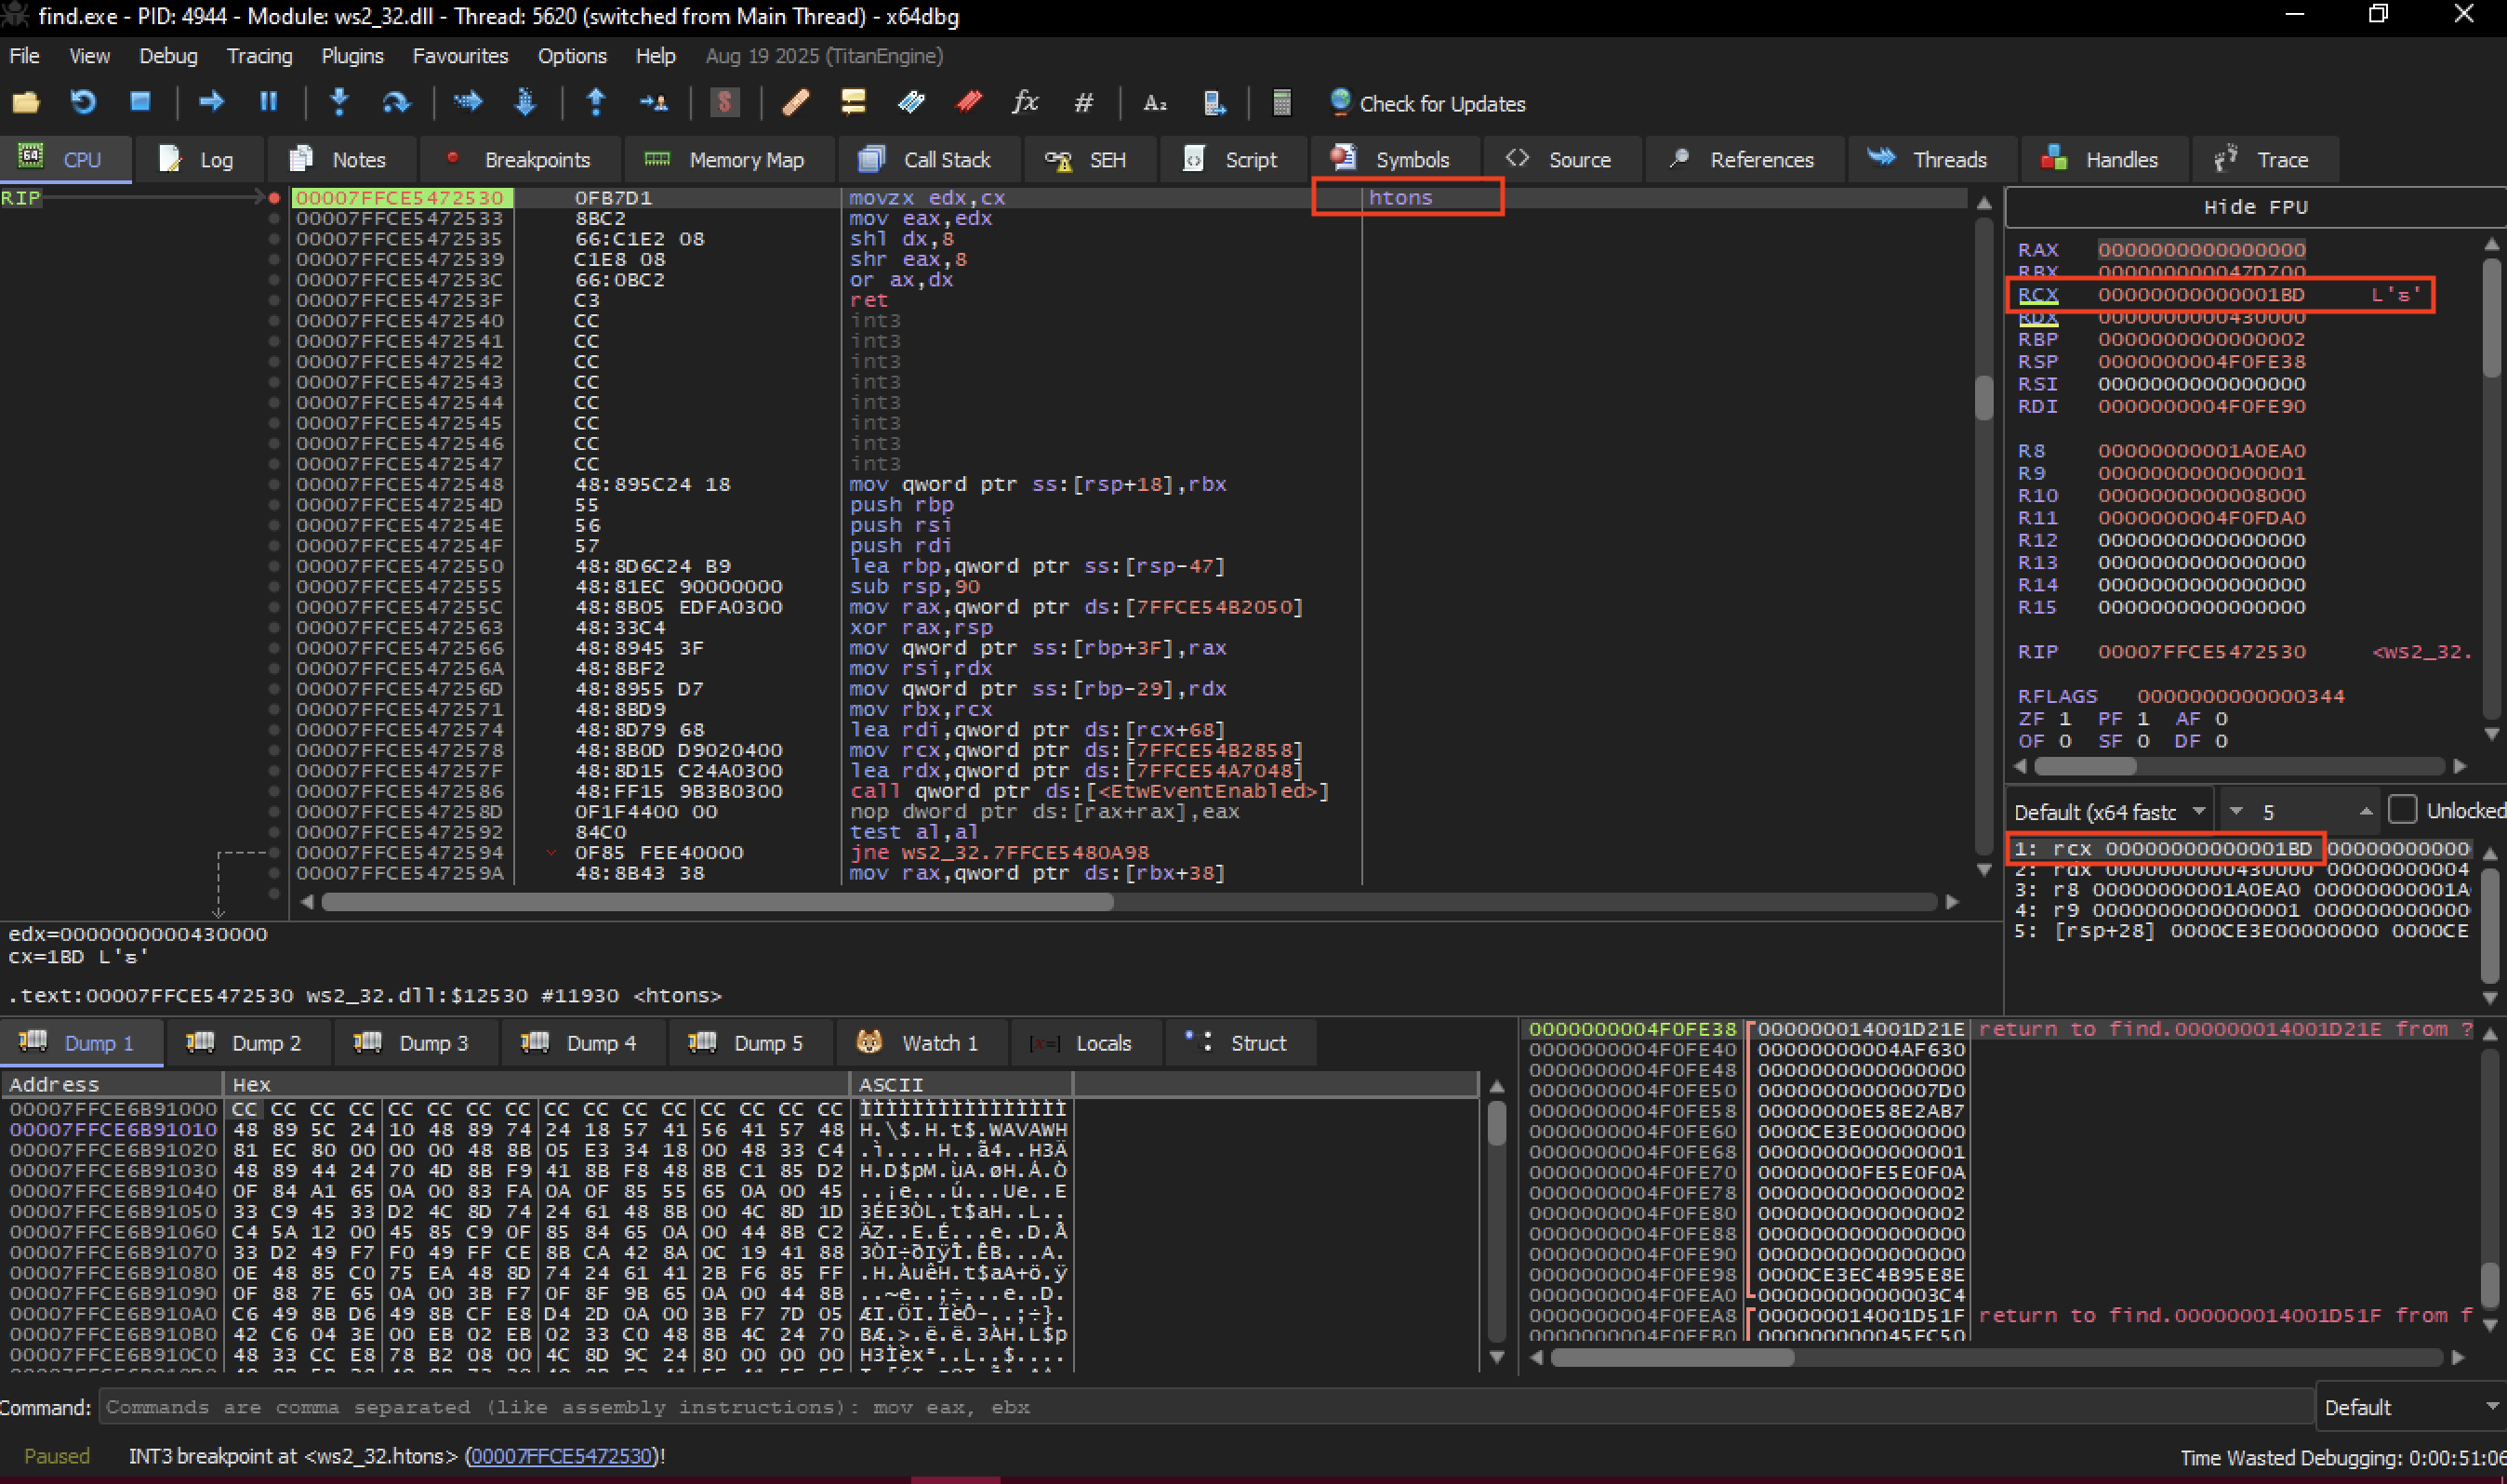
1BD translates to decimal 445
Ransomwares often scan the local network targeting 445 aka SMB service in order to identify file shares. So from defence prespective it’s make sense to hook this api to understand if any such network activity is contained within the malware.
We will hook the htons function. To do so we need to modify this sample.
Now remove the htons breakpoint and restart the program.
We will replace the first instruction:

right click —> binary —> edit
edit the opcode:
FROM:
48 83 EC 28TO:
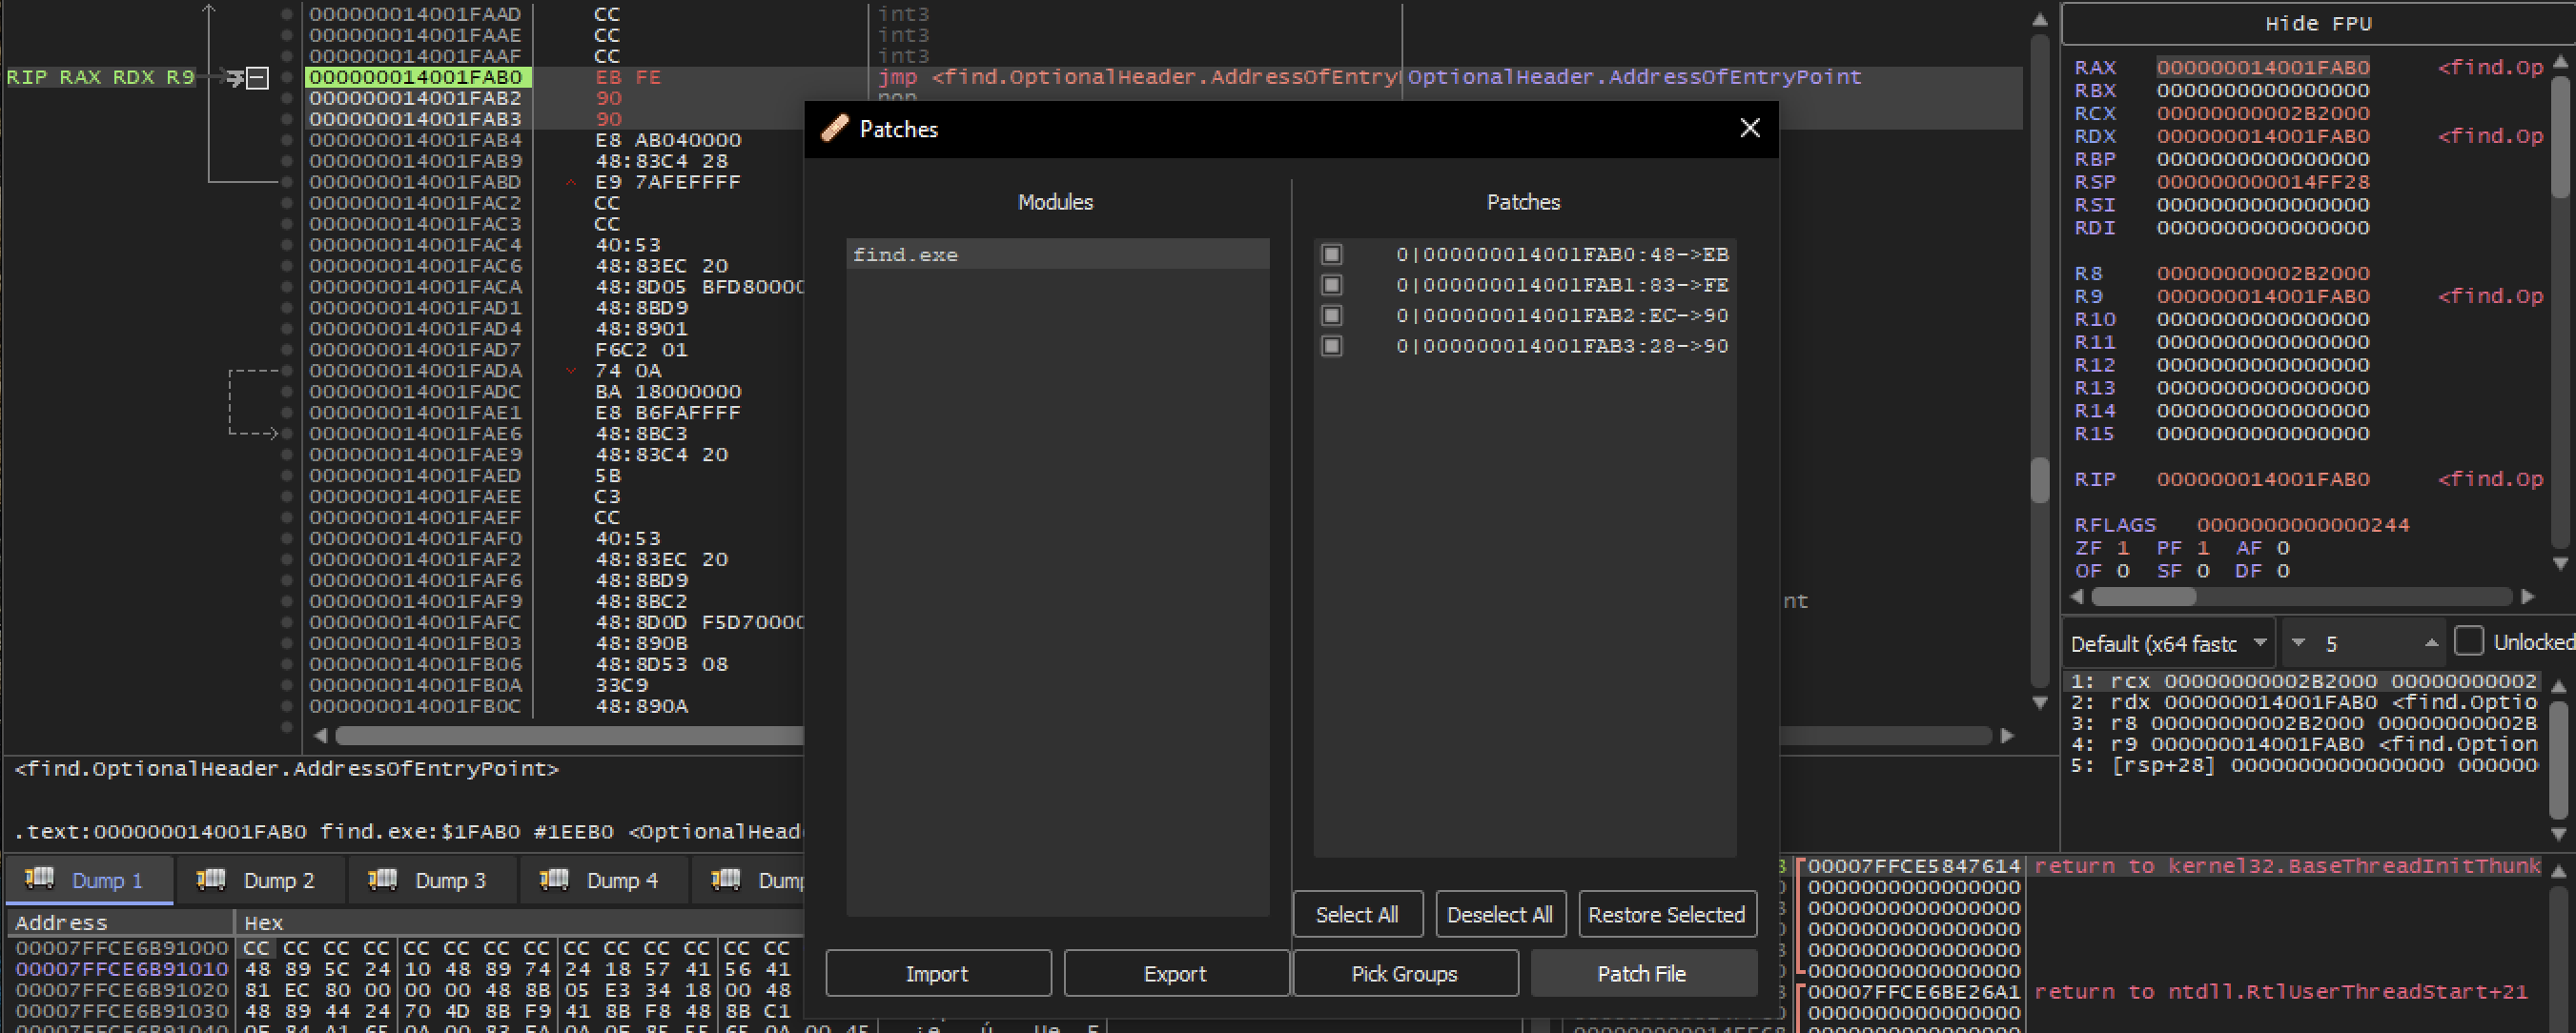
EB FE 90 90like this:
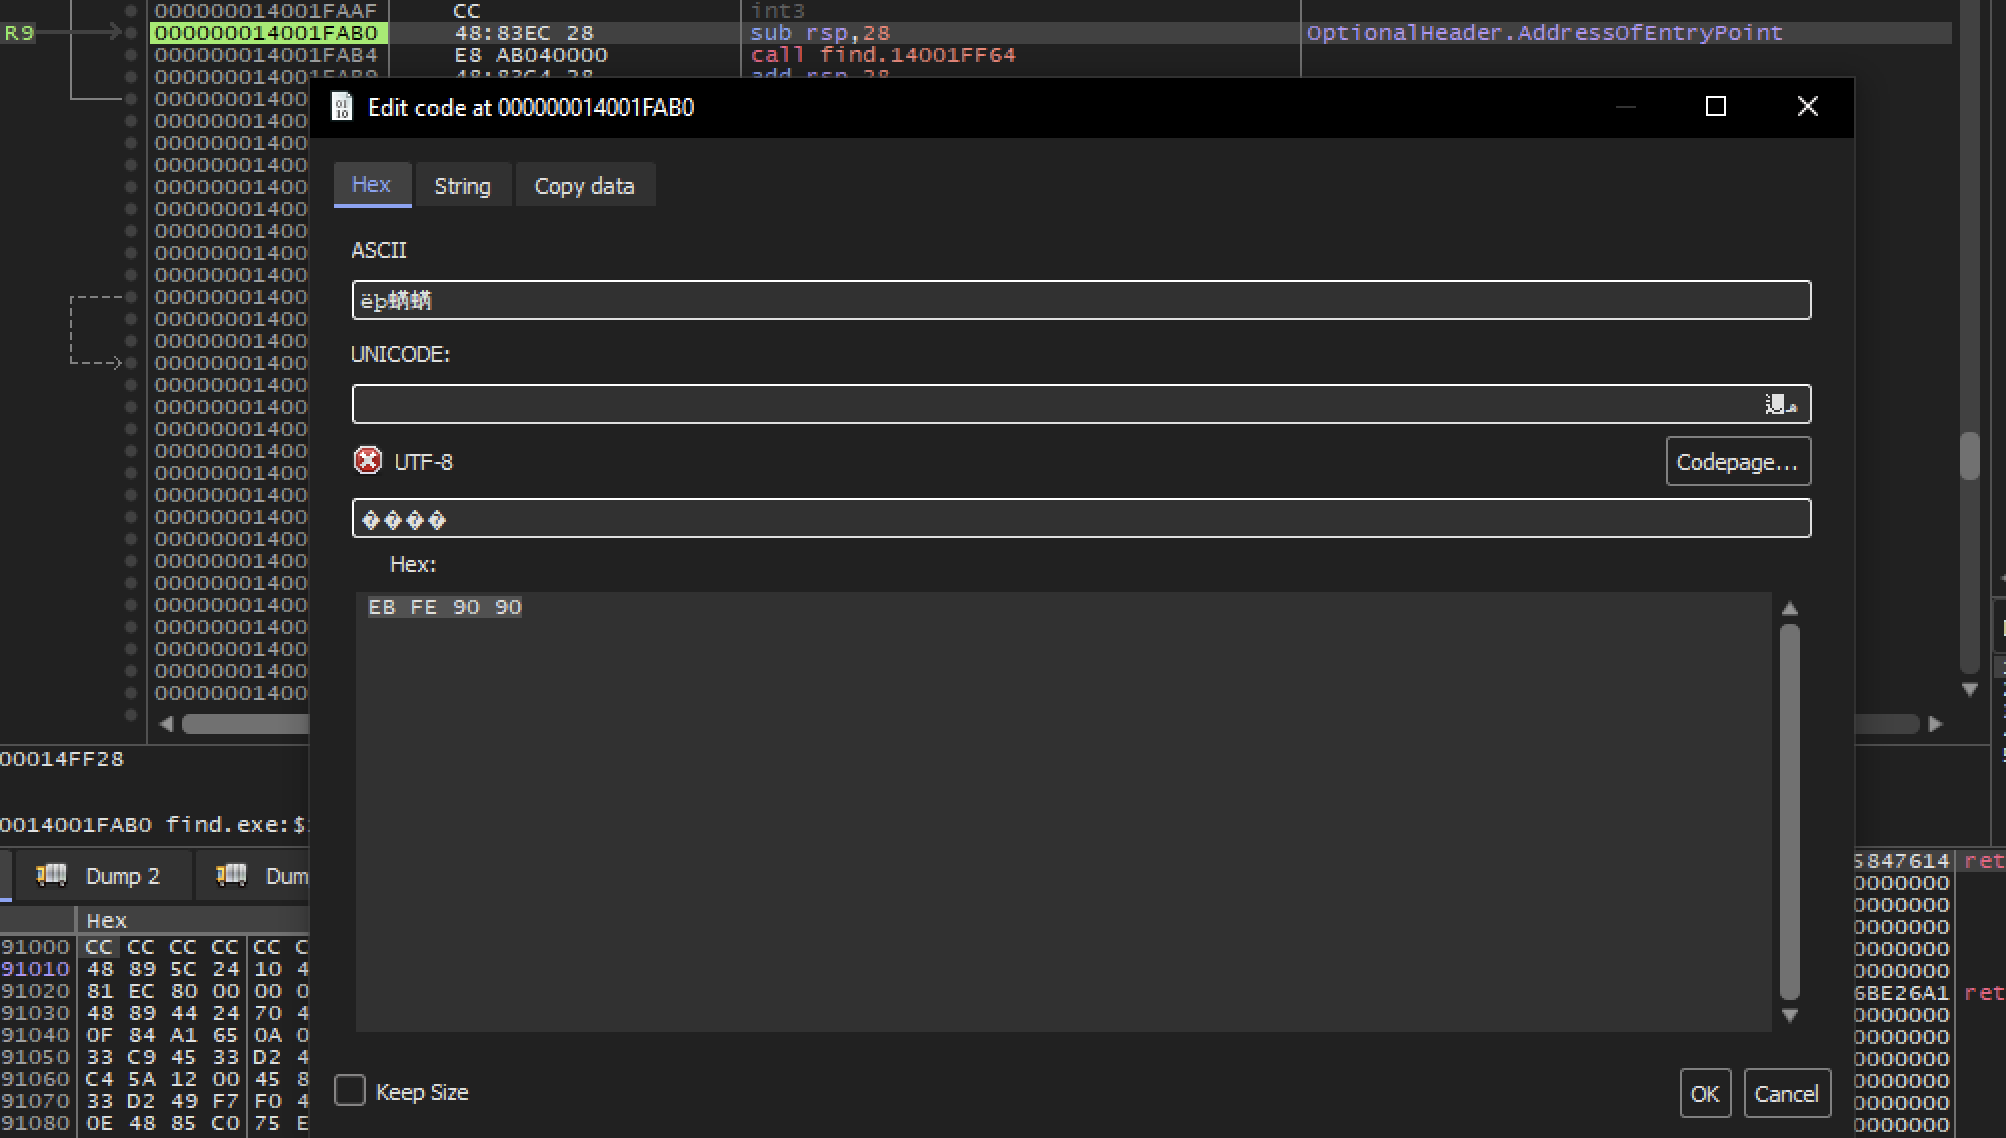
click ok.
Now it will effectively replace the previous instructions with a jmp instruction whose target is this very jmp instruction.

This infinite loop will allow me to launch this program using frida-trace and attach to it a debugger, such that i arrive at the entry point. Without make this change the malware might execute and then terminate before attach to it with debugger.
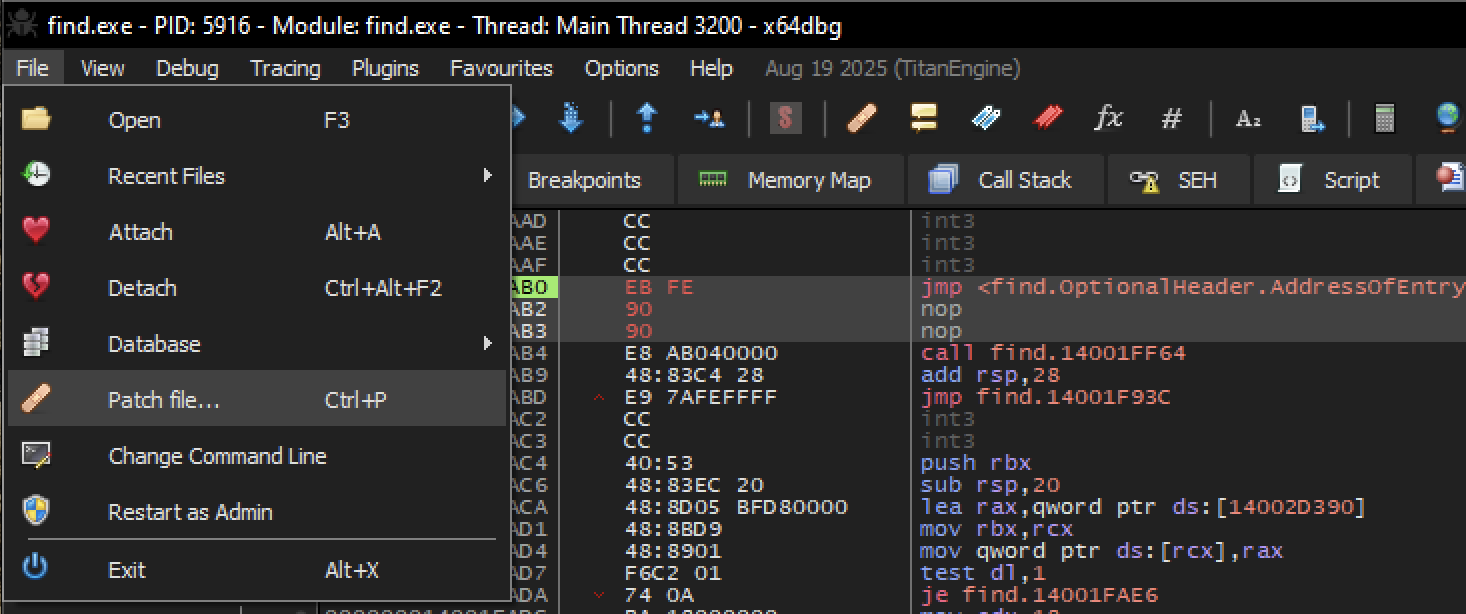
Now save this patch version.
go to file —> patch file —> patch file then save it with .exe
Hooking with frida-trace
Now we will launch frida-trace specifying the modified version of the sample.
C:\Users\redteam\Desktop\api-unhook>frida-trace -f patched.exe -i htons
Instrumenting...
htons: Auto-generated handler at "C:\Users\redteam\Desktop\api-unhook\handlers\WS2_32.dll\htons.js"
Started tracing 1 function. Web UI available at http://localhost:50679/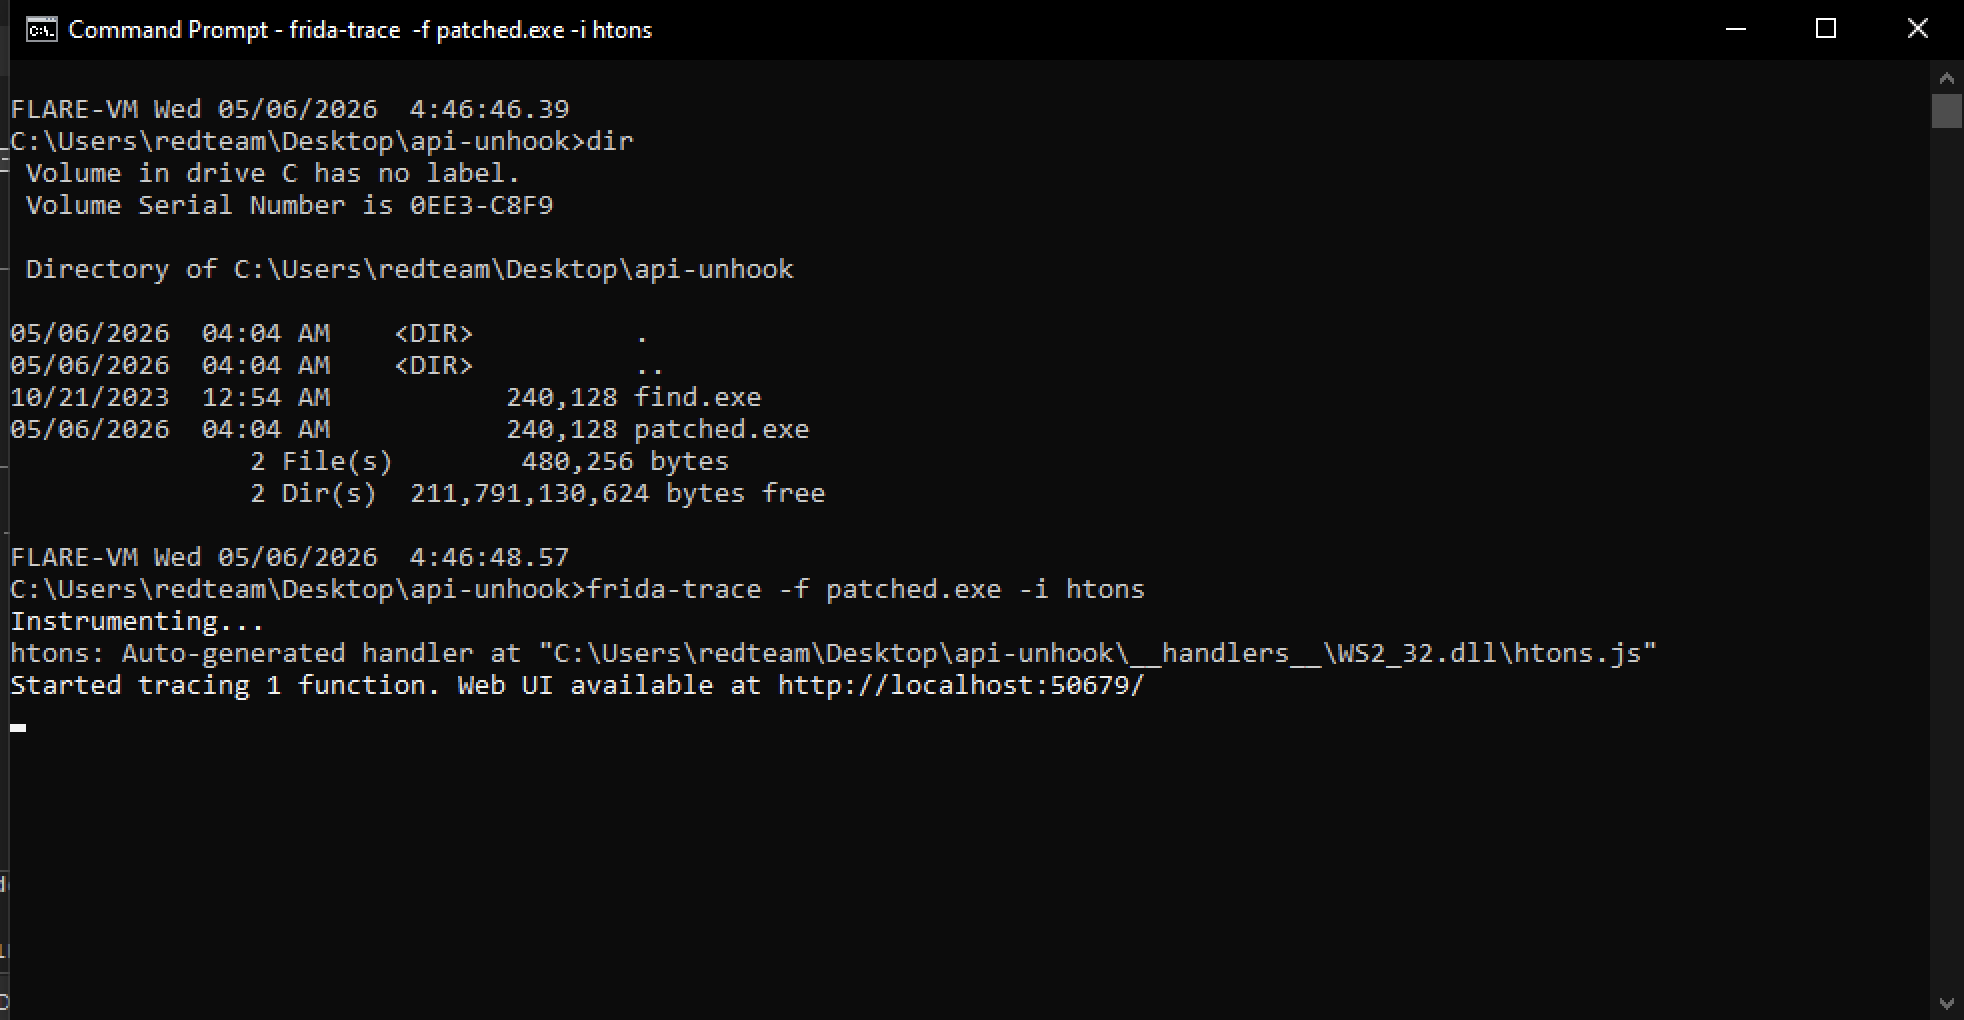
Attaching to x64dbg
Next launch x64dbg and attach to the patched.exe
go to file —> attach then select modified patched program.
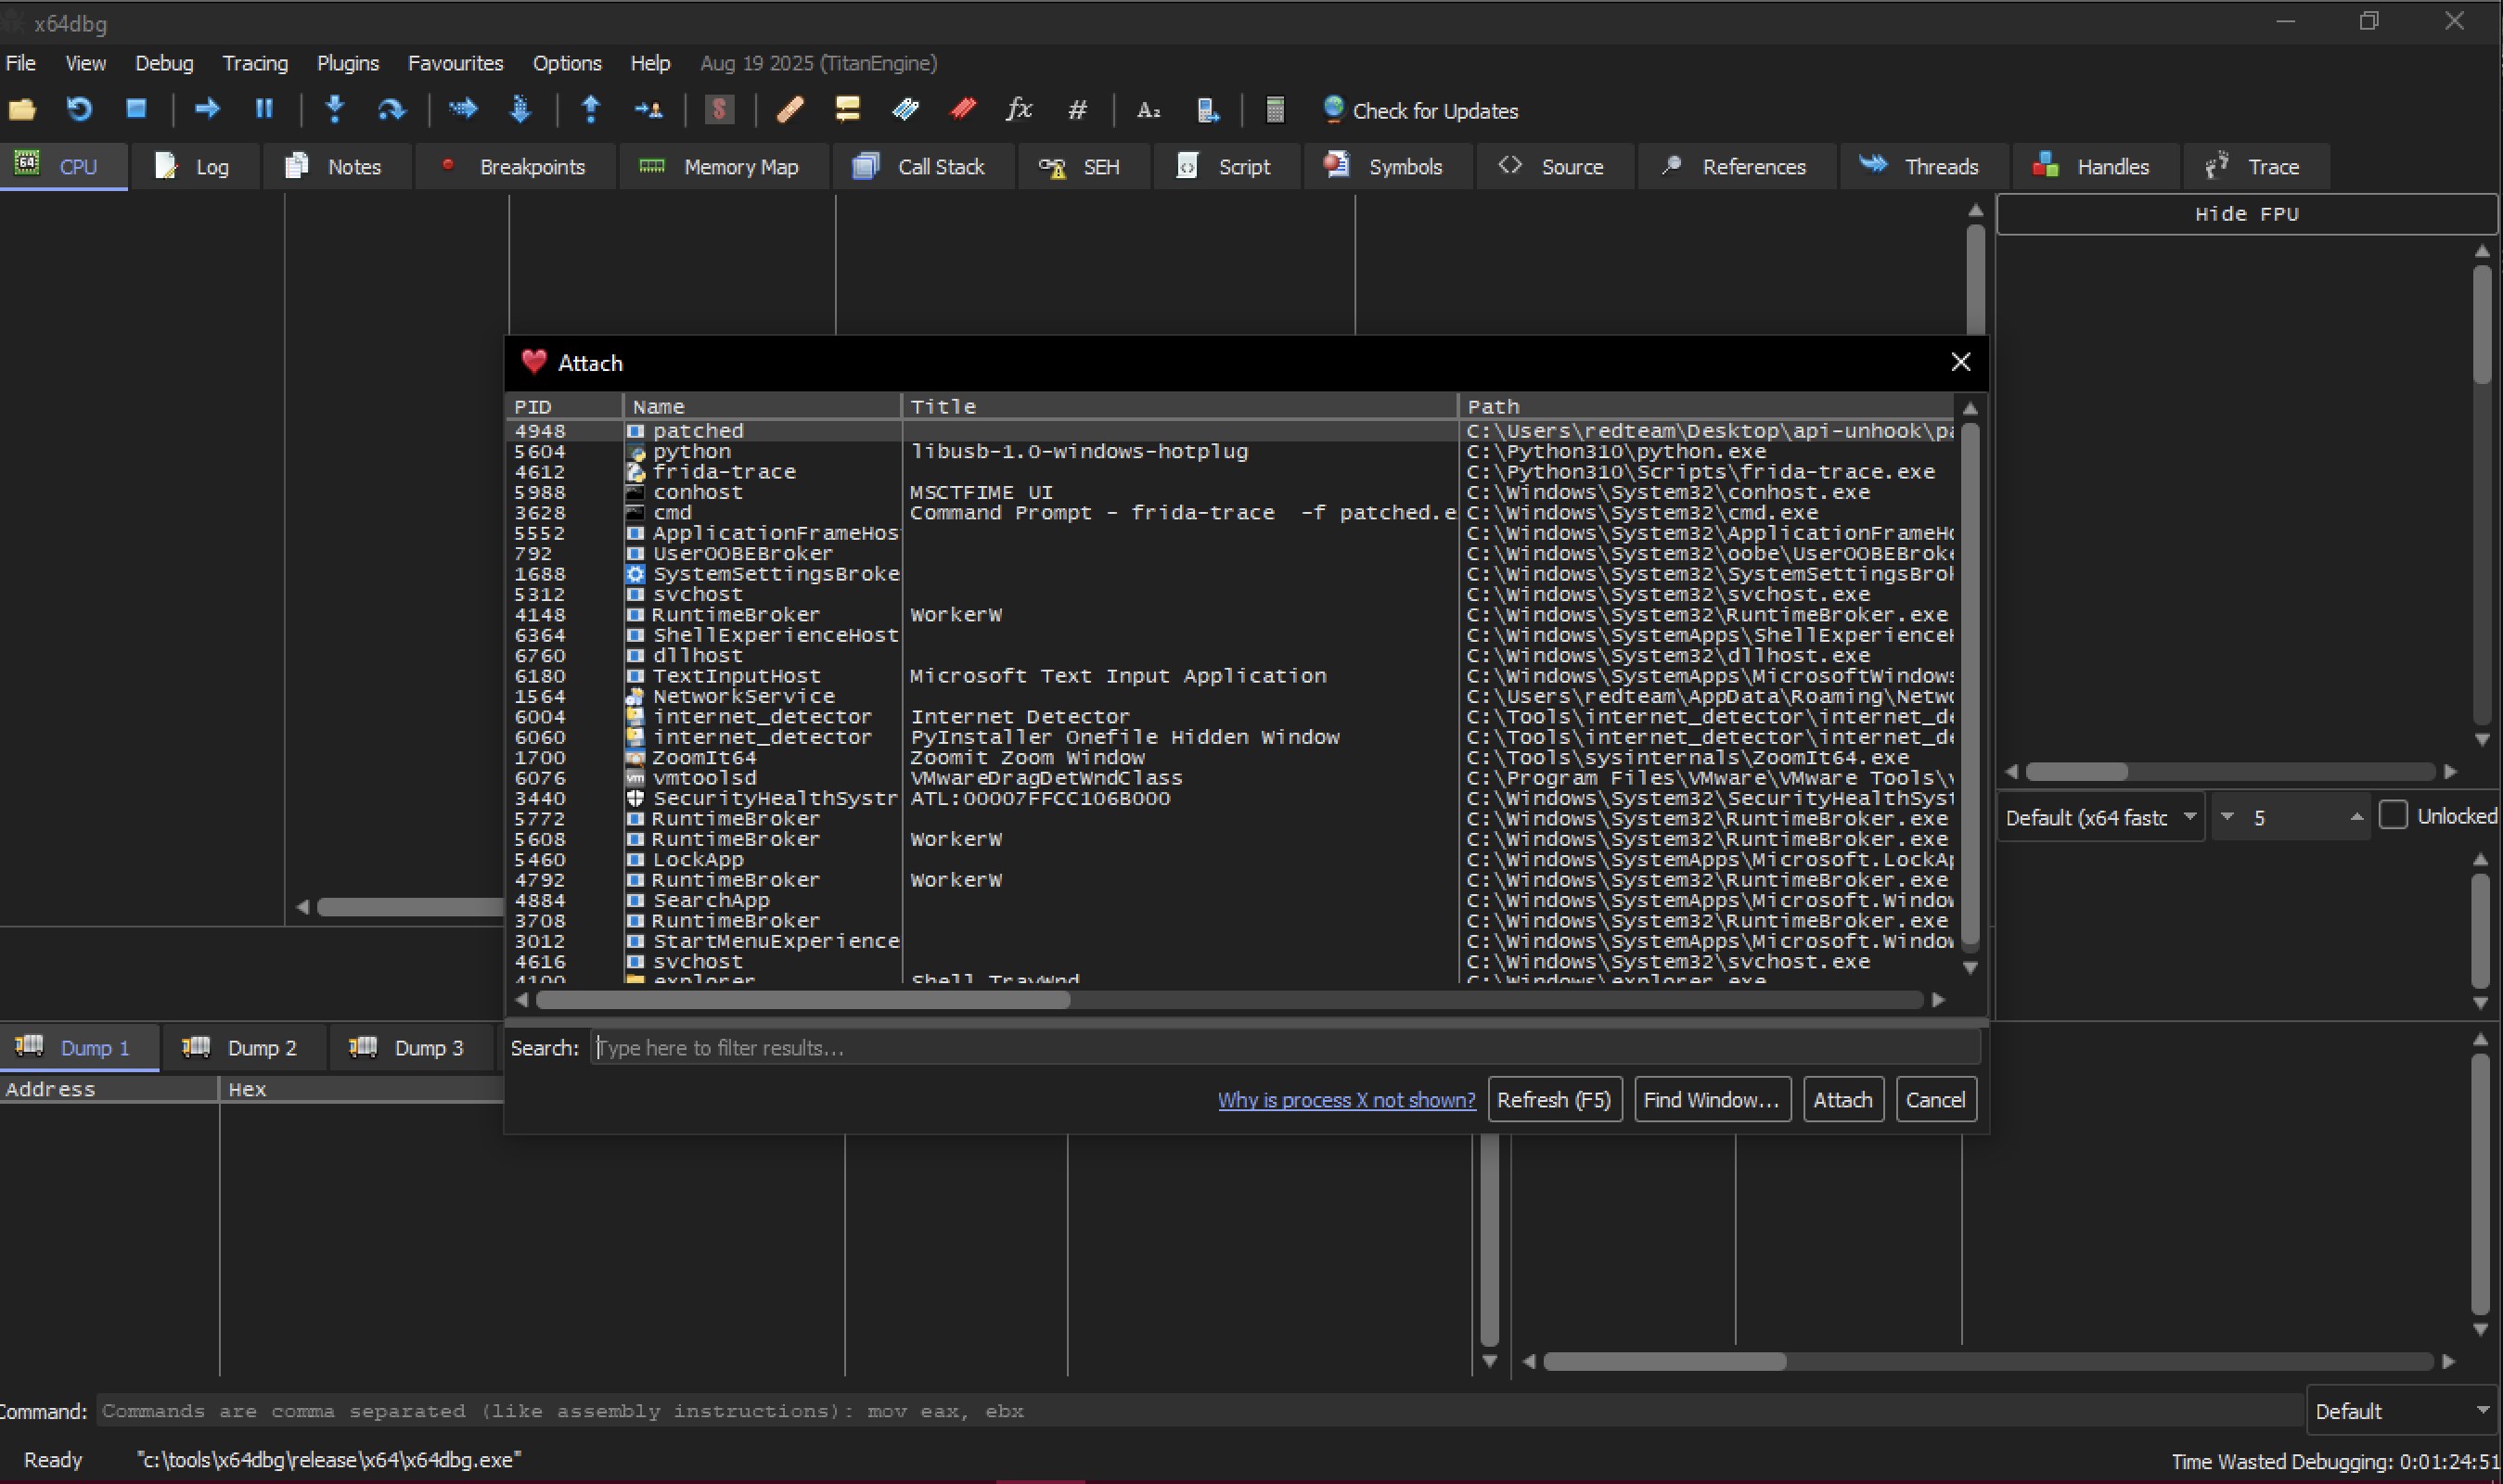
The program is running.
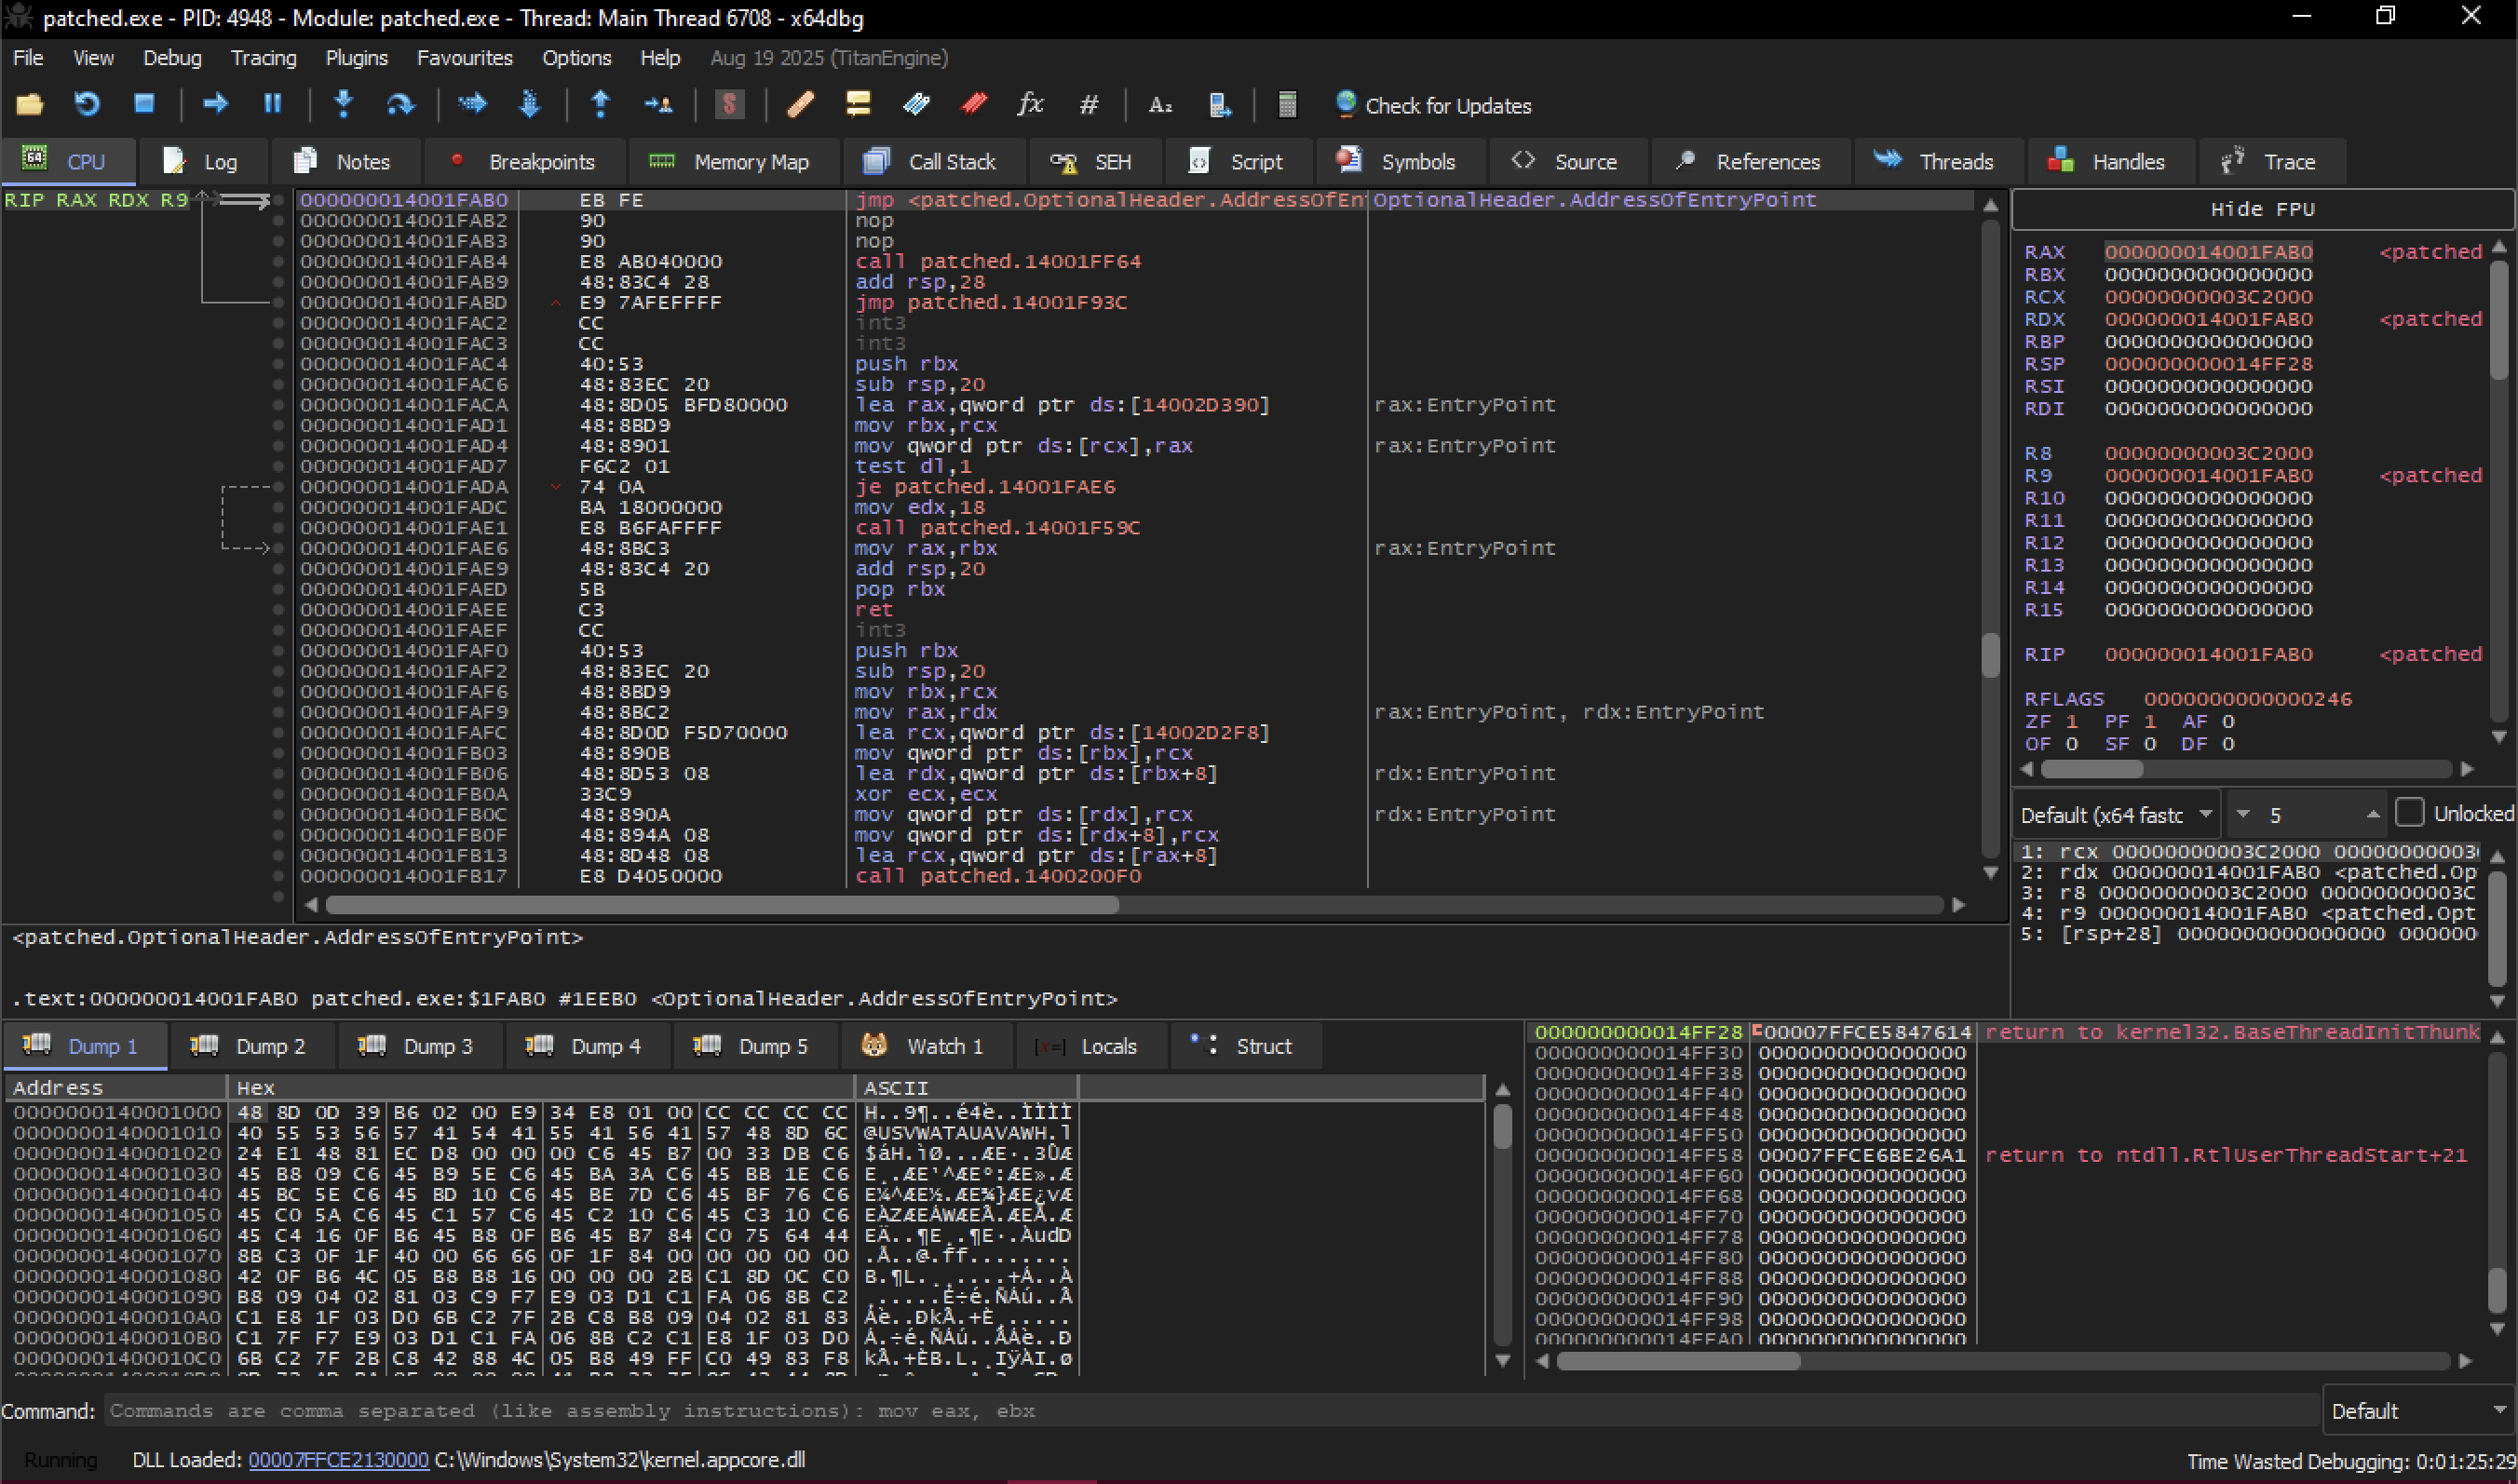
Because of the infinite loop it cannot proceed passed the instruction.
I will set breakpoint on this jump.

Now the program is paused at the entry point.
While it’s paused let’s take a look at the hooked version of htons.
ctlr + g to follow expression
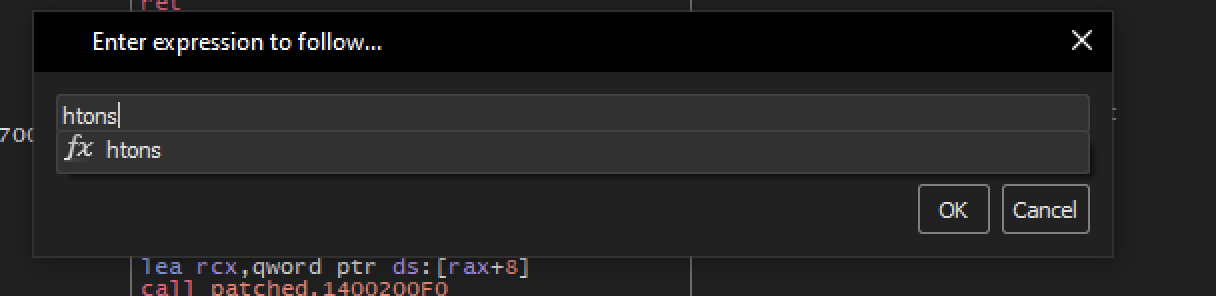
Notice the first intructions is now a jmp.

Original it was:

So if we follow jmp 7FFCE6B80308 this will take us to the injected dll associated with frida.
following jmp 7FFCE6B80308

Next Following:
00007FFCE6B8030E | FF25 02000000 | jmp qword ptr ds:[7FFCE6B80316] |
leads to this location
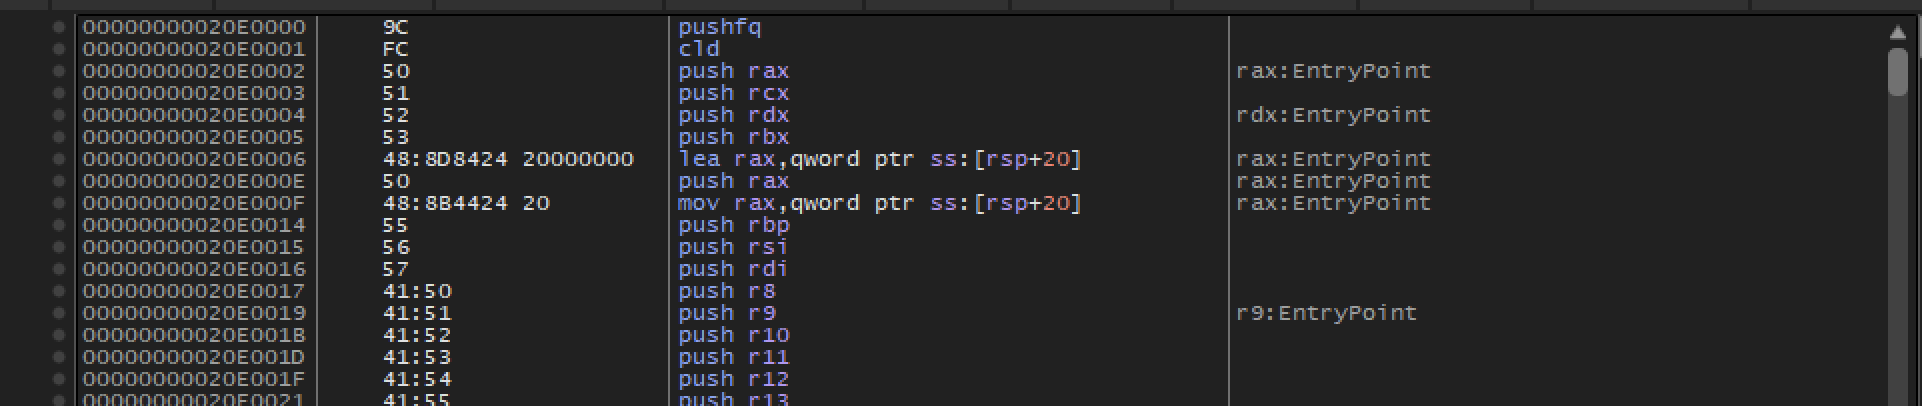
scroll down will get another jump or a call.
follow the call instruction.

Take look at the top it’s a frida-agent.dll
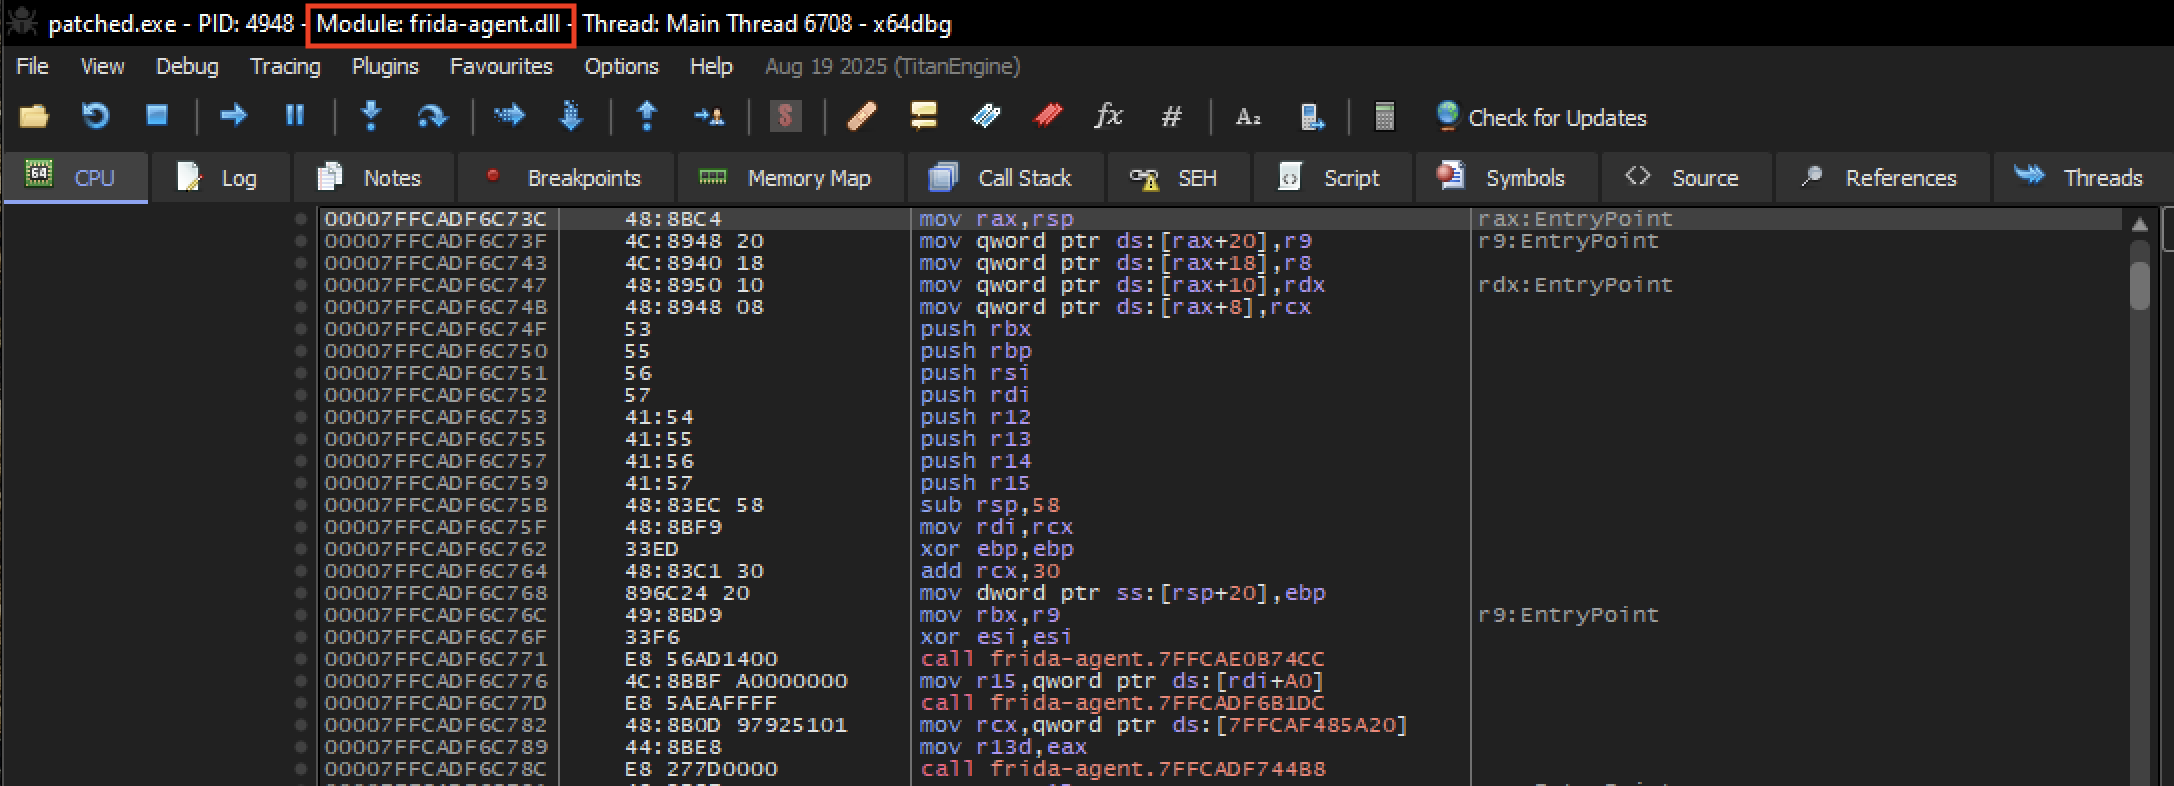
Back to the topic
How this malware actually identifies a hooked function by inspecting the first bytes of an API
get back to htons: ctrl + g enter htons.
We will set hardware on access breakpoint on htons to observe how this ransomware actually evaluates the initial bytes of the api.

to do so right click —> follow in dump —> selected address.
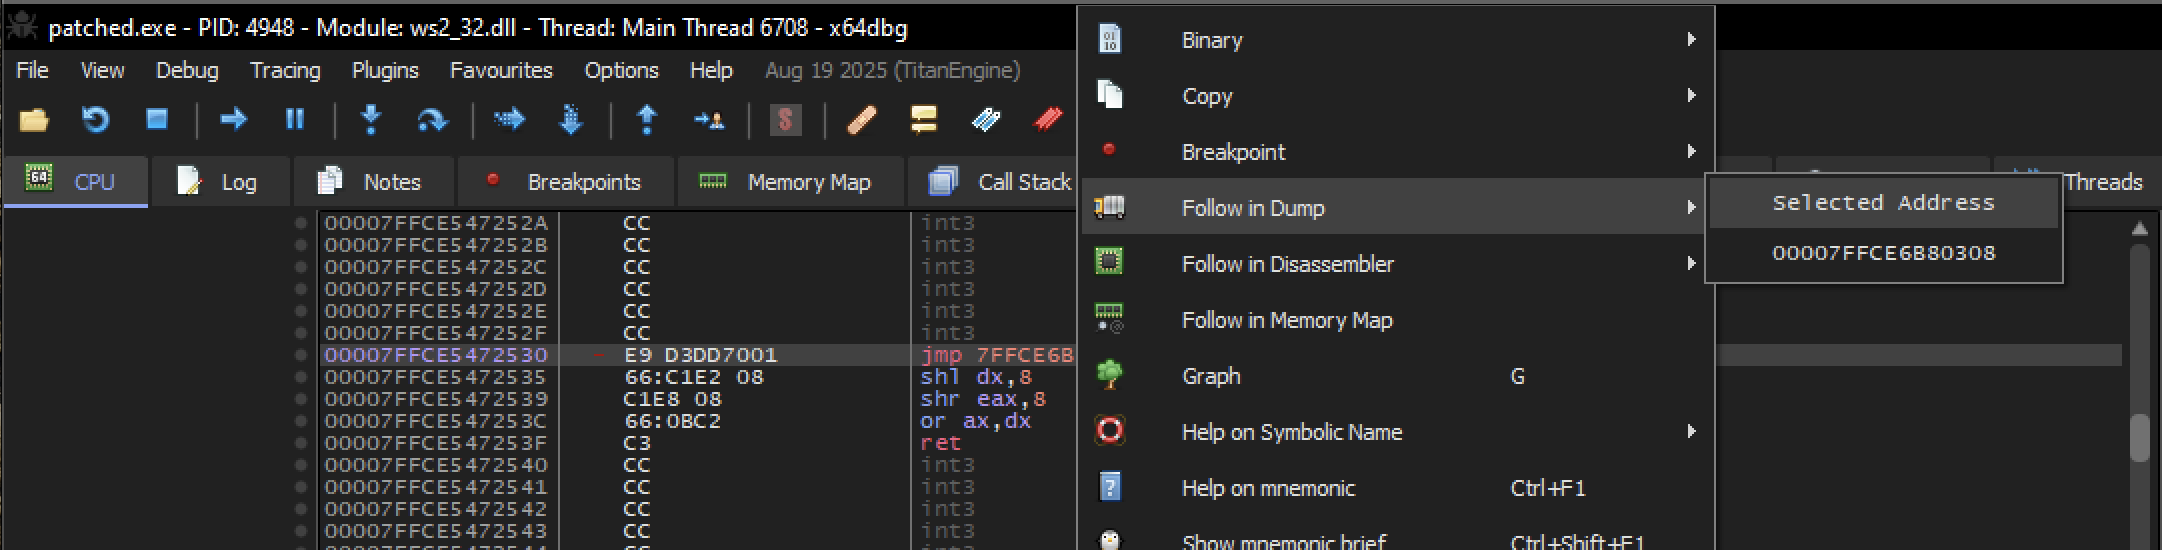
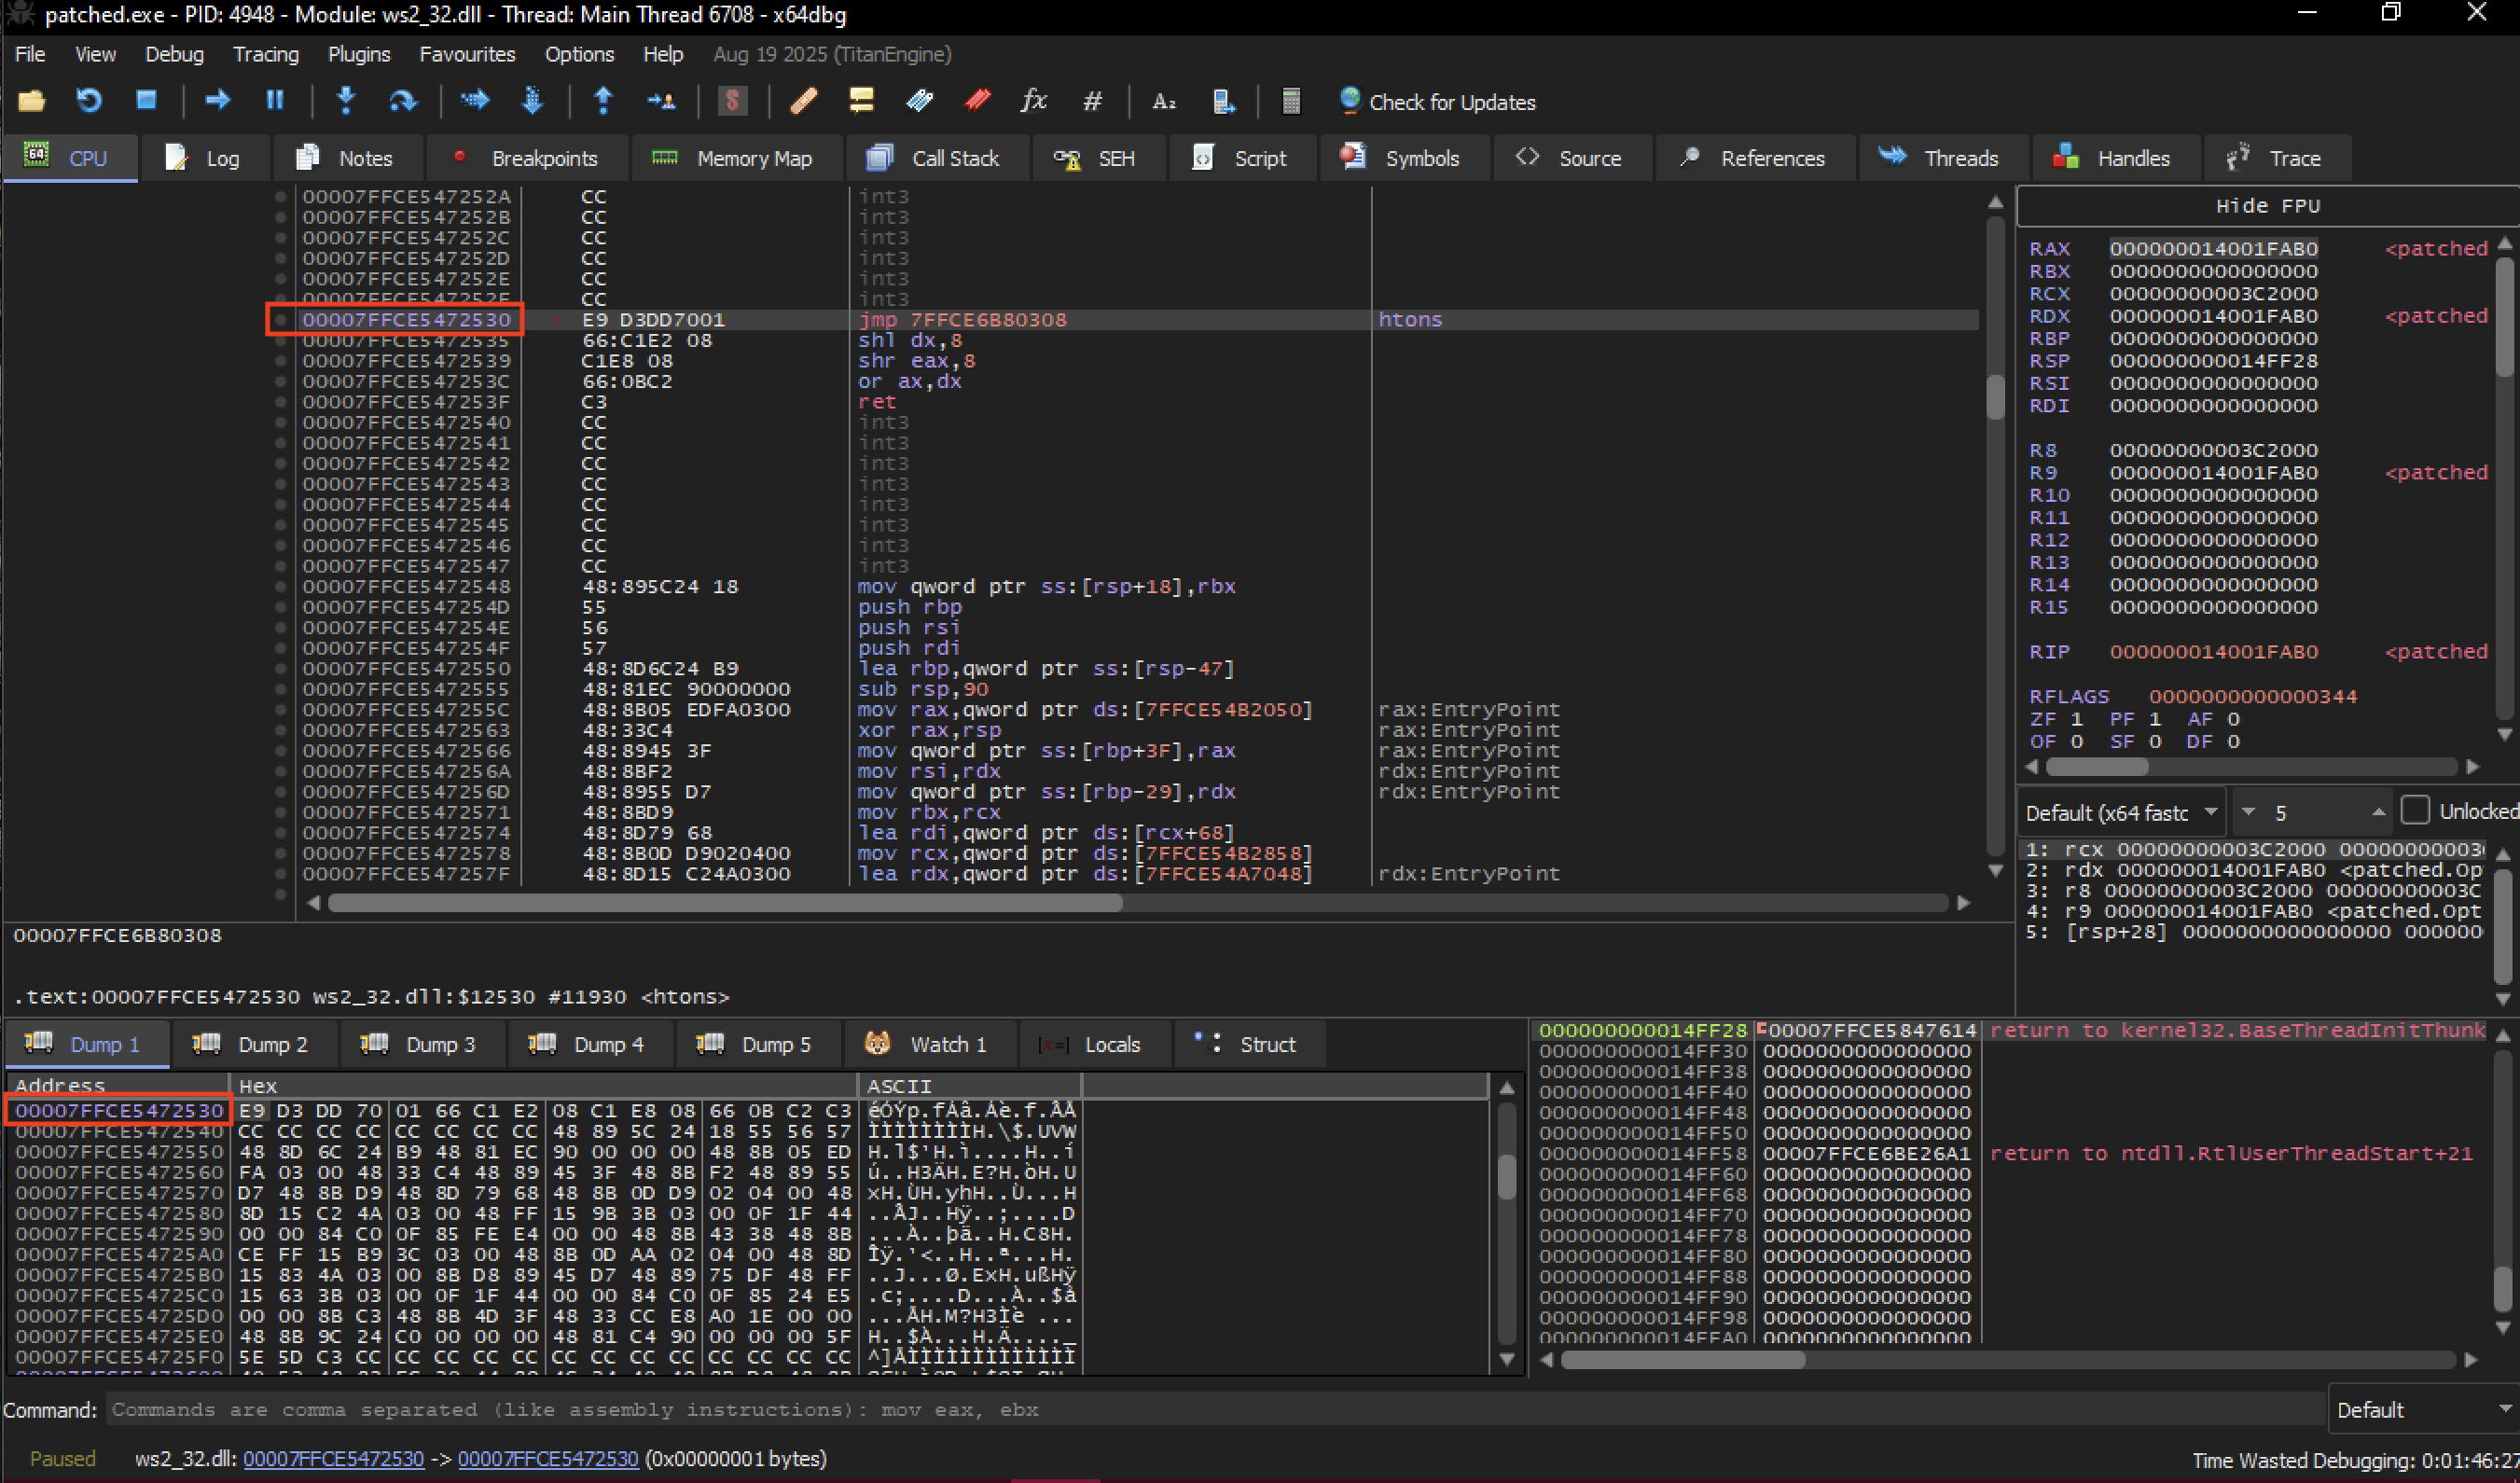
Notice the matching addresses: you can see the hex E9 in the dump correlates with the opcode of jmp instruction.
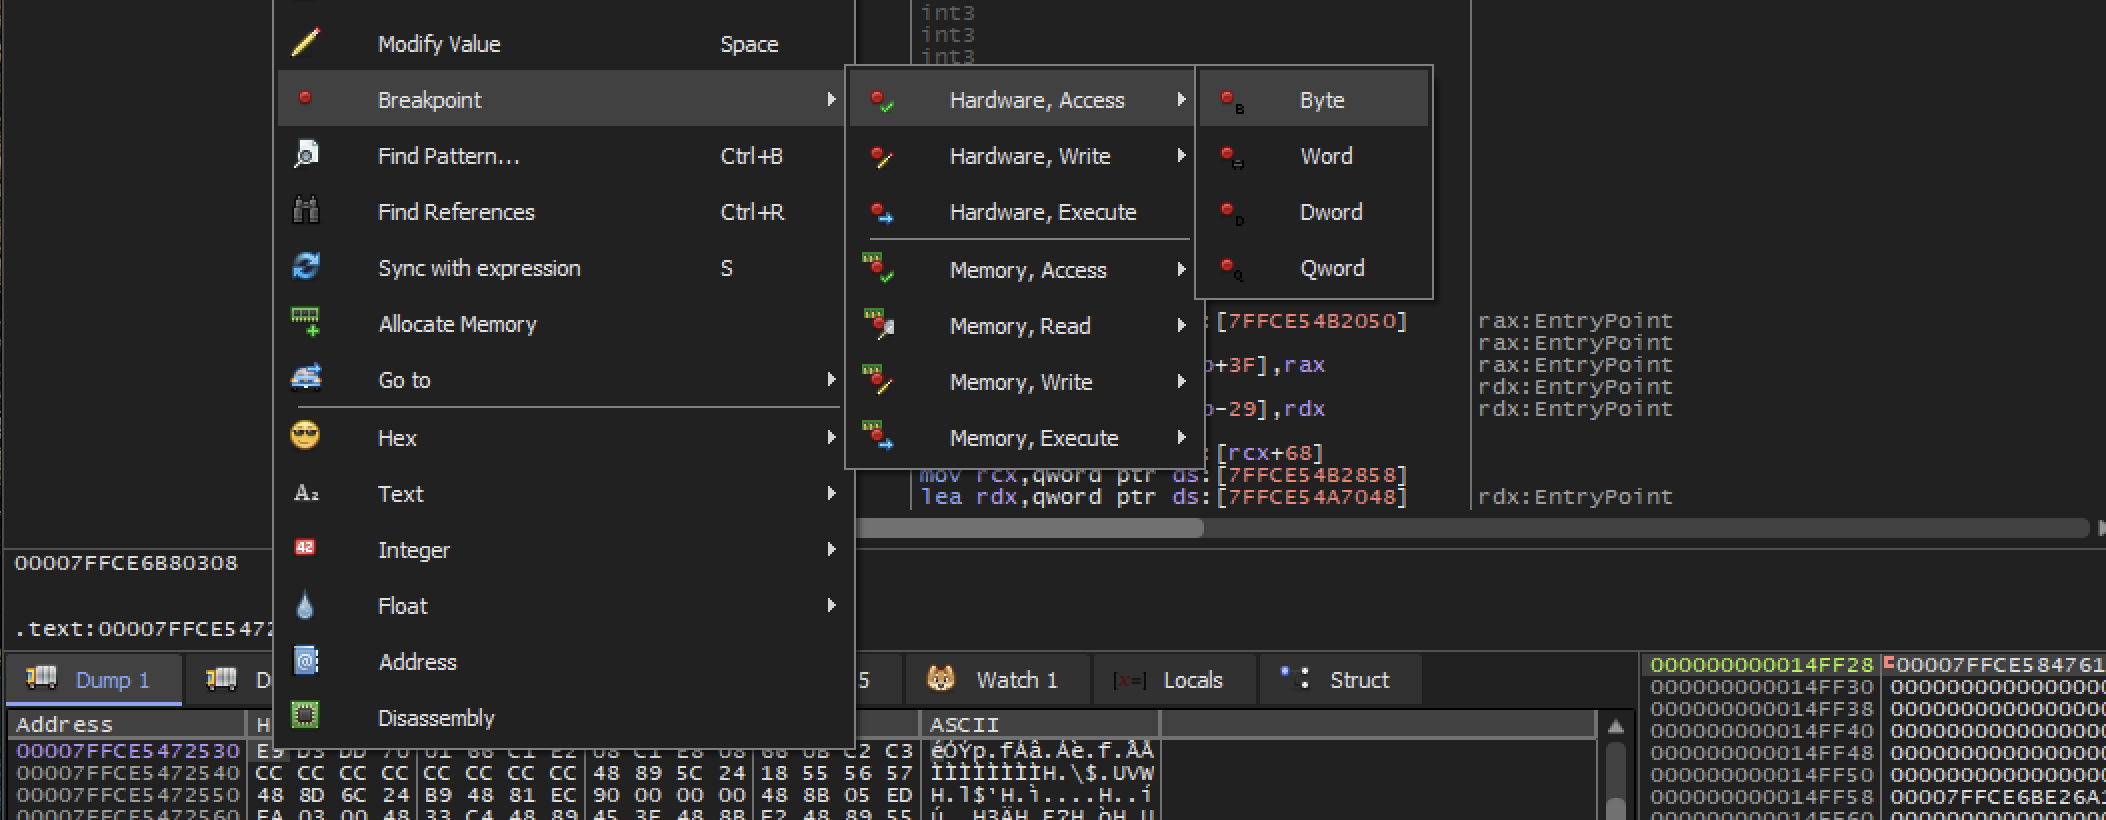
Set the Hardware access breakpoint:
right click on E9.
now before running the program return to the entry point. To do so press shift + * will take back to the entry point.

You can see the infinite loop is still there, now we have to replace these instructions with the original ones.
Select first 4 bytes then edit.

now type the original opcode which is
48 83 EC 28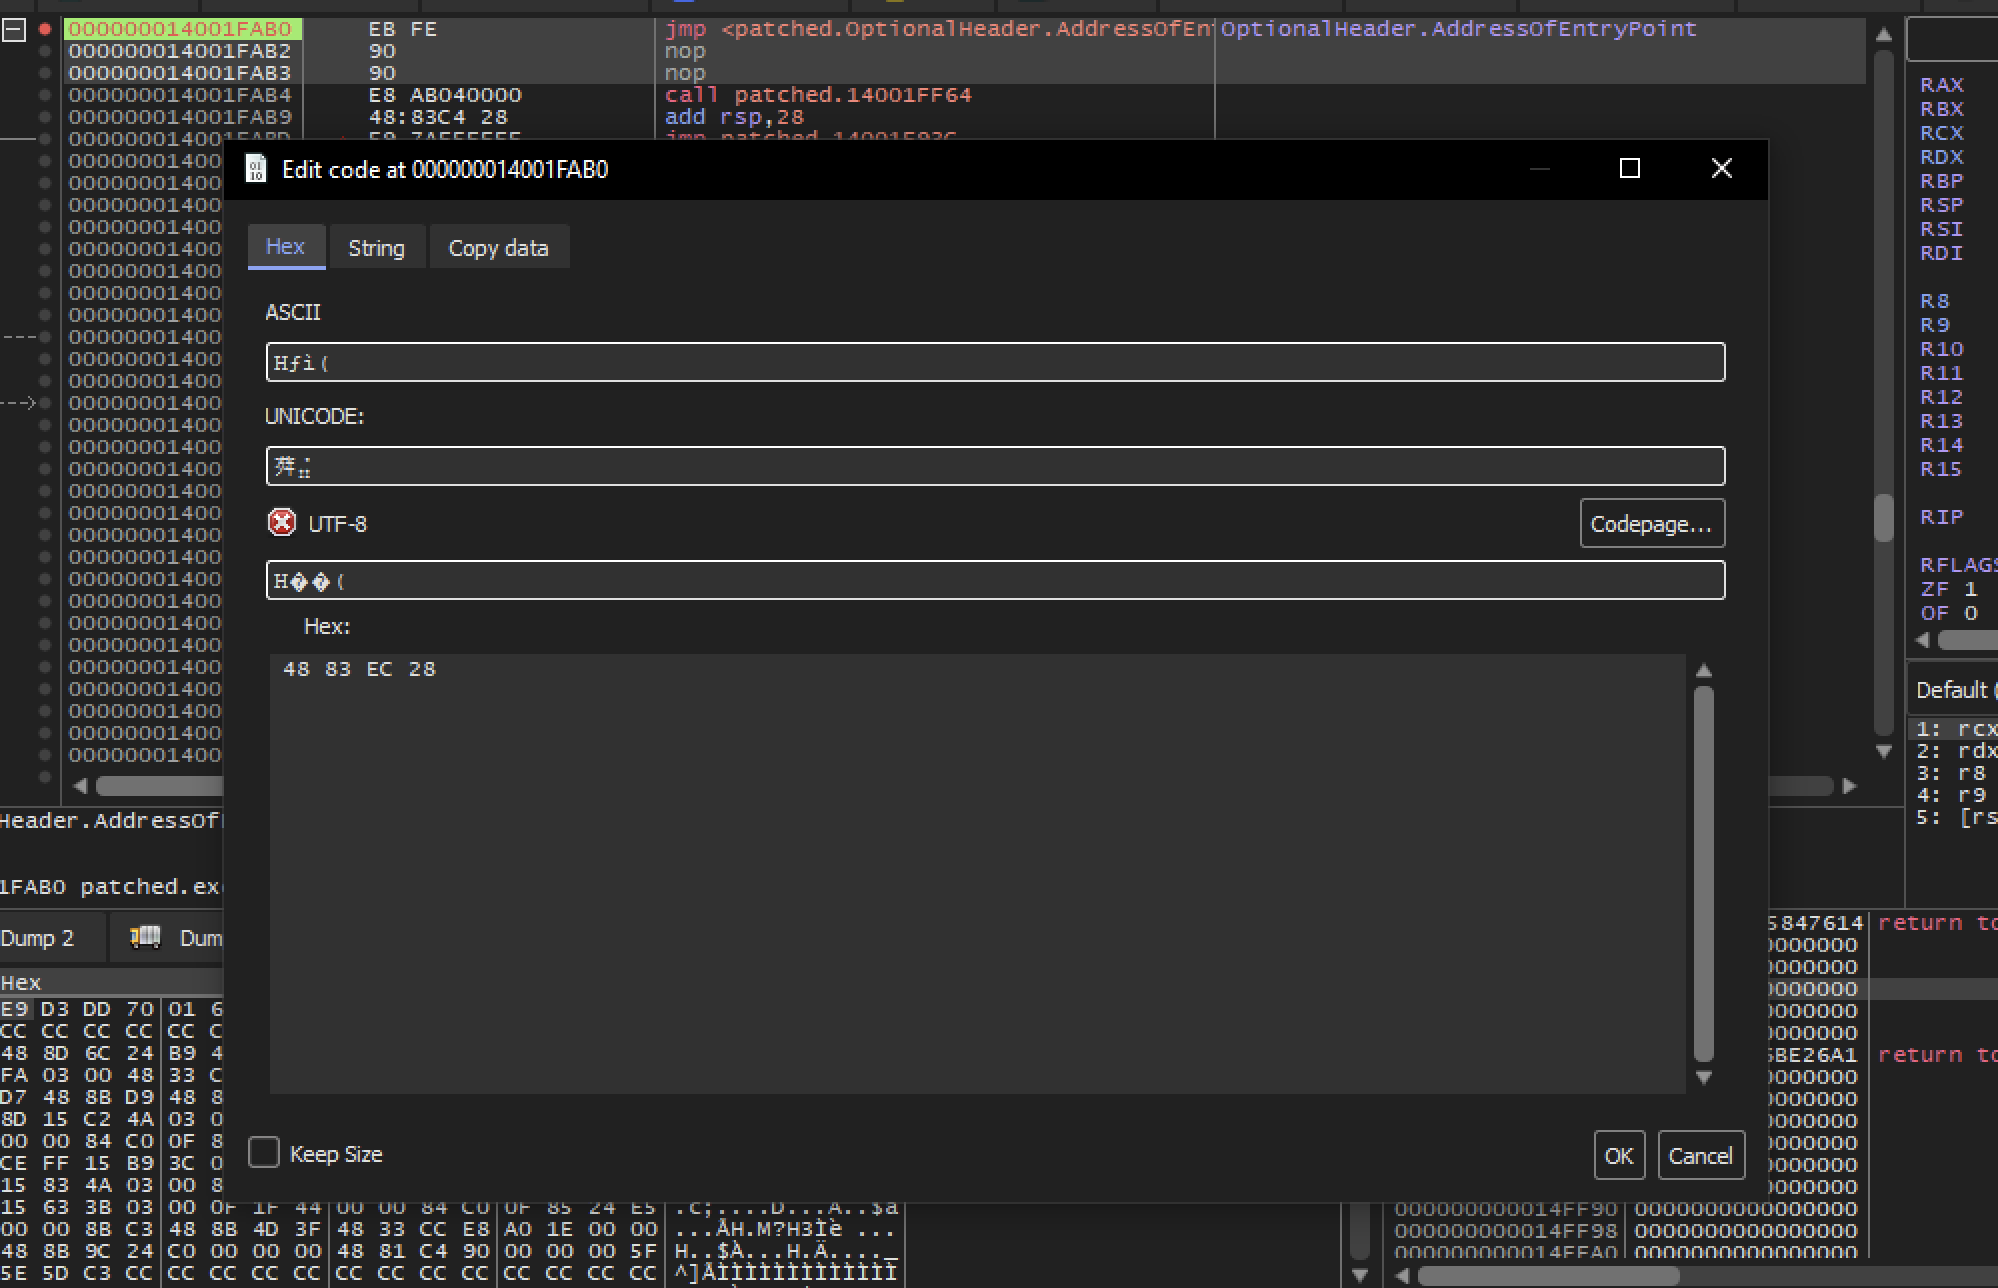
Now it will look like this.

Let’s continue running the program.
Reached the hardware breakpoint.

It’s comparing one byte at the beginning of the api with the opcode E9.
below there’s FF and 25 which actually correlates with another type of jump instructions.
<aside>
📌
Key takeaway: These 3 comparisons check whether the first bytes of the API are jump instructions (e.g., E9, FF 25). If they are, it can indicate the API has been hooked by a security product or analysis tool.
</aside>
Malware that performs these kinds of checks. will often times then attempt to overwrite the hooked API code with the original bytes, from the DLL on the disk.
Effectively removing the hook.
To investigate how the malware achieve this let’s go the function that actually contains these comparison instructions.
Copy the address of the comparison instruction.
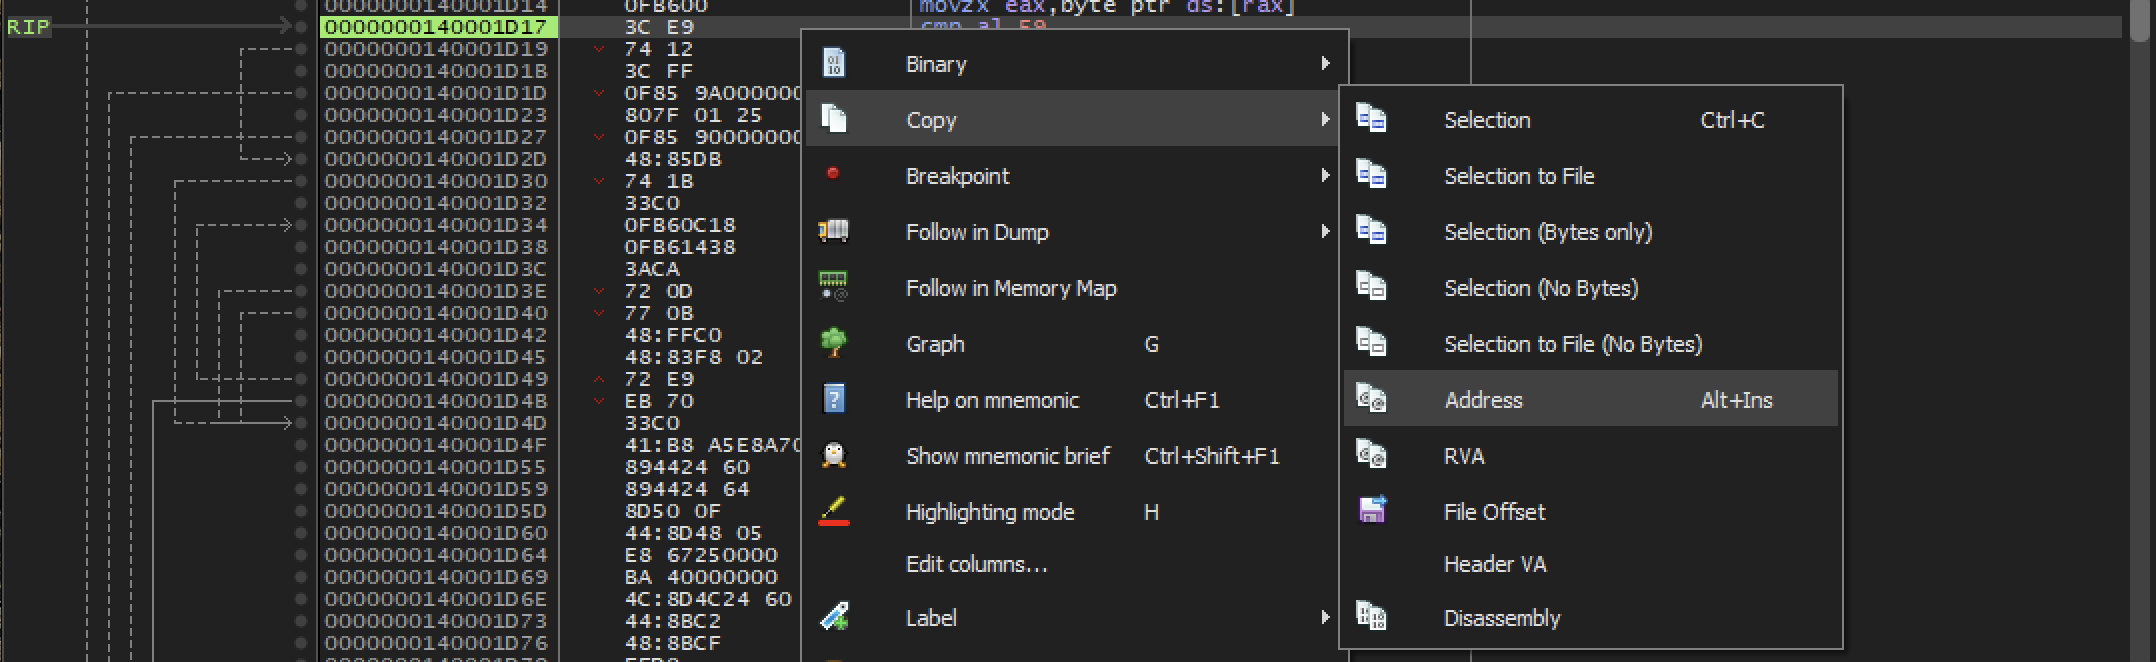
First comparison address:
0000000140001D17Ghidra Analysis
Open the find.exe original sample in ghidra and go to the comparison address.
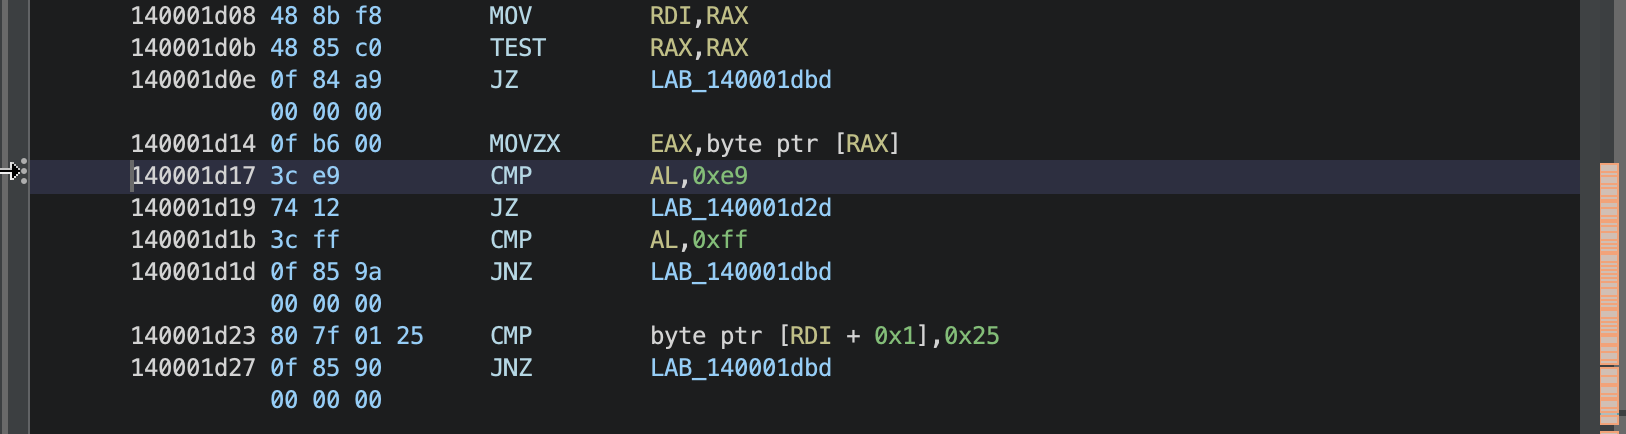
Before going any further. You might be wondering is there another way that you would be drawn to this function besides the debugging efforts we just did?
And there is with the knowledge that API unhooking often involves, looking for opcodes associated with the jmp like hex E9 or FF 25.
What you could do is go to search —> program text in ghidra.
search for the opcode e9.
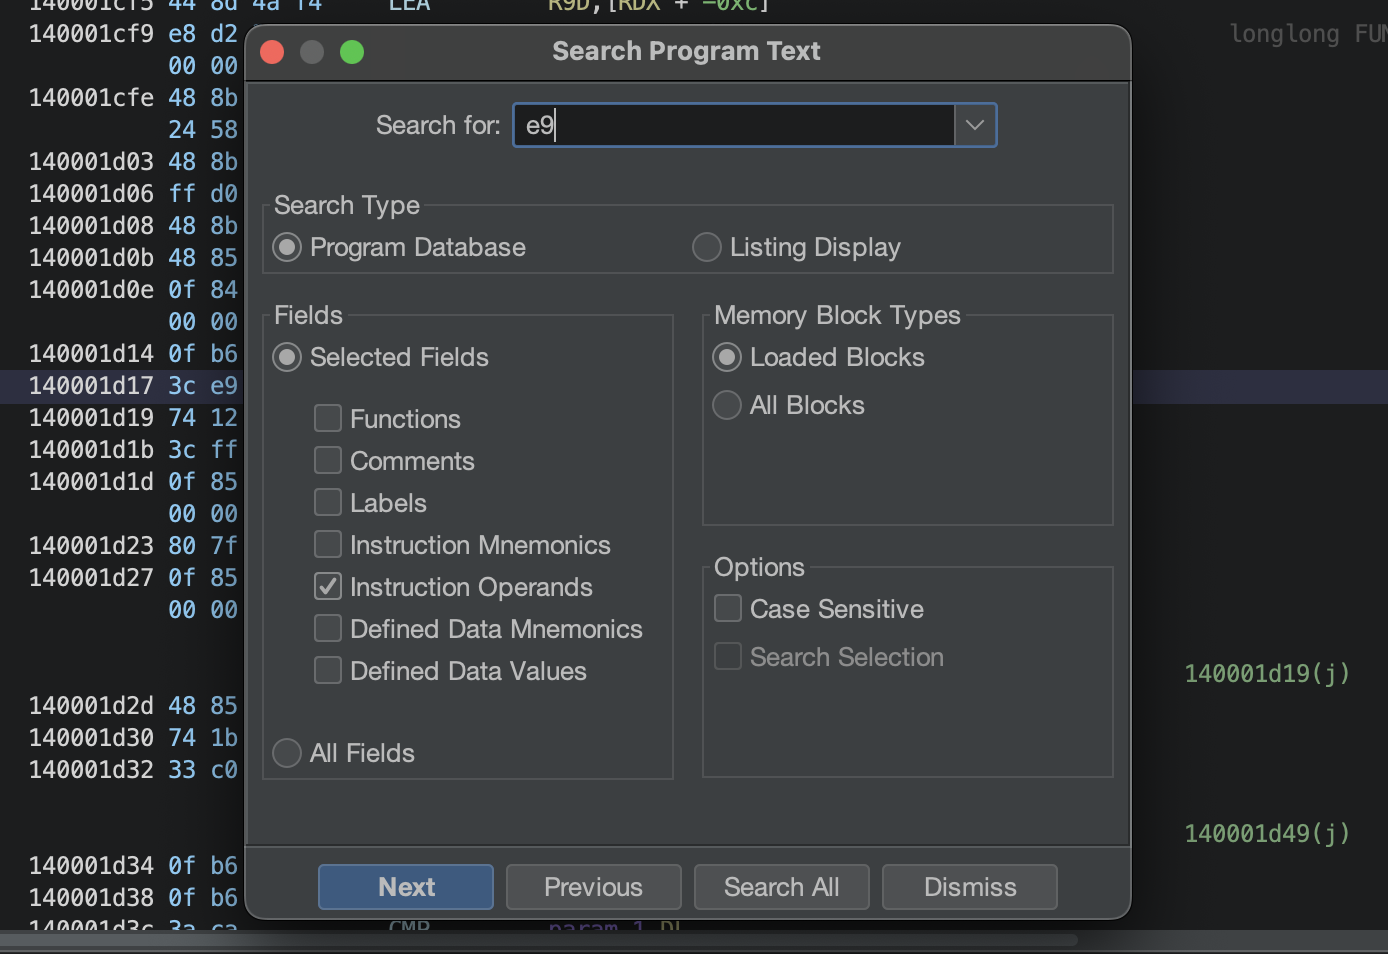
We get around 100 results.
sort it by preview. focus only in those which have comparison instructions. Only where the operand is E9
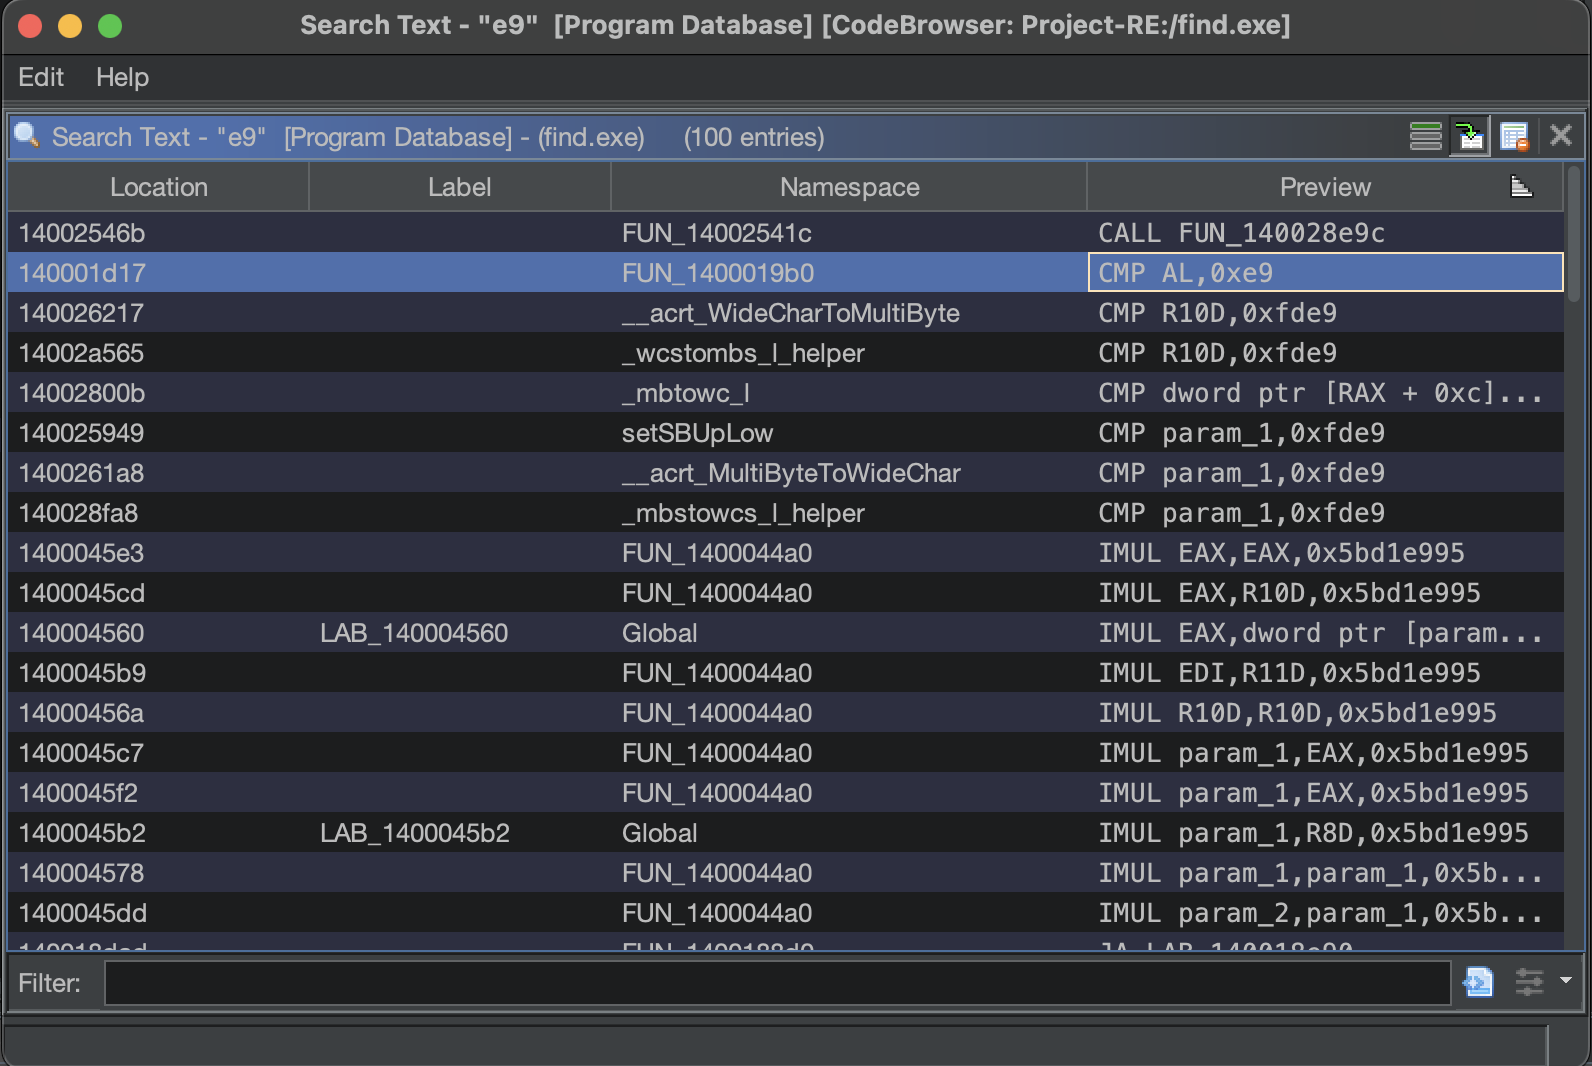
This is yet another way to that you might arrive or identify a function, possibly looking for jumps. Which could indicate that an API has been hooked.
Back to the Function.
Scroll up a little you will see a a lot function calls specifying RAX as the target.
In other words these registers are going to contain the address of the function that actually called. There are many cases here where the call instruction calls RAX or the address contained within the RAX.
This is referred to as an indirect call because again the function actually called is specified during the execution.
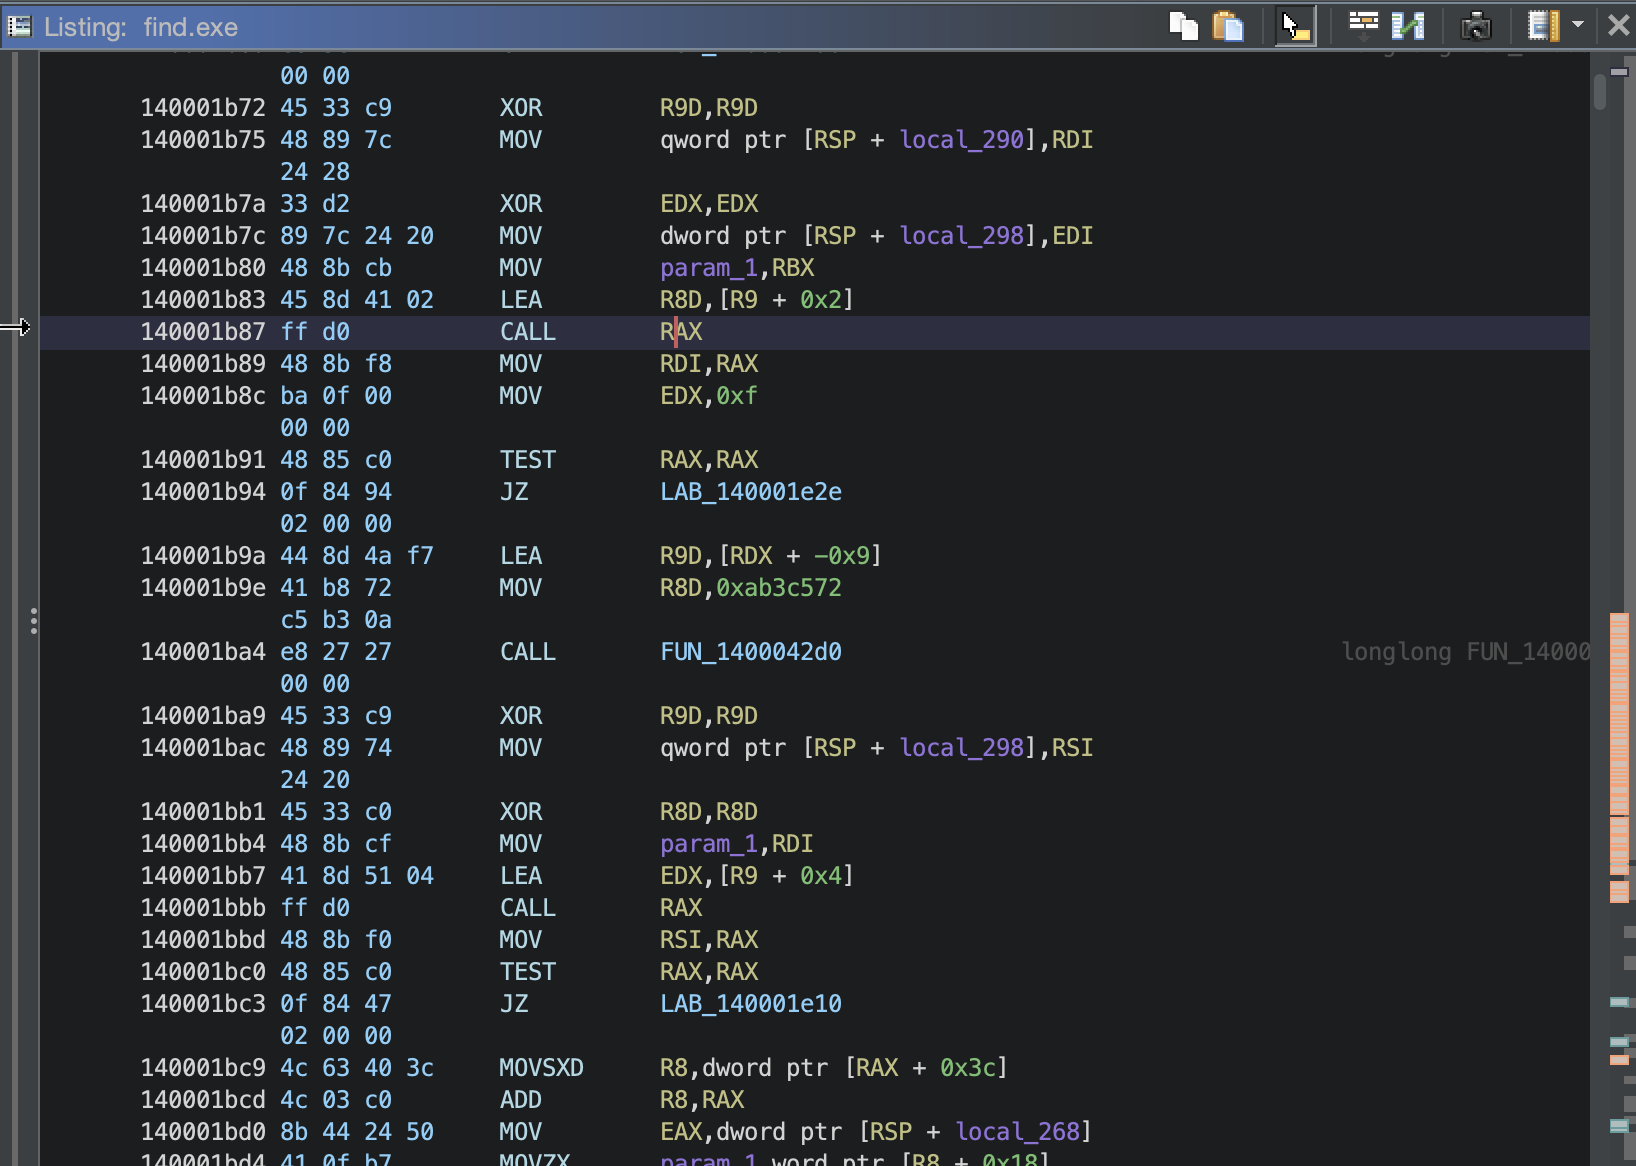
You’ll also notice is prior to each call to RAX there is a call to another function which is FUN_1400042d0 . One of the argument that is passed to this function is a hexadecimal value. This is actually an indication that we might be looking at in this function is API hashing.
To know what these function calls are actually referencing just continue debugging the program. and see what api’s are referenced by these calls to RAX at runtime.
IF we go back to x64 DBG scroll a bit.
Where i currently reside is a call to RAX.
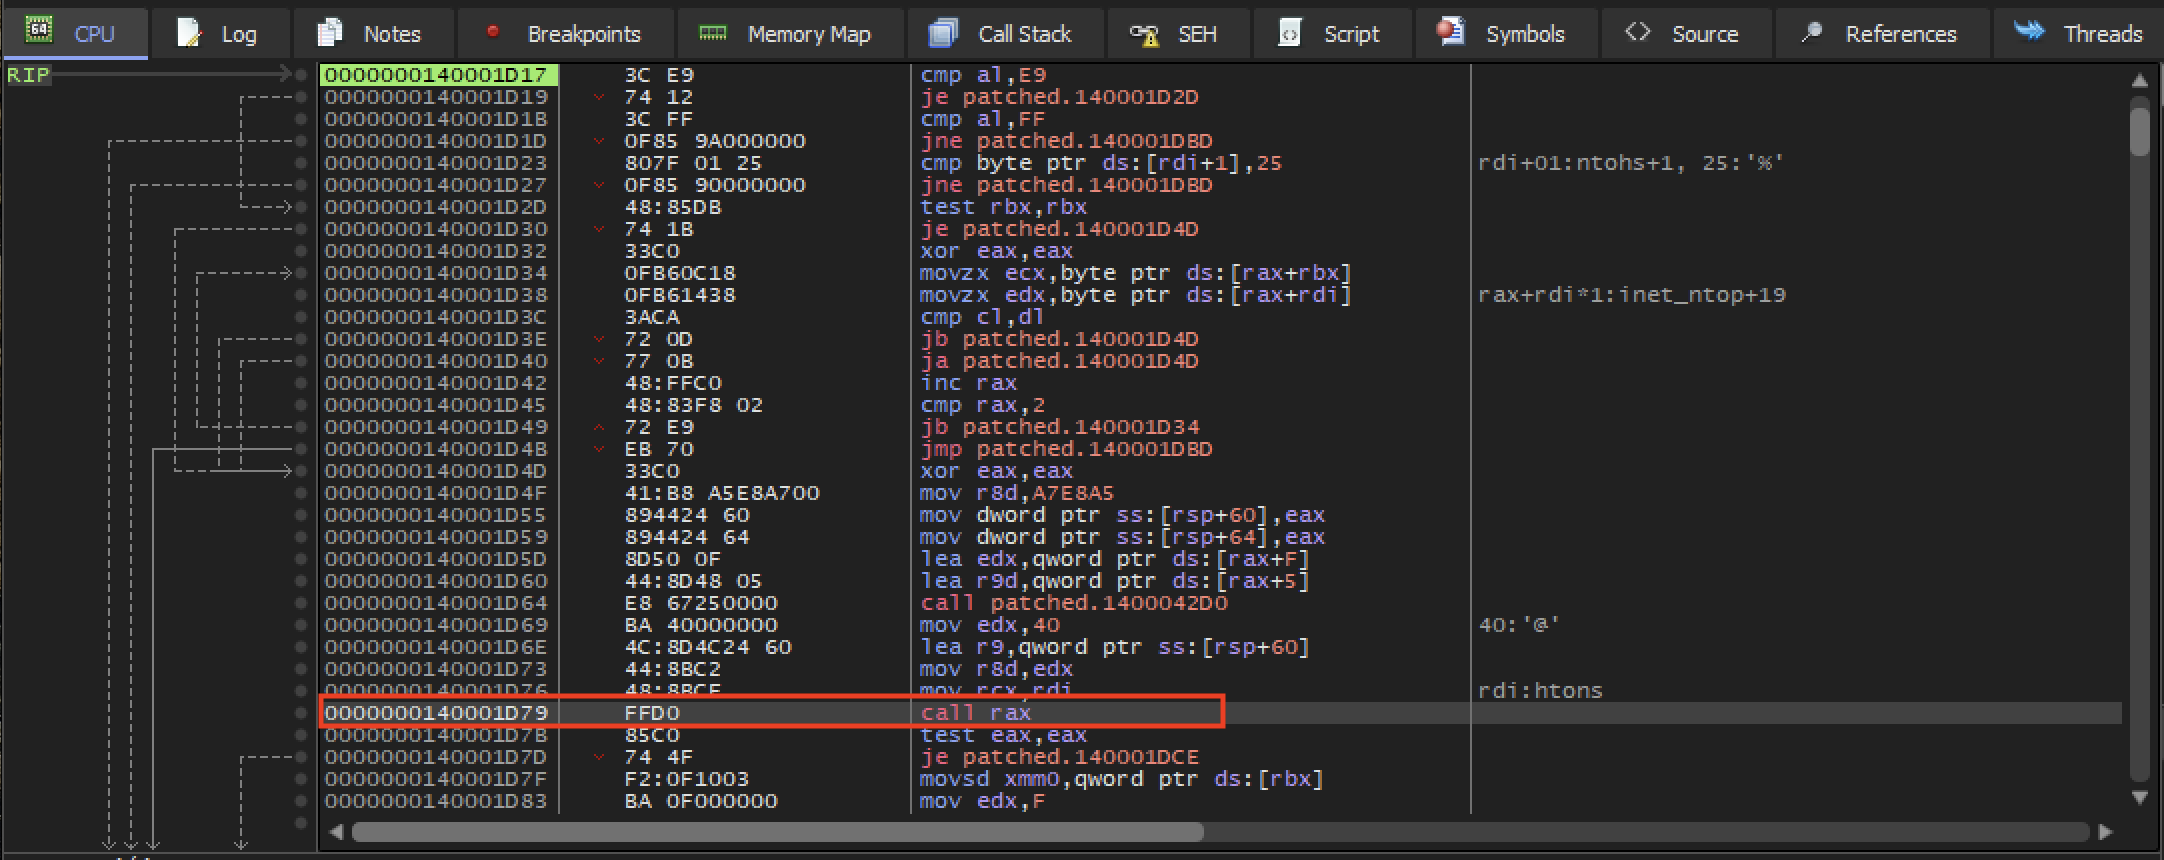
To evaluate the contents of RAX we have to run until selection. select the instruction go to debug then run until selection or press F4.
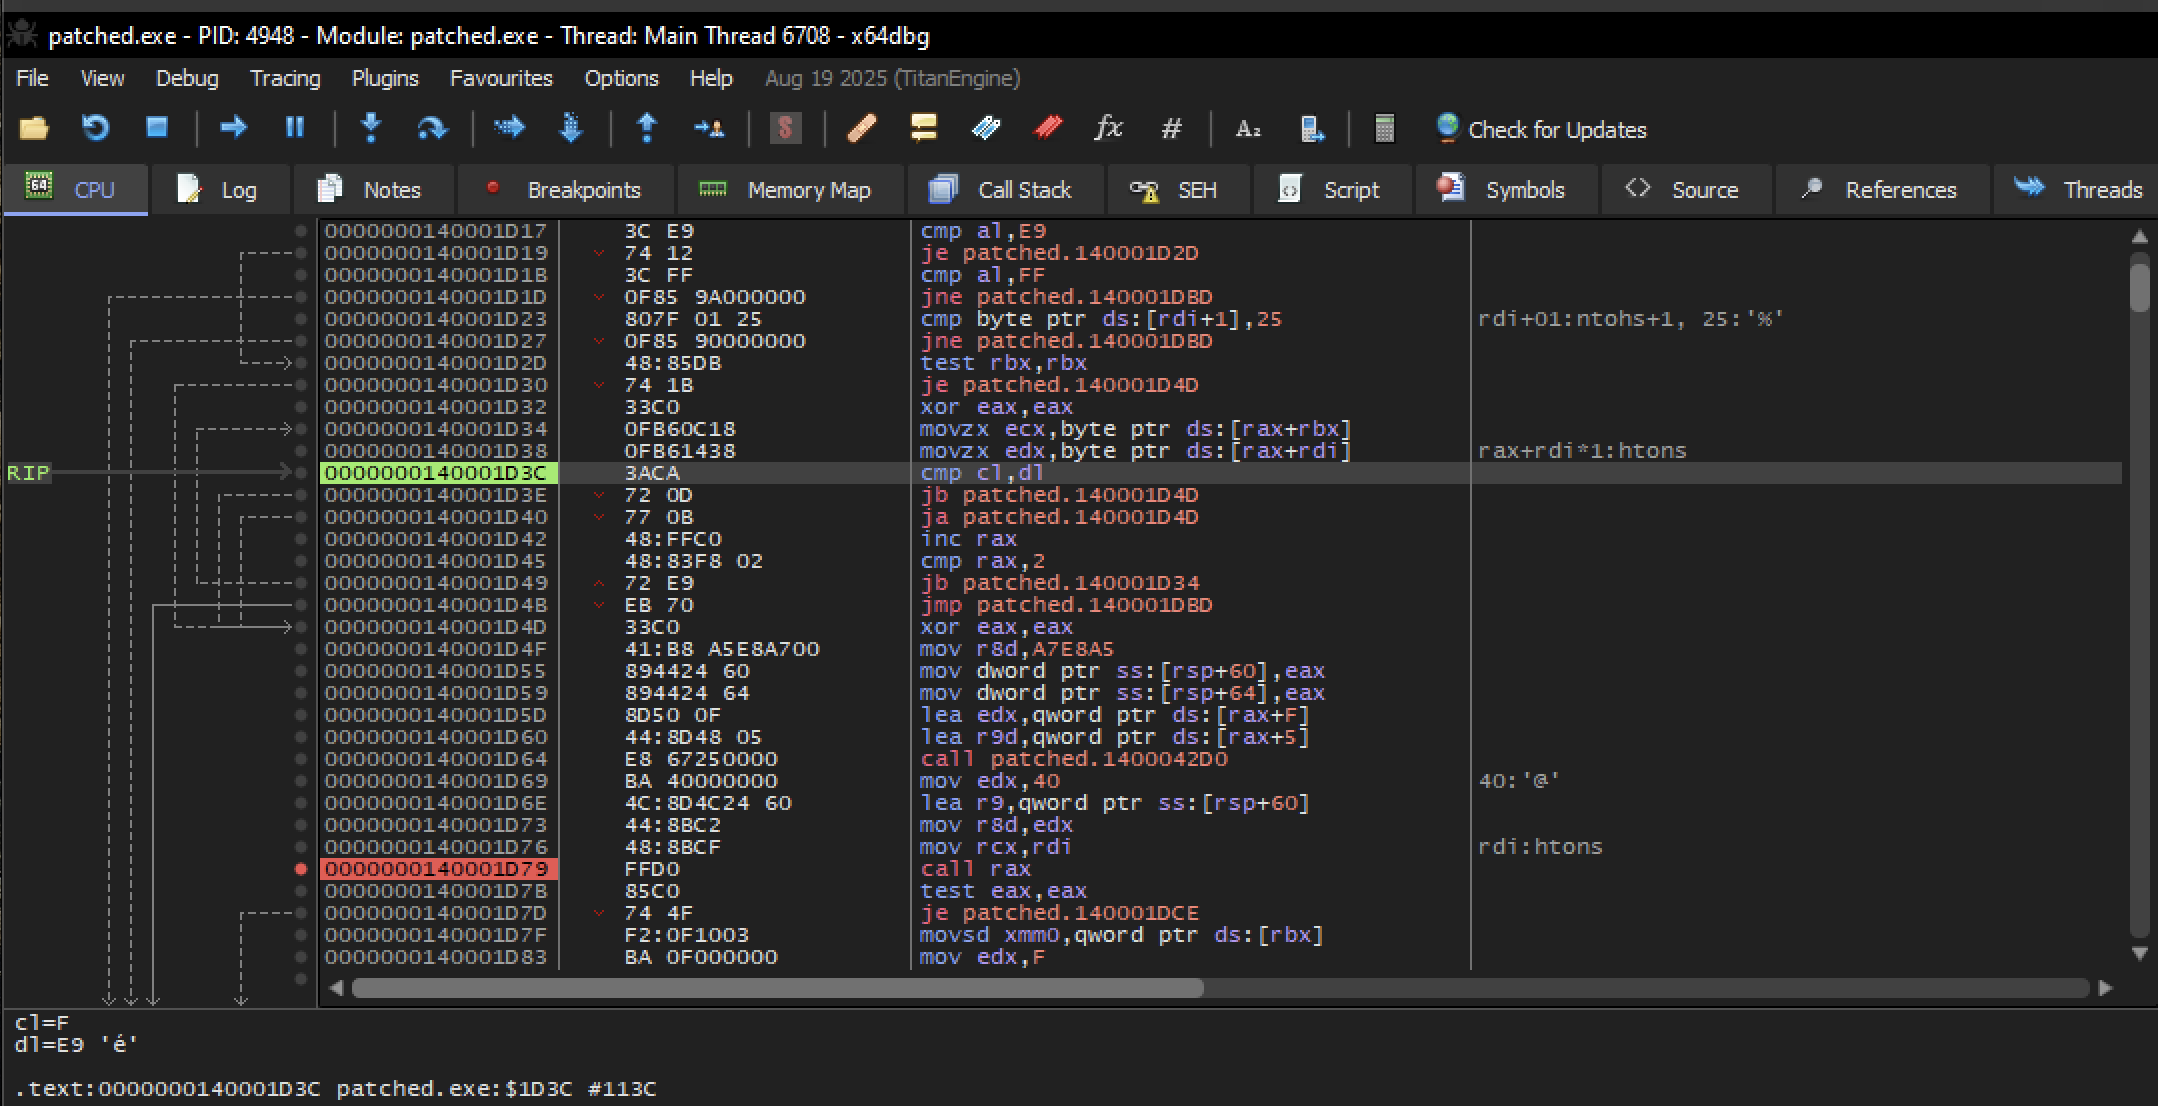
you can see we haven’t yet reached the particular instruction. At the bottom left it looks like we hit the hardware breakpoint.
So disable the hardware breakpoint. and continue running.
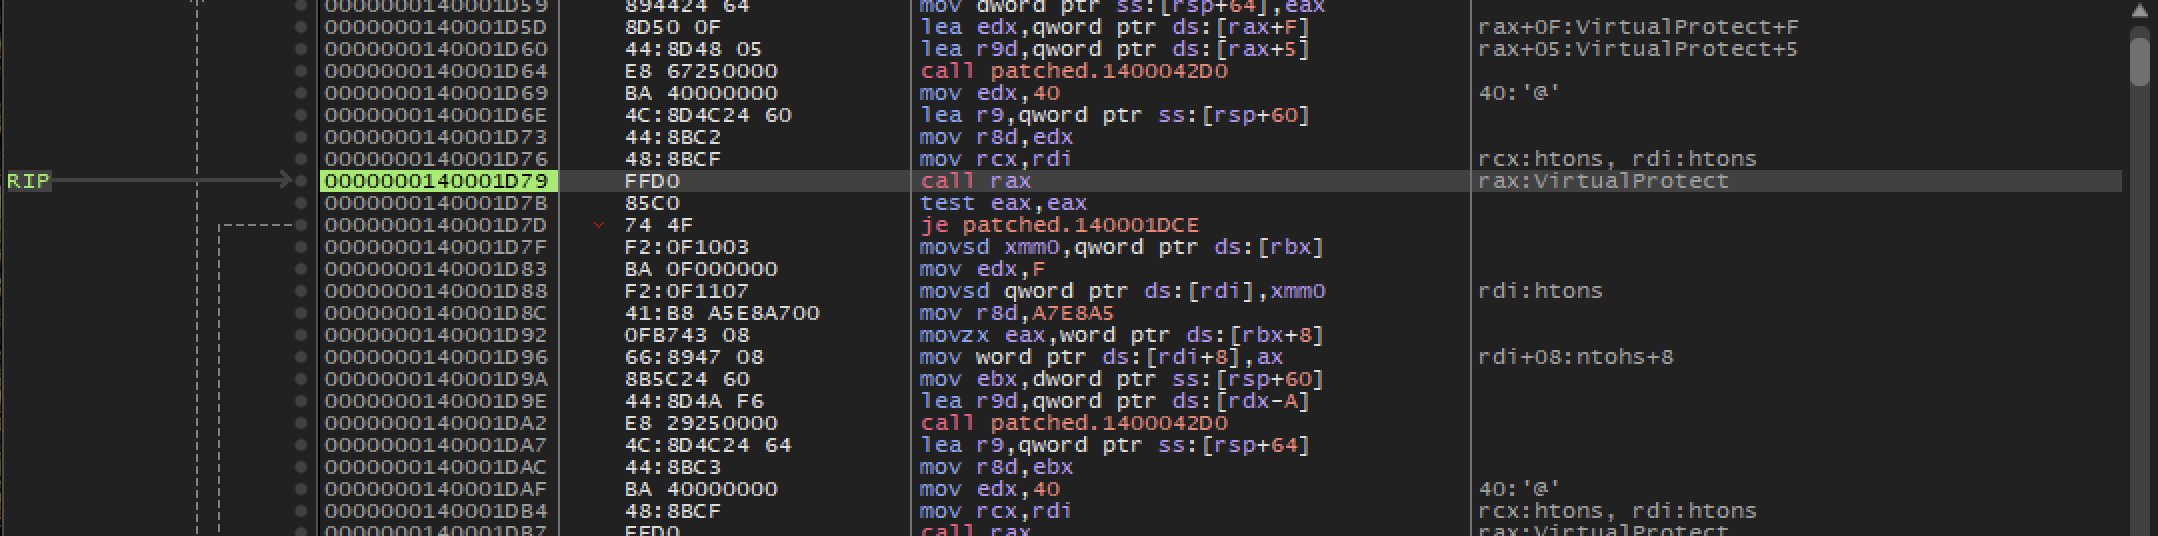
Now we arrive at the call to RAX . and there’s a auto generated comment that say’s VirtualProtect.
so at the address 0000000140001D79 is a virtualProtect
0000000140001D79 | FFD0 | call rax | rax:VirtualProtectlet’s add comment to ghidra.
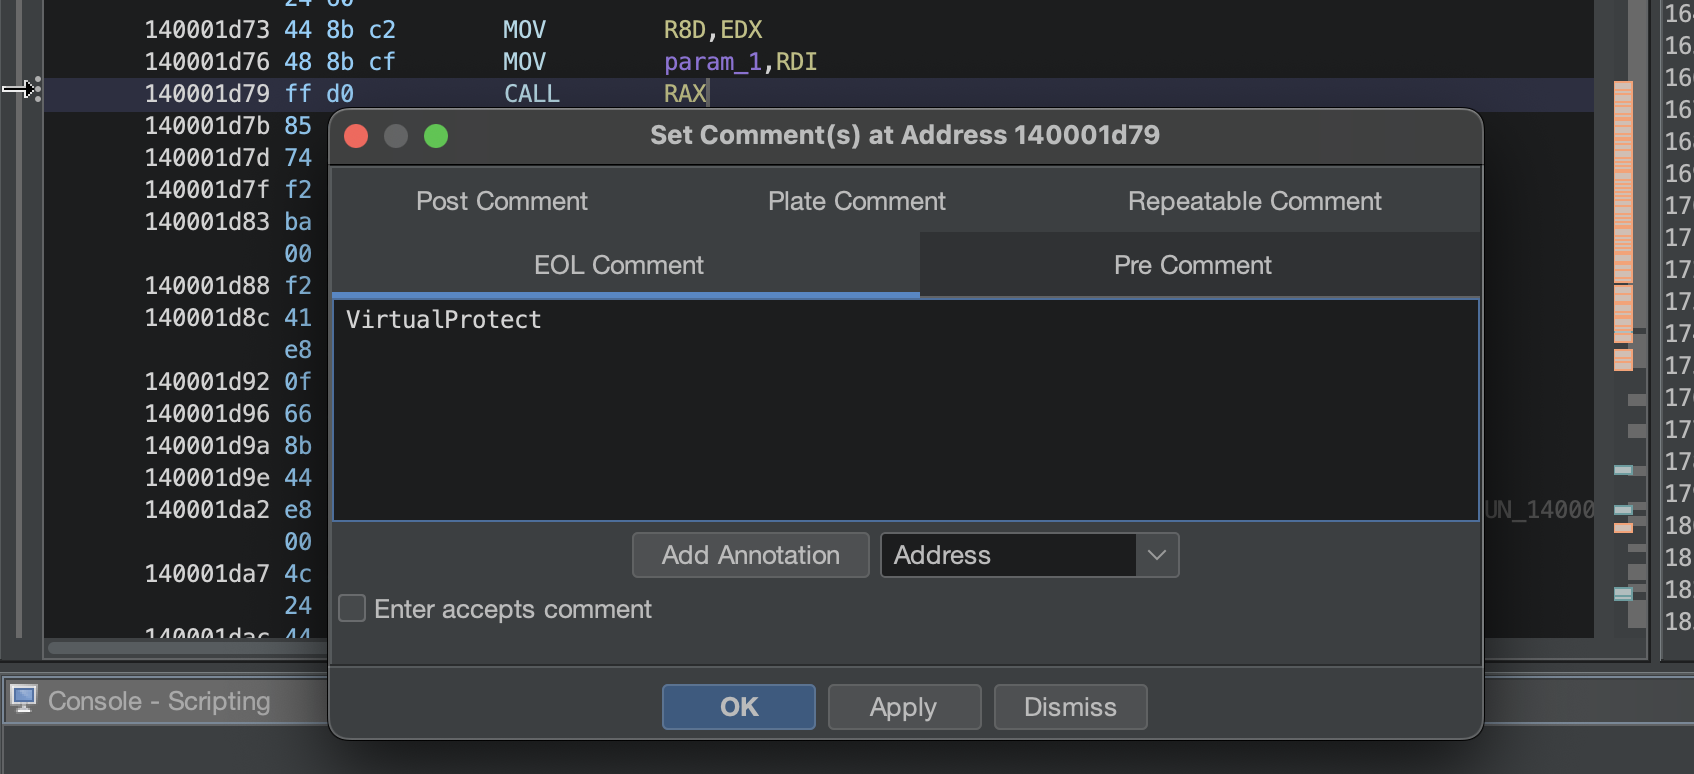
In order to better understand this function. I could set breakpoints on various calls to RAX. And then comment ghidra with the appropriate API references.
I’ve actually done that to speed of our analysis.
Key API’s called by this function. So you can understand how they work together in order to perform API unhooking.
At the top of the function we get a call.
GetModuleFileNameW
This API takes a handle to a dll. That is already loaded in memory and it gets the file name for that dll.

CreateFileW
The first argument passed to CreateFileW. which specifies the file to actually get access to is the file name returned from the previous call to GetModuleFileNameW.

You might ask why is the program accessing a file from disk that is already loaded in the memory.
Next we have
CreateFileMappingW followed by MapViewofFile
These two API’s work together to effectively load a module from disk into memory. In this case a DLL.
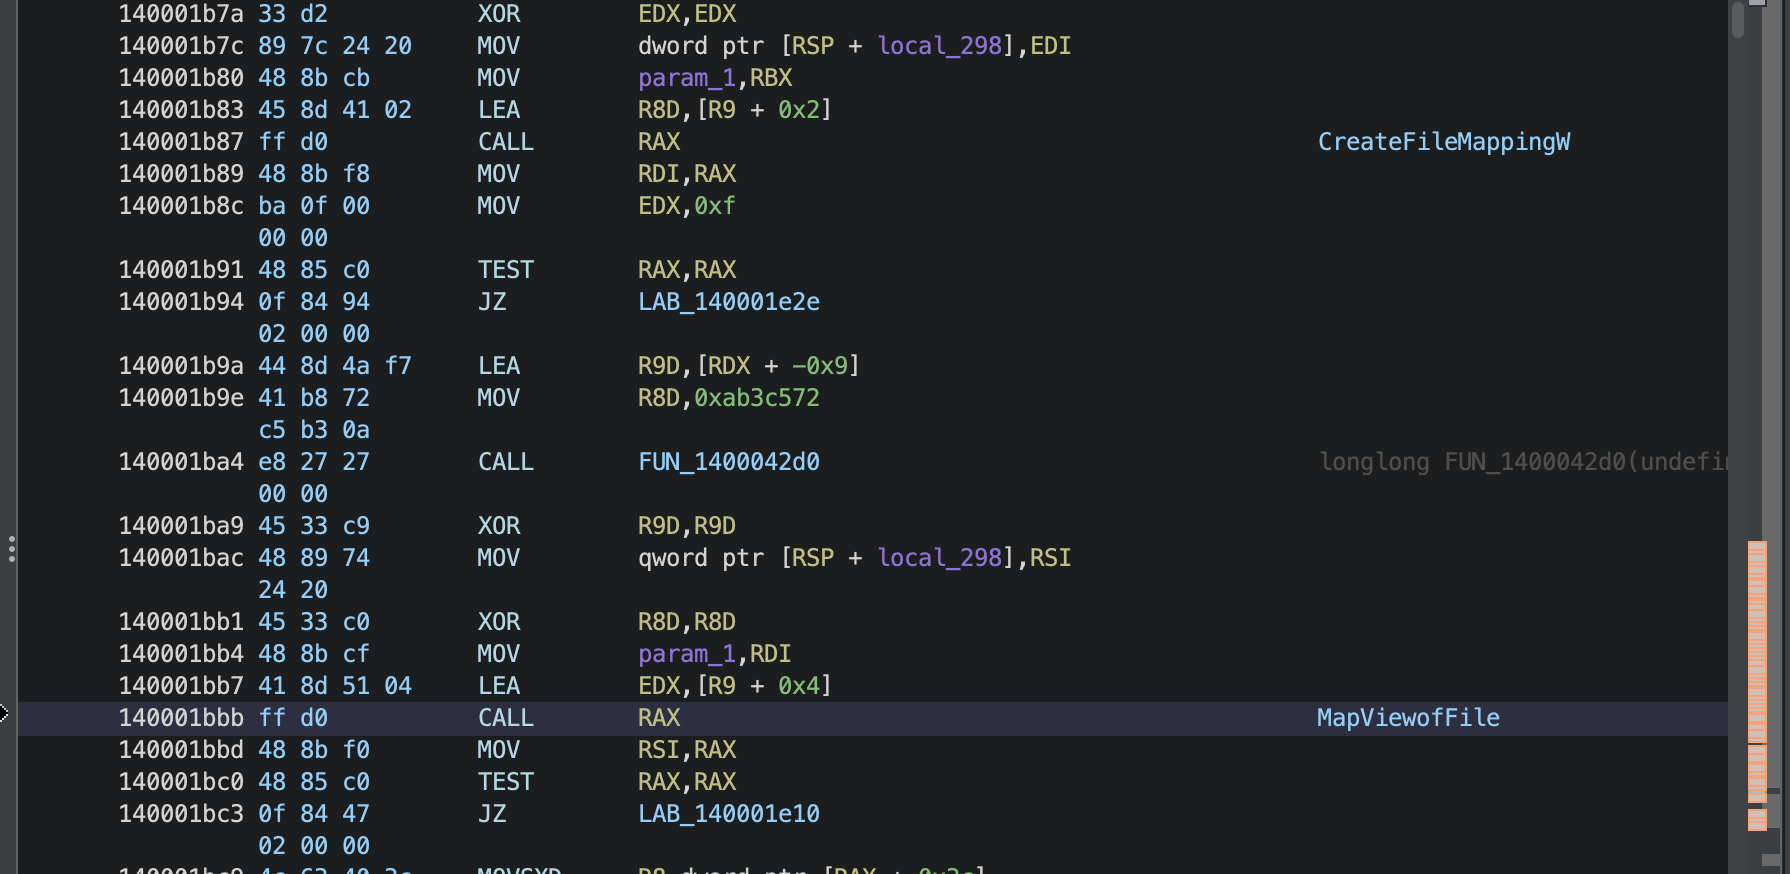
At this point there would be essentially two versions of DLL loaded in memory. One that is loaded as a part of normal execution of find.exe and another loaded using these calls to create filemapping and map view a file.
This function then proceed to effectively iterate to all exported functions from all dll’s loaded in memory in order to identify if any of them are hooked.
Continuing scrolling in ghidra will arrive at the code that contains the compare instructions.
E9, FF, 25

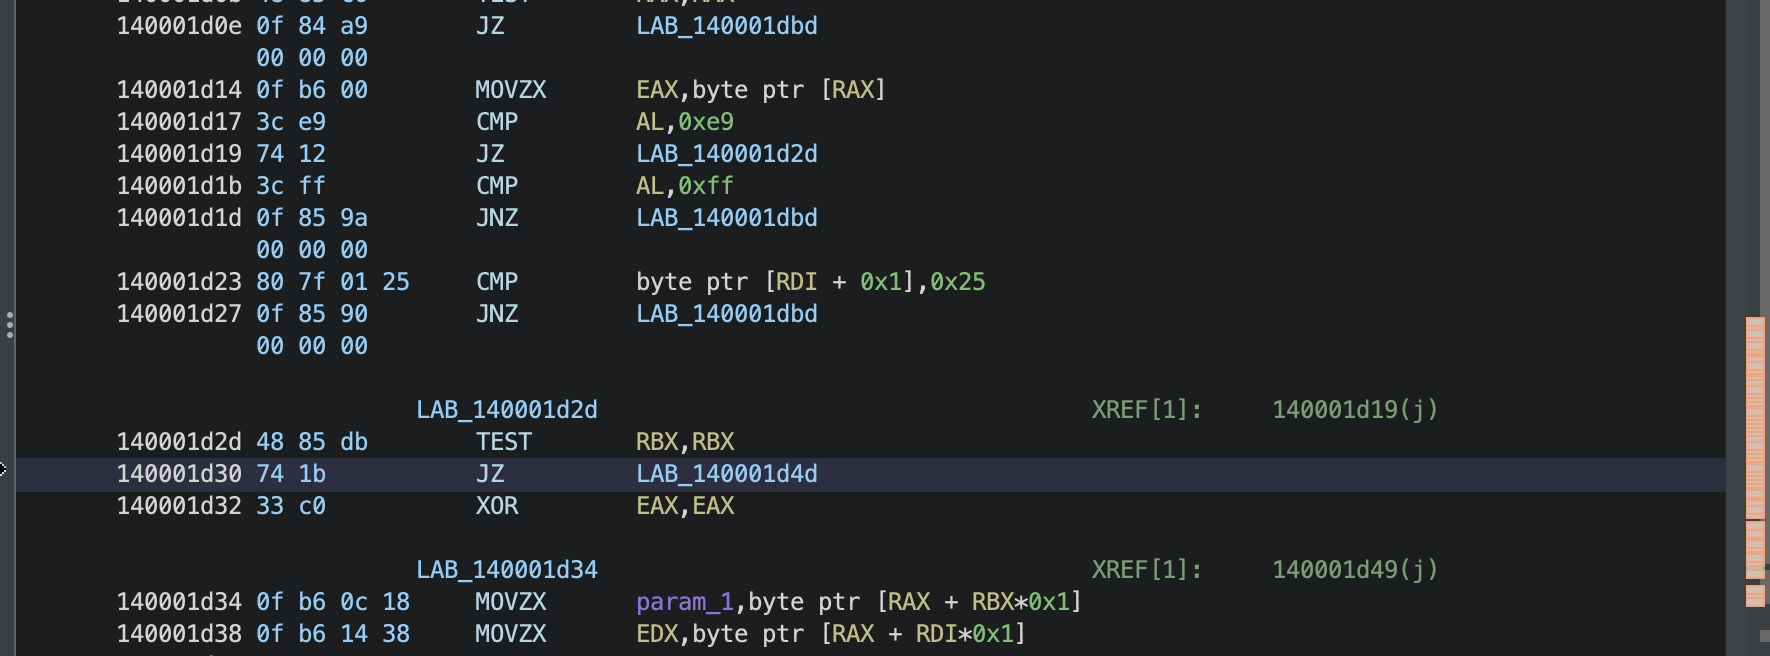
If this function identifies that a hook is in fact in place. It will take this jmp
140001d30 74 1b JZ LAB_140001d4dFurther down we eventually arrive at VirtualProtect. Which will update the permissons of the hooked API in memory. Such that it will be writable (RWX).
This will allow the malware to overwrite the hooked API.
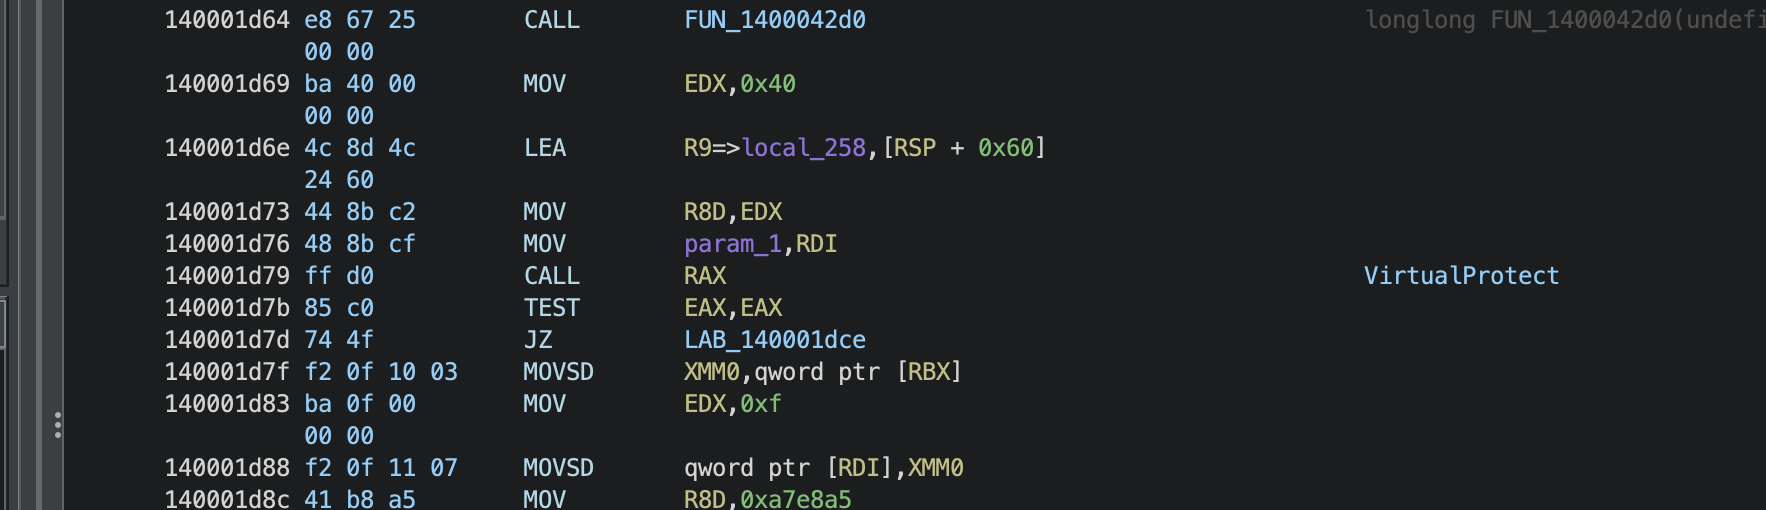
After VirtualProtect the program call’s these MOVSD instructions.
Which will basically copy over bytes from the original code of the API. Which has now mapped into memory. and overwrite the hooked API.
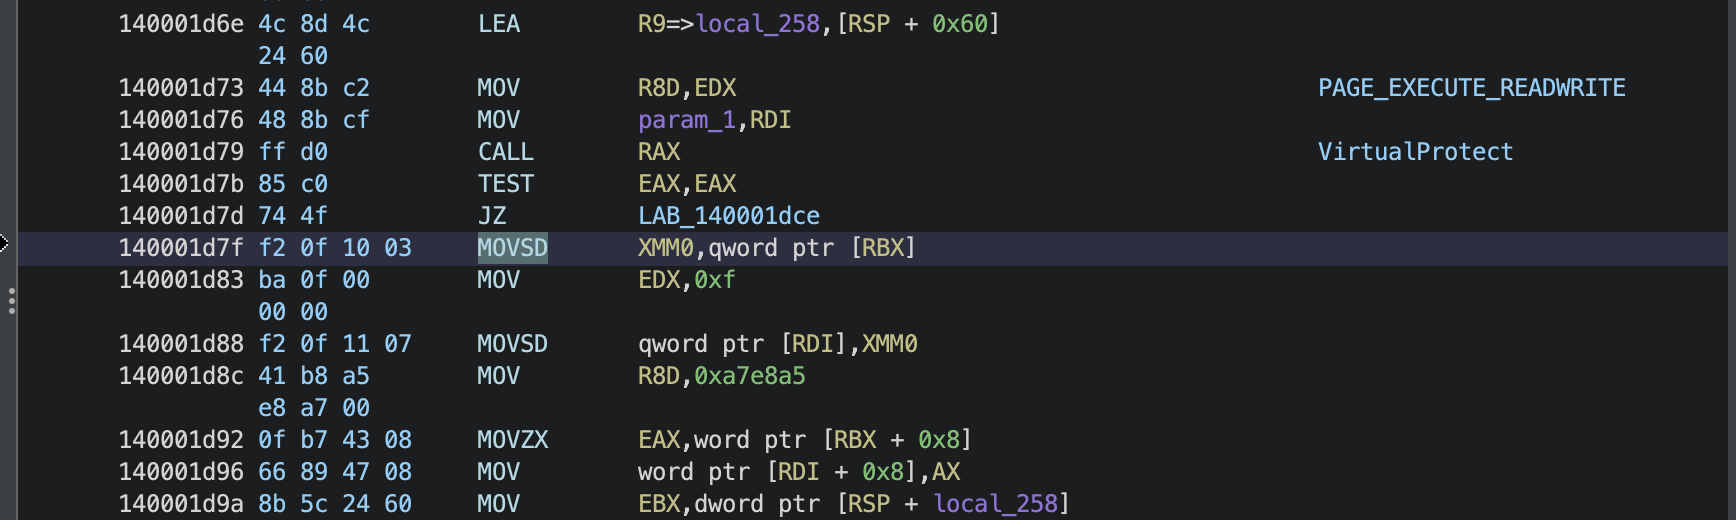
After that it again called VirtualProtect. but this time with PAGE_EXECUTE_READ permissions. effectively restoring the original permissions of the API
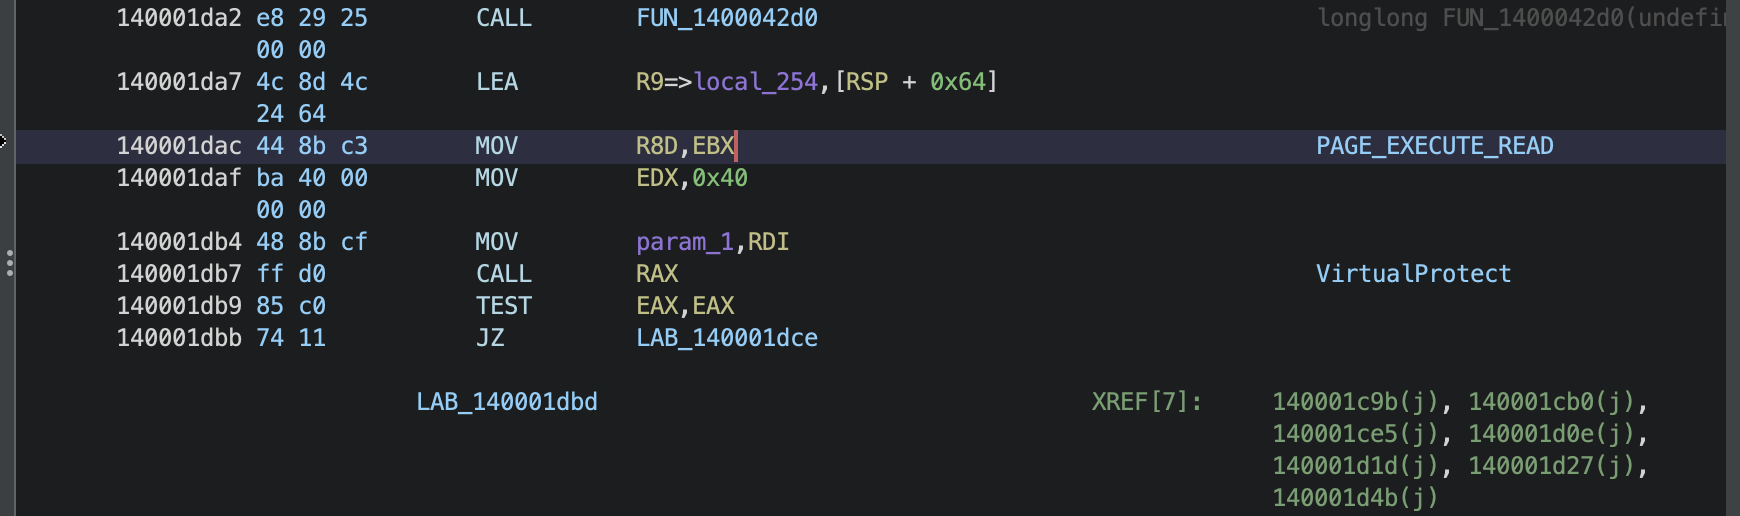
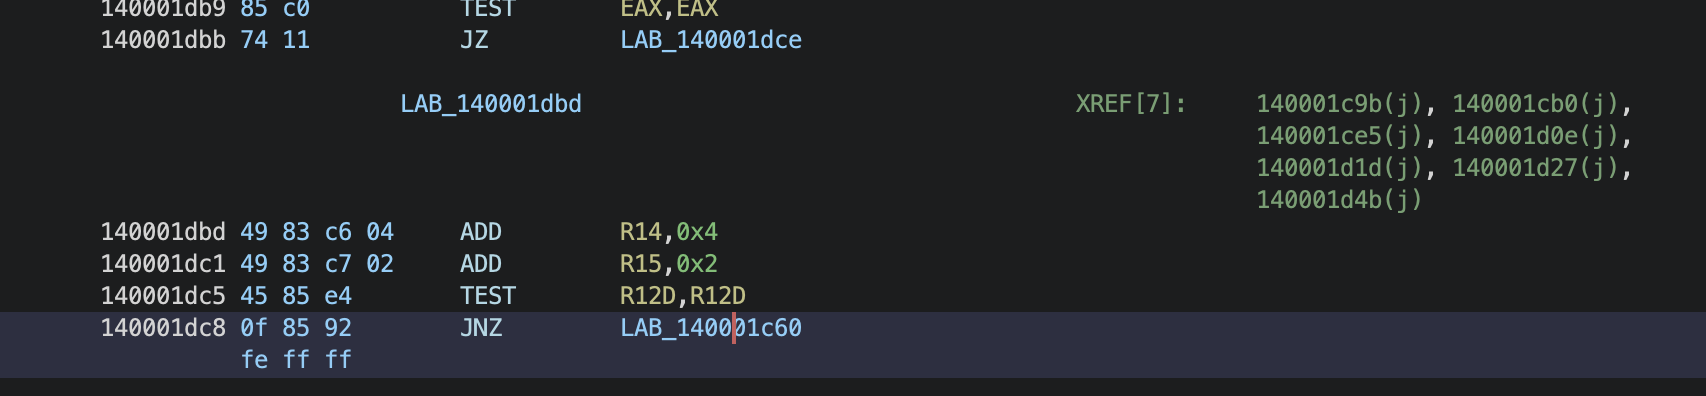
All these instructions are located within a loop you can see the condition down here it’s JNZ instruction. It evaluates if the loop should continue iterating and the loop allows malware to evaluate for the presence of API hooks in any dll’s that is loaded by this process.
Back to x64 DBG
currently resides at call to rax which is VirtualProtect. First call to VirtualProtect whic updates the permissions of the code that contain the hooked API.

Executing by hitting F8. Until movsd.
The operand at the right hand side references RBX.

RBX will contain the address of the api code that was manually loaded in the memory. Via call to mapview a file so this would be the original dll code. That resides on disk.
going to RBX at top right click and choose follow in dump.
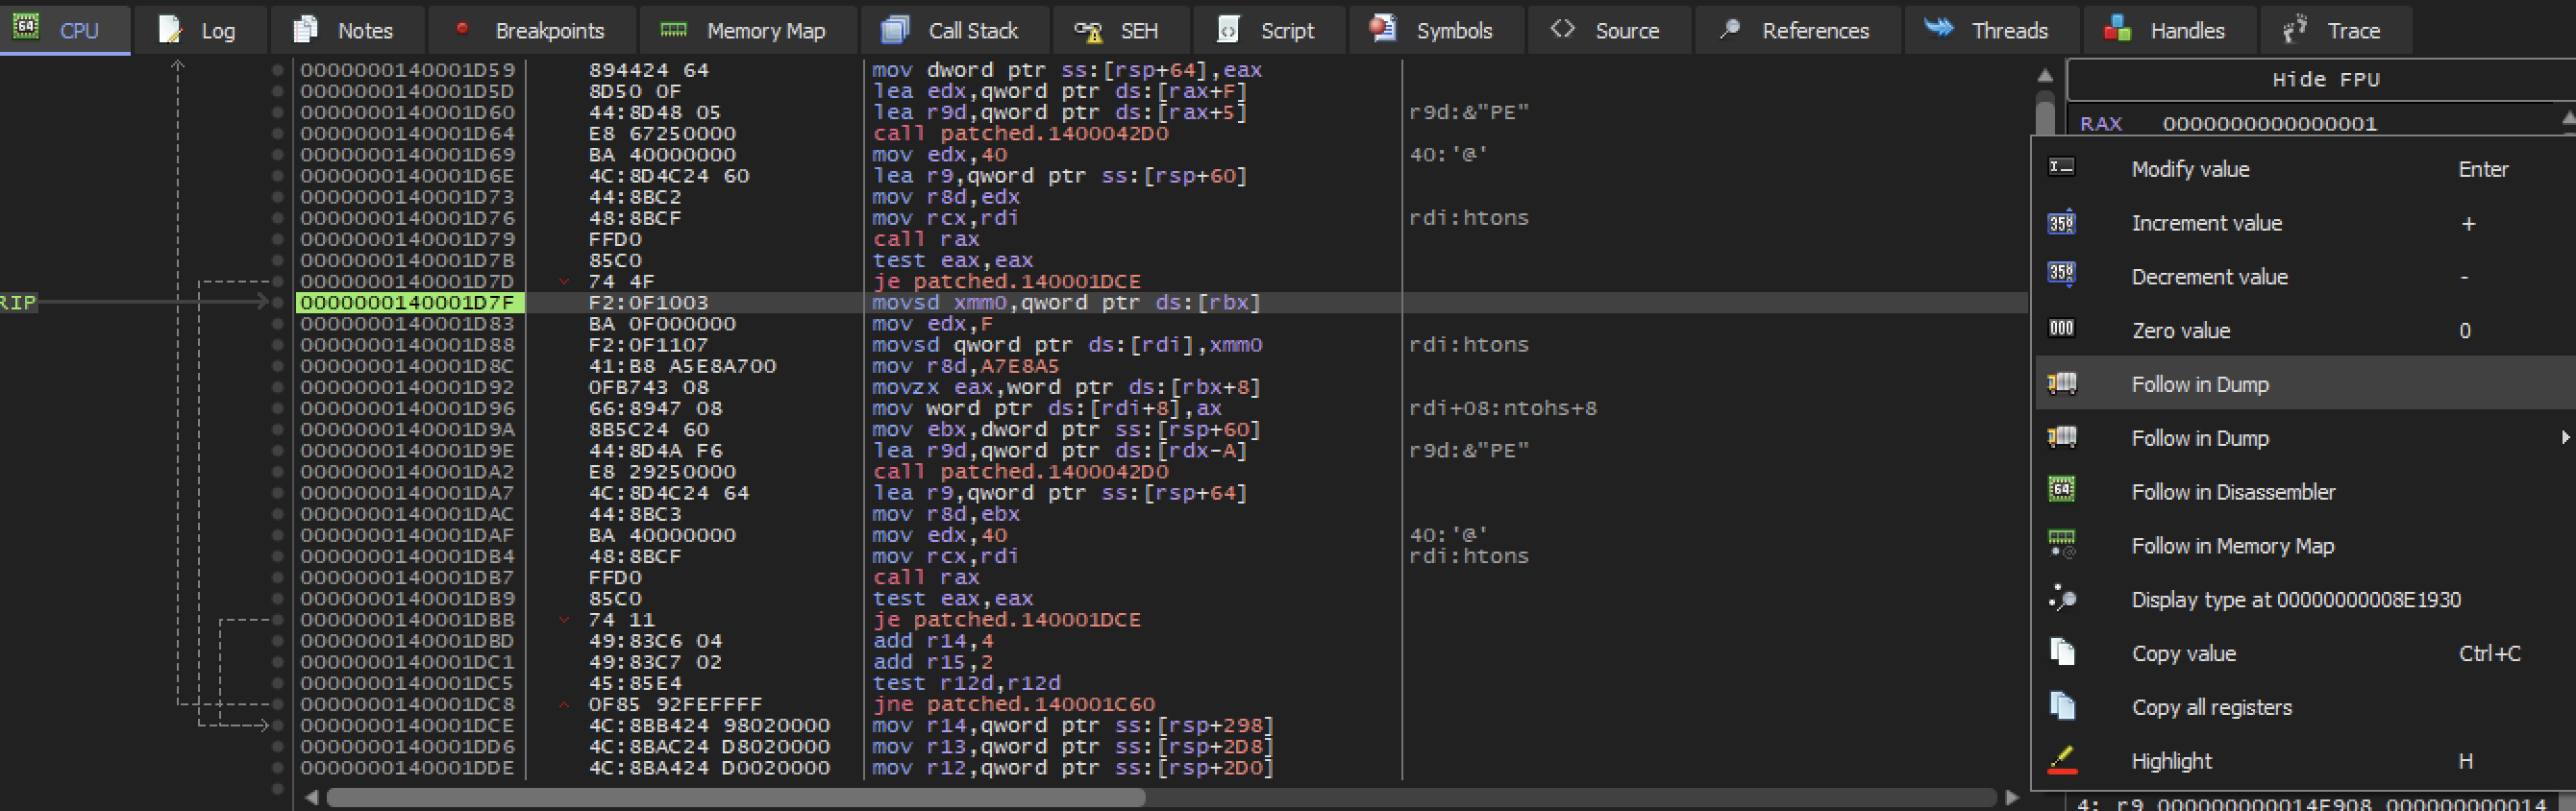
I’ll rename the DUMP 1
These are the original bytes of the API from dll on disk.
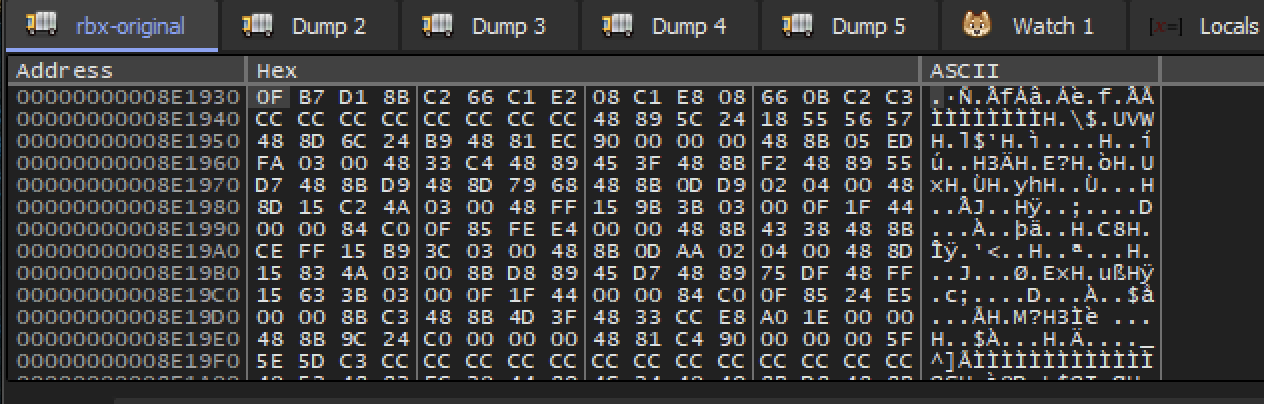
continue Executing
that’s going to place 64 bits of content from the original API code into xmm0 .
We can view the content of xmm0.
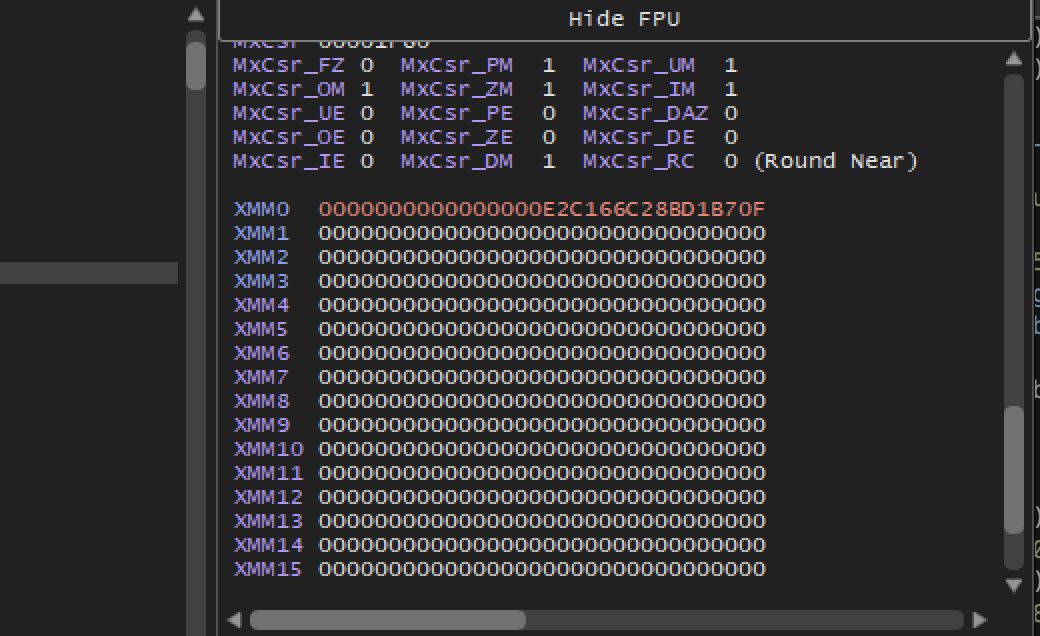
Continuing executing
now we arrive at the second movsd instruction.
which placing the content of xmm0 into the address specify by RDI .

We’ll dump the address within RDI .
Follow in dump 2
These are the hooked API bytes.
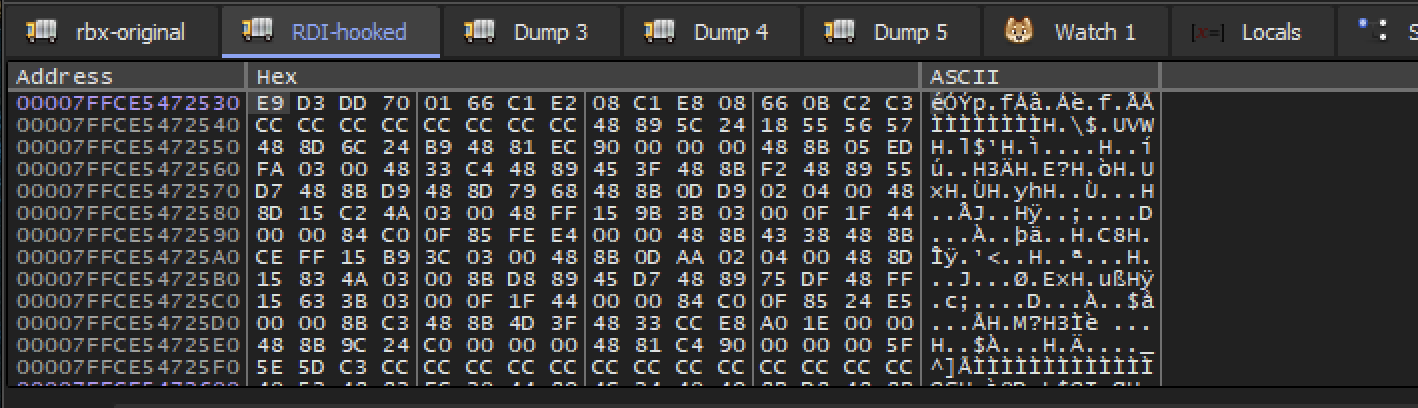
Contine executing.
We’ll keep an eye on RDI-hooked dump.
you will see those bytes changed
https://github.com/user-attachments/assets/7344b953-336c-416c-b732-4f0ac91f3170
If we compare it with the original they are the same.
SO the original bytes are in placed and the hook has been overwritten. Which means Malware has achieved API unhooking.